Square
Following
Hot
News
Profile

VitBand

vip
Active for: 4.3y
Peak Tier 5
No content yet
19
Following
26
Followers
239
Liked
While most retail investors are focusing exclusively on the upcoming Consumer Price Index (CPI), sophisticated capital is betting on today’s PPI.
These two indices are closely linked, but producer inflation provides the first and most important hint of what will happen in the U.S. economy in the near future. Historical data shows that a soft, low PPI often acts as a catalyst for the start of a local altcoin season. When pressure on the industrial sector eases, capital markets price in positive expectations for the month ahead.
If PPI comes in in the “green zone” (that is, below forecasts), we
BTC+0.83%
That same moment when you come to crypto for financial freedom and decentralization, but end up sitting at 12:30 UTC, holding your breath as you wait for U.S. officials’ report on producer inflation.
All the magic of blockchain temporarily takes a back seat when U.S. macro data takes center stage. Bitcoin’s chart now looks like a compressed spring. Trading volumes have locally declined, as nobody wants to risk big capital right before the PPI release. While big players wait it out, retail traders are spinning conspiracy theories. I decided to play it safe: moved some of my assets into stableco
BTC+0.83%
  • 6
  • 1
Over the past few months, we have seen a clear trend toward a gradual cooling of the US economy. Inflation indicators are slowly but steadily returning to target levels. Personally, I’m moderately optimistic about today’s release of the September US PPI. I expect the report to confirm a slowdown in producer price growth. If my expectations are met, it will lift a huge burden off investors’ shoulders. Lower inflationary pressure will give the Federal Reserve room to ease policy more aggressively at upcoming meetings. The crypto market has long been waiting for a powerful fundamental catalyst to
BTC+0.83%
Many crypto newcomers do not understand why figures from the traditional U.S. financial sector have such a strong impact on the price of Bitcoin. Let’s break down why today’s September PPI is so important. PPI is the Producer Price Index. Put simply, it shows how much it costs to produce goods and services at the initial stage.
If it becomes more expensive for producers to make their products, they have to raise final prices for consumers. This means that a high PPI almost always translates into a high CPI (Consumer Price Index) a month later. That is why the Fed views PPI as a leading indicat
BTC+0.83%
For those who prefer scalping and active intraday trading, today's PPI release at 12:30 UTC is the perfect time to catch quick moves. U.S. producer inflation data almost always creates strong momentum on BTC and ETH charts. The main rule during these moments is not to give in to emotions and FOMO.
The best strategy for a scalper during the release of macro data is to wait for the first candle to close, let the market “digest” the news, and enter a position only after the trend is confirmed, rather than trying to guess the numbers. If PPI comes in positive (below expectations), you can look for
BTC+0.80%
ETH+0.43%
The macroeconomic calendar is extremely hot today,
and the crypto community is holding its breath in anticipation of the September US PPI. This is a great opportunity to test our community’s intuition on Gate Square!
Let’s hold a small poll on the market’s further movement. What do you think: will the September PPI come in higher or lower than analysts’ consensus forecast? The possible scenarios are very simple, but enormously important for our portfolios. A reading above expectations would signal sticky inflation, forcing the Fed to keep rates high (this is negative and means a red market).
post-image
BTC+0.83%
Crypto Trading and Its Impact on Bitcoin and Volatility
Only a few hours remain until the September US PPI index is released at 12:30 UTC.
Experienced traders know that the real show begins in the market at times like these.
Bitcoin traditionally reacts to such news with high volatility, forming so-called “helicopters”—sharp impulses in both directions to sweep liquidity and liquidate excessive leverage.If the actual PPI figures come in below market expectations, we will see a powerful upward impulse. Buyers will try to break through the nearest resistance zones and update local highs. Howeve
BTC+0.80%
All eyes on the PPI data today at 12:30 UTC. High volatility in BTC usually begins just minutes before and after the release. If the figures come in below forecasts, Bitcoin could well test new local highs. What are your longs/shorts? 🚀#ShareWeekly #USCPISoon
BTC+0.83%
Today is a key day for macroeconomics! We are awaiting the release of the September US PPI. If producer inflation shows a decline, this will give the Fed more room to further ease monetary policy and cut interest rates. We are waiting for positive news for the crypto market! 📉📈#ShareWeekly #USCPISoon
🚀 Why is $BTR rising so sharply today?
Bitlayer ($BTR) has once again attracted traders’ attention today—the token is up about 60% over the past 24 hours,
The interest appears to be supported by several factors at once: renewed attention to Bitcoin Layer-2, speculative demand after the deep drop, and the project’s small market capitalization, which means an inflow of new capital can quickly move the price.
It will be interesting to see whether $BTR can hold above the local highs or whether we will see a correction after such a pump. 👀
#BTR #Bitlayer #Bitcoin #Crypto #GateSquare
BTR-2.92%
BTC+0.83%
On the 1-hour chart, ZILUSDT.P (Zilliqa futures contract) is dominated by a downward bearish trend, and the price has updated its local low. The current market value is 0,002304 USDT.
Below is a structured technical analysis for Gate Square in Ukrainian:
📊 Current situation and indicators
Trend indicator: The dynamic moving average has remained consistently red. The latest local upward price rebound (August 14) was stopped by this line, after which another selling impulse occurred, confirming the strength of the resistance.
Lower-panel oscillator: The signal lines crossed in the upper zone an
ZIL-1.22%
On the 1-hour chart, PYTHUSDT.P (Pyth Network futures contract) is developing a bearish trend after forming a local top. The current market price is 0.03889 USDT.
Below is a technical analysis for Gate Square in Ukrainian:
📊 Current situation and indicators
Trend indicator: The dynamic moving average is colored red, and the price is consistently trading below it. The bulls' latest attempts to break above this line ended with the formation of long upper wicks, indicating strong selling pressure.
Lower-panel oscillator: The signal lines have crossed in the negative zone and are pointing downwar
PYTH-6.28%
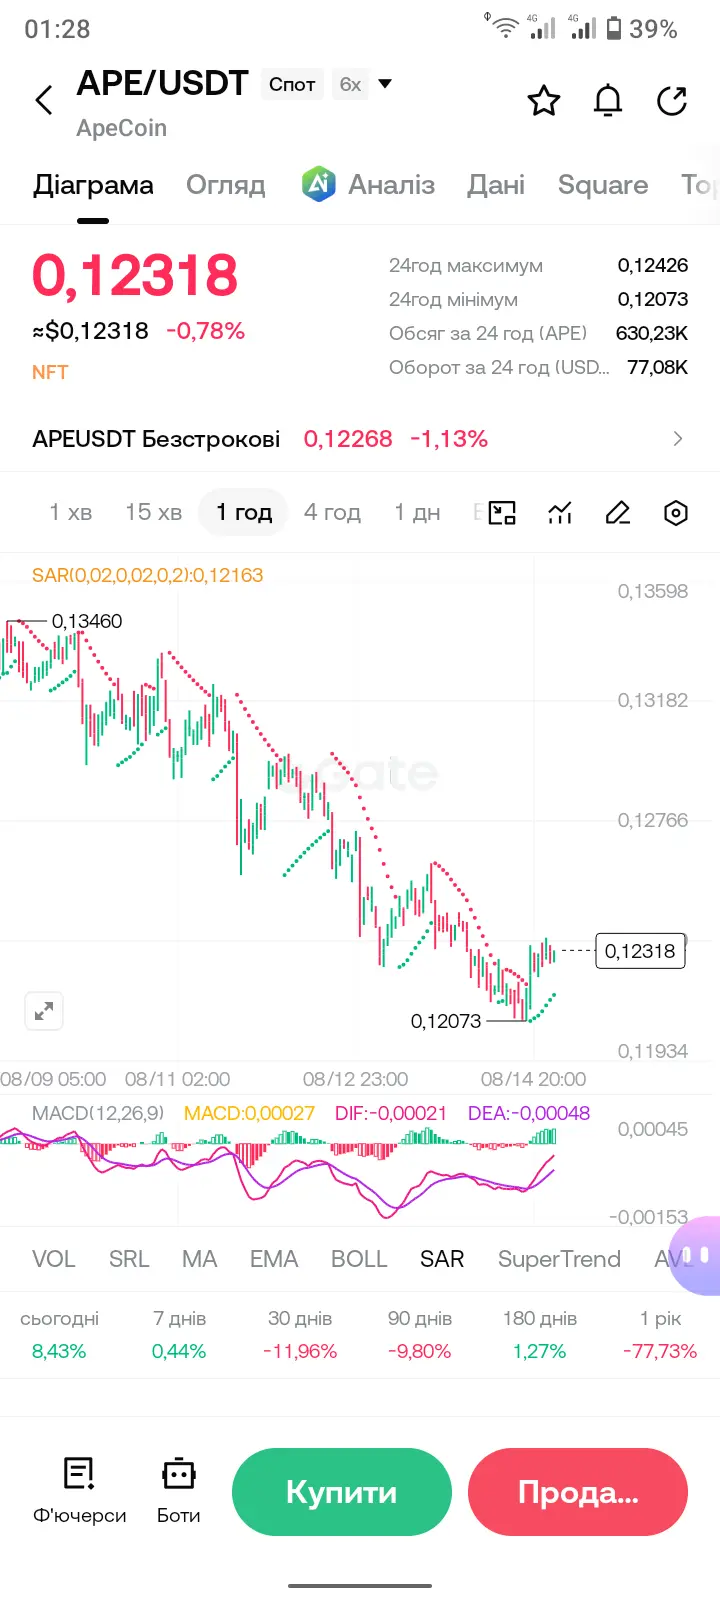
📊 Current Situation and Indicators
Trend indicator: The dynamic moving average remains red, while the price is moving below it, confirming the global dominance of sellers on this timeframe. However, the latest hourly candle shows a sharp green impulse toward the indicator line.
Subwindow oscillator: The signal lines crossed in the lower trigger zone, forming an upward exit (green dot). The green line crossed the red line from below, indicating the development of upward momentum and the beginning of a local upward correction after a prolonged decline.
📌 Key Price Levels
🔴 Resistance: Buyers
post-image
APE-5.95%
On the 1-hour ONDO/USDT chart, a clearly pronounced bearish trend dominates, and the price has set a new local low. The current market value is 0.3233 USDT.
Below is a technical analysis for Gate Square in Ukrainian:
📊 Current situation and indicators
Trend indicator on the chart: The dynamic moving average is consistently colored red. The price is moving below it, confirming a sustained downtrend. Short-term attempts by bulls to break upward through the line (August 13–14) ended with a downward bounce.
Basement oscillator: The signal lines crossed in the negative zone and are pointing downwa
ONDO-0.73%
On the 1-hour LDO/USDT chart, bears have taken the initiative after an unsuccessful attempt to establish a foothold above a key psychological level. The asset’s current price is 0.2956 USDT.
Below is a structured technical analysis in Ukrainian, optimized for publication on Gate Square.
📊 Current Situation and Indicators
Trend indicator (two-color moving average): The dynamic line has changed its color from green (bullish momentum) to red (bearish momentum). The price broke below the moving average from above and is currently trading beneath it, confirming sellers’ advantage in the short term
LDO+0.12%
📊 Technical Analysis: BTC/USDT (2h) — Prolonged Consolidation and Test of Local Support
On the 2-hour chart of the BTC/USDT perpetual contract on Gate, the leading cryptocurrency continues to move within a broad range, showing local weakness after an unsuccessful attempt to break through the upper boundaries.
🔍 Key observations: Downward momentum within the range: After forming a local high around $66,932, the price has been declining steadily. Bitcoin is currently trading in the lower part of the current trading range.
Current price: BTC is valued at $63,400.6. Buyers are attempting to hold
BTC+0.80%
📊 Technical Analysis: ETH/USDT (2h) — Key Trendline Test and Battle for Initiative
On the 2-hour chart of the ETH/USDT perpetual contract on Gate, the price has approached a critically important ascending support line that determines the asset’s medium-term movement.
🔍 Key observations:Trendline test: Ethereum has been moving along the global ascending trendline (blue line) for an extended period. The price is currently pressed directly against it, making the current zone decisive for the next direction.Current price: Ether is trading at $1885.08. The local high of this large range was recor
ETH+0.43%
📊 Technical analysis: BLESS/USDT (2h) — Trend Break and Search for Support
The 2-hour chart of the BLESS/USDT perpetual contract on Gate shows a sharp shift in market sentiment following an aggressive surge in early August.
🔍 Key observations:Downside channel breakout: The price failed to stay within the steep ascending parallel channel (blue lines) and broke through its lower boundary. This signals the end of the initial bullish impulse.Current price: The asset is trading at $0.010070. The local structural high was recorded at $0.030330, after which a deep correction began.Moving averages:
BLESS-1.14%
📊 Technical analysis: DOS/USDT (30m) — Downtrend and bottom search
The 30-minute chart of the DOS/USDT perpetual contract on the Gate exchange shows a clear bearish structure, but the price is beginning to form a potential consolidation zone.
🔍 Key observations:Downtrend line: The price has been moving below the local resistance trendline (blue line) for an extended period. Every attempt to rise above it is currently being blocked by sellers.
Current price: The token is trading near the local low at $0.2757. The historical local low for this segment was recorded at $0.2683.Moving averages: T
DOS+1.31%
📊 Technical Analysis: PUMPFUN/USDT (2h) — Channel Breakout and Bullish Momentum
The 2-hour chart of the PUMPFUN/USDT perpetual contract shows a clear bullish structure and strong upward movement.
🔍 Key observations:Channel breakout: The price confidently broke upward beyond the main ascending parallel channel (blue lines). This indicates a significant dominance of buyers and an acceleration of the trend.Current price: The token is trading around $0.002861, having recorded a local high at $0.002944.Moving averages: The indicator on the chart is highlighted in green, confirming a steady uptren