
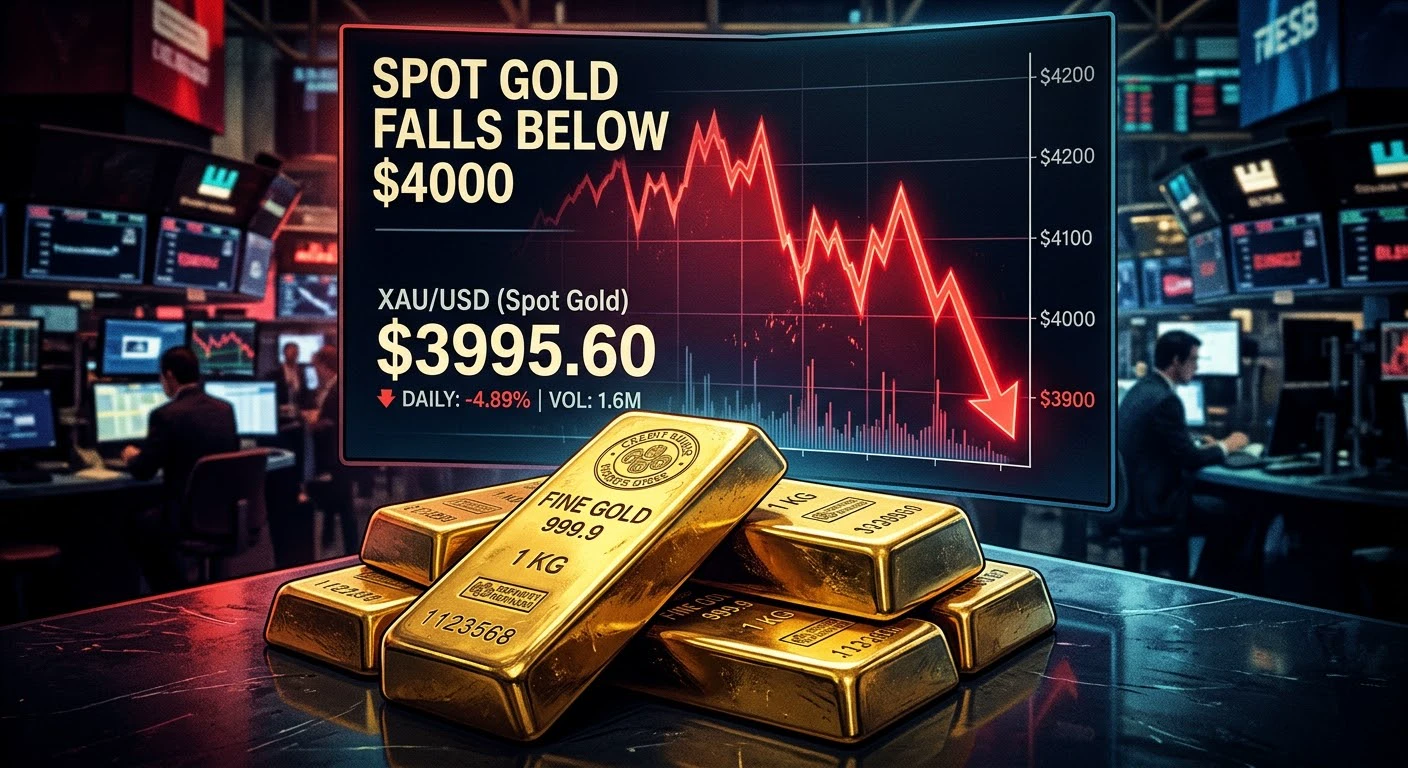
#SpotGoldFallsBelow$4000
Gold Breaks a Major Psychological Level as Market Pressure Intensifies
Gold’s Safe-Haven Status Faces a New Test: Is This a Temporary Correction or the Beginning of a Deeper Downtrend?
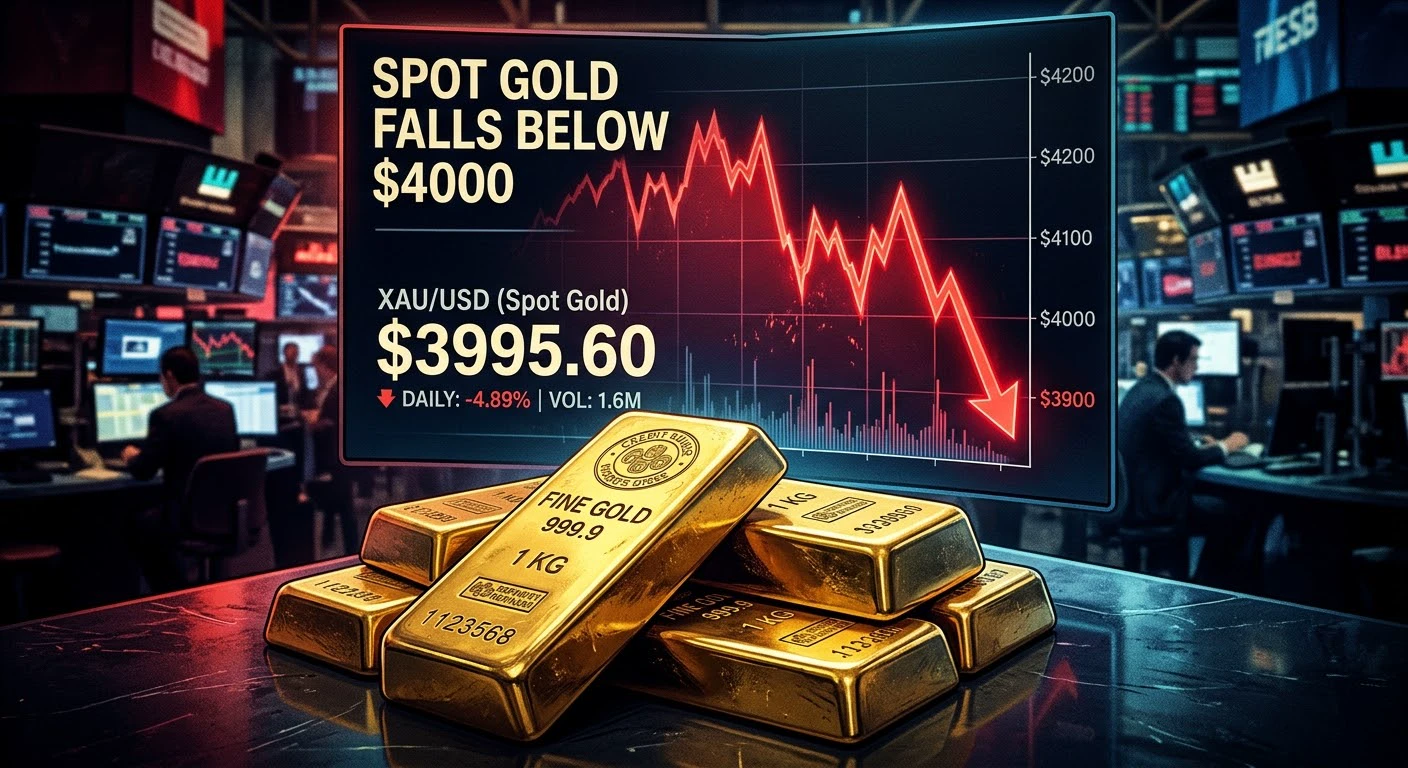
The global gold market has entered a critical phase after spot gold fell below the psychologically important $4,000-per-ounce level on October 23, 2026. The decline marks a significant shift in short-term market sentiment, as rising oil prices, inflation concerns, changing Federal Reserve expectations, and selling pressure across technology stocks weigh on precious metals.
According to recent market reports, spot gold traded around $3,996 per troy ounce, while the metal recorded a weekly decline of approximately 4%, its steepest weekly loss since June. Gold also reached its lowest level since July, highlighting the strength of the current correction.
Why Is Gold Falling Below $4,000?
One of the main reasons is the renewed rise in global energy prices. Higher oil prices can increase transportation, manufacturing, and consumer costs, raising concerns that inflation may remain elevated for longer.
This creates a challenge for gold. If inflation pressures encourage central banks to maintain restrictive monetary policies or consider additional rate increases, interest-bearing assets may become more attractive relative to gold, which does not generate interest income.
The Federal Reserve's upcoming policy decision on October 27–28 is therefore an important event for precious metals traders. Investors will also be watching the October 29 Personal Consumption Expenditures inflation report for further clues about the direction of US monetary policy.
The Technology Sell-Off Adds More Pressure
Another important factor is the recent weakness in technology and artificial intelligence-related stocks. When equity markets experience sharp losses, some investors sell profitable positions in other assets to raise cash or meet margin requirements.
Gold can consequently decline even during periods of market uncertainty. Although it is traditionally considered a safe-haven asset, its price can be affected by liquidity needs, leveraged positions, currency movements, and bond yields.
This is an important reminder that gold does not always rise when stock markets fall. Short-term investor behavior can sometimes outweigh its traditional defensive appeal.
Current Gold Price and Market Snapshot
Based on the latest reported market data available for October 23–24:
Spot gold: Approximately $3,996 per troy ounce.
Key psychological level: $4,000 per ounce.
Weekly performance: Approximately 4% lower.
Recent trend: Bearish, with substantial selling pressure.
Primary market drivers: Oil prices, inflation expectations, Treasury yields, Federal Reserve policy, and equity-market liquidations.
These figures reflect recent reported prices, not a guaranteed live quote. Spot prices can change rapidly when markets reopen.
What Happens Next? Gold Price Outlook
The $4,000 level has become a crucial area to watch. If gold remains below this threshold and sellers maintain control, the market could test the $3,950–$3,960 region. A sustained move below that area could expose further downside, although no support level is guaranteed to hold.
On the other hand, if buyers regain control and gold climbs back above $4,000, the market could attempt a recovery toward $4,050 and $4,100. A stronger rebound would require sustained buying interest and a more supportive outlook for interest rates, the US dollar, and bond yields.
These are conditional technical scenarios rather than certain price predictions. Traders should wait for price confirmation instead of assuming that a decline automatically creates a buying opportunity.
My Final Market View
Gold breaking below $4,000 is more than a symbolic event. It demonstrates how quickly monetary-policy expectations and liquidity pressures can change the direction of a major global asset.
The longer-term outlook will depend on inflation, real interest rates, central-bank demand, geopolitical developments, and investor appetite for protection against economic uncertainty.
For now, caution is justified. Bulls need to demonstrate that buyers can reclaim important price levels, while bears must establish whether the breakdown can be sustained.
The key question is no longer simply whether gold can recover $4,000, but whether it can hold that level after reclaiming it.
What is your outlook for gold: a temporary correction before another rally, or the start of a deeper bearish phase?
#SpotGoldFallsBelow$4000 #GoldPrice
Gold Breaks a Major Psychological Level as Market Pressure Intensifies
Gold’s Safe-Haven Status Faces a New Test: Is This a Temporary Correction or the Beginning of a Deeper Downtrend?
The global gold market has entered a critical phase after spot gold fell below the psychologically important $4,000-per-ounce level on October 23, 2026. The decline marks a significant shift in short-term market sentiment, as rising oil prices, inflation concerns, changing Federal Reserve expectations, and selling pressure across technology stocks weigh on precious metals.
According to recent market reports, spot gold traded around $3,996 per troy ounce, while the metal recorded a weekly decline of approximately 4%, its steepest weekly loss since June. Gold also reached its lowest level since July, highlighting the strength of the current correction.
Why Is Gold Falling Below $4,000?
One of the main reasons is the renewed rise in global energy prices. Higher oil prices can increase transportation, manufacturing, and consumer costs, raising concerns that inflation may remain elevated for longer.
This creates a challenge for gold. If inflation pressures encourage central banks to maintain restrictive monetary policies or consider additional rate increases, interest-bearing assets may become more attractive relative to gold, which does not generate interest income.
The Federal Reserve's upcoming policy decision on October 27–28 is therefore an important event for precious metals traders. Investors will also be watching the October 29 Personal Consumption Expenditures inflation report for further clues about the direction of US monetary policy.
The Technology Sell-Off Adds More Pressure
Another important factor is the recent weakness in technology and artificial intelligence-related stocks. When equity markets experience sharp losses, some investors sell profitable positions in other assets to raise cash or meet margin requirements.
Gold can consequently decline even during periods of market uncertainty. Although it is traditionally considered a safe-haven asset, its price can be affected by liquidity needs, leveraged positions, currency movements, and bond yields.
This is an important reminder that gold does not always rise when stock markets fall. Short-term investor behavior can sometimes outweigh its traditional defensive appeal.
Current Gold Price and Market Snapshot
Based on the latest reported market data available for October 23–24:
Spot gold: Approximately $3,996 per troy ounce.
Key psychological level: $4,000 per ounce.
Weekly performance: Approximately 4% lower.
Recent trend: Bearish, with substantial selling pressure.
Primary market drivers: Oil prices, inflation expectations, Treasury yields, Federal Reserve policy, and equity-market liquidations.
These figures reflect recent reported prices, not a guaranteed live quote. Spot prices can change rapidly when markets reopen.
What Happens Next? Gold Price Outlook
The $4,000 level has become a crucial area to watch. If gold remains below this threshold and sellers maintain control, the market could test the $3,950–$3,960 region. A sustained move below that area could expose further downside, although no support level is guaranteed to hold.
On the other hand, if buyers regain control and gold climbs back above $4,000, the market could attempt a recovery toward $4,050 and $4,100. A stronger rebound would require sustained buying interest and a more supportive outlook for interest rates, the US dollar, and bond yields.
These are conditional technical scenarios rather than certain price predictions. Traders should wait for price confirmation instead of assuming that a decline automatically creates a buying opportunity.
My Final Market View
Gold breaking below $4,000 is more than a symbolic event. It demonstrates how quickly monetary-policy expectations and liquidity pressures can change the direction of a major global asset.
The longer-term outlook will depend on inflation, real interest rates, central-bank demand, geopolitical developments, and investor appetite for protection against economic uncertainty.
For now, caution is justified. Bulls need to demonstrate that buyers can reclaim important price levels, while bears must establish whether the breakdown can be sustained.
The key question is no longer simply whether gold can recover $4,000, but whether it can hold that level after reclaiming it.
What is your outlook for gold: a temporary correction before another rally, or the start of a deeper bearish phase?
#SpotGoldFallsBelow$4000 #GoldPrice