Share your thoughts
placeholder
Article
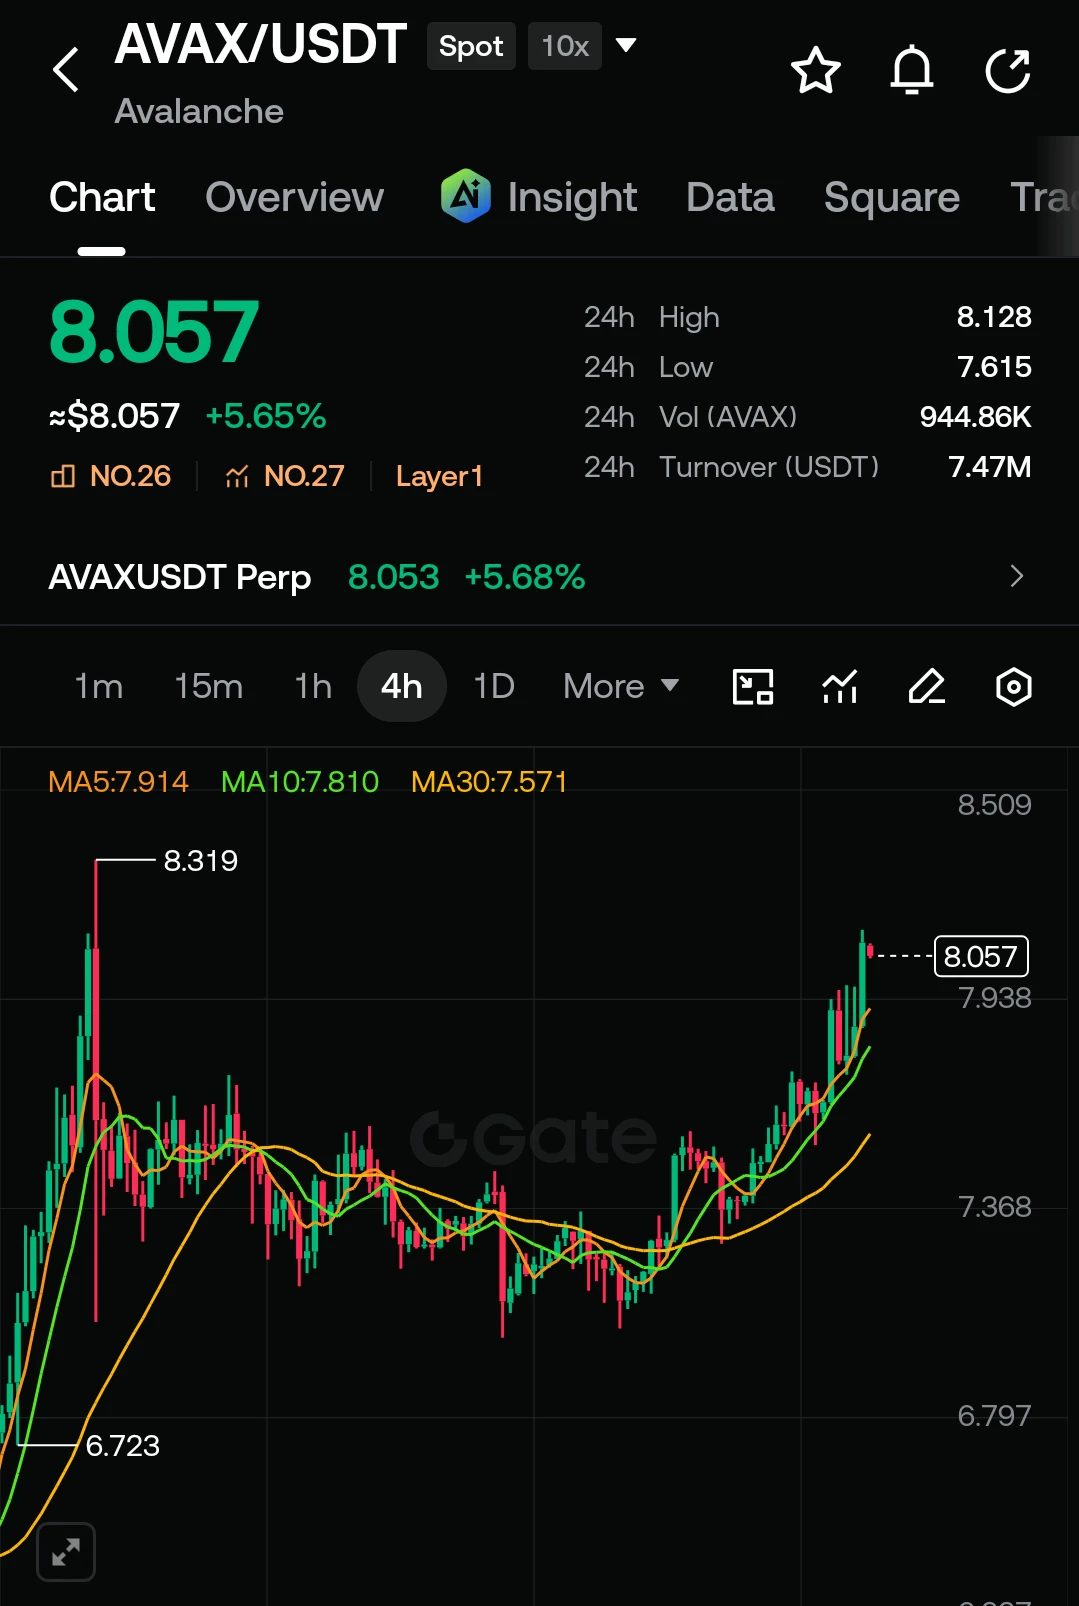
🚨 VIP SIGNAL: $AVAX /USDT (SPOT & FUTURES) 🚨
Pair: $AVAX /USDT
Direction: LONG 🟢
Trade Details:
Entry Zone: 7.950 - 8.080
Leverage: 5x - 10x
Targets:
🎯 Target 1: 8.300
🎯 Target 2: 8.650
🎯 Target 3: 9.000
🎯 Target 4: 9.500
Stop Loss:
❌ 7.550
$AVAX ‌#GateIdleEarnAutoYieldUpTo3%
post-image
AVAX+4.41%
  • 9
  • 2
Everyone is missing the real move happening under the radar.

$XAG /USDT - SHORT

Trade Plan:
Entry: 66.28 – 66.40
SL: 66.93
TP1: 65.90
TP2: 65.61
TP3: 65.17

Why this setup?
Why now? The daily trend is range-bound, which often precedes a sharp directional break, and the 1h price is sitting at 66.35 with a 15m RSI of 57.18, showing neither overbought nor oversold exhaustion. The 1h ATR of 0.244384 means this asset is quietly building energy for a volatile expansion that most range traders will underestimate. With the entry zone between 66.28 and 66.40, a short bias targets TP1 at 65.90 and
XAG+0.21%
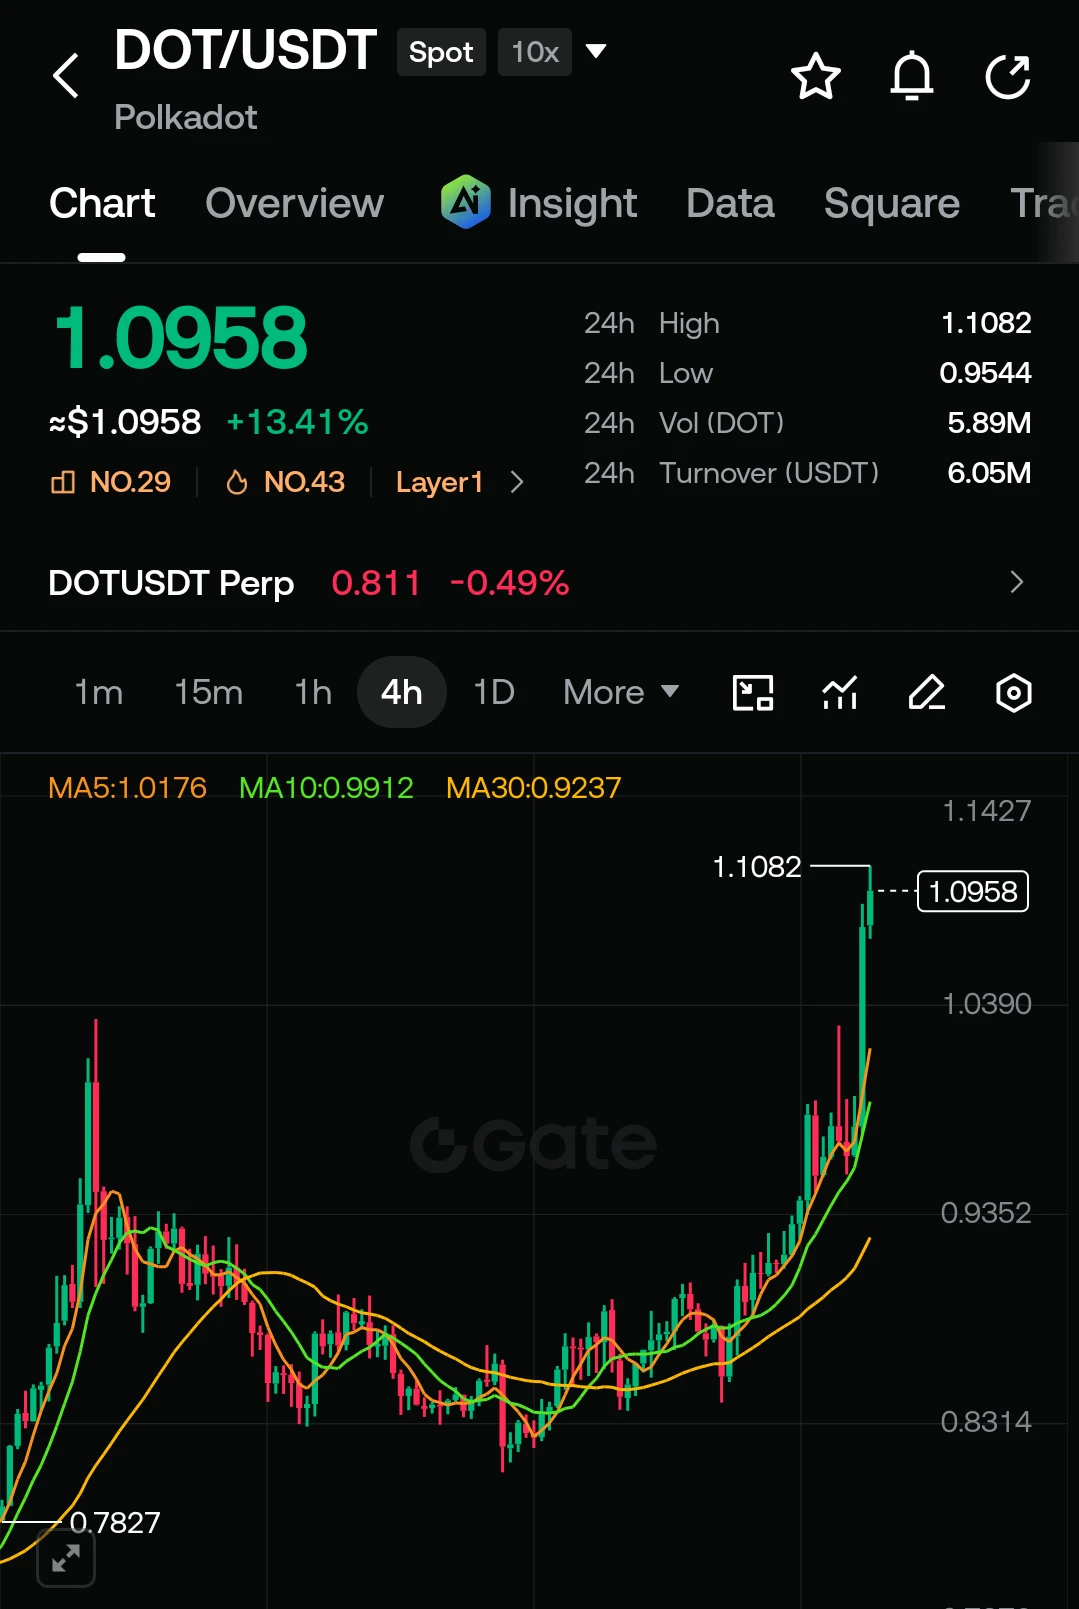
🚨 VIP SIGNAL: $DOT /USDT (SPOT & FUTURES) 🚨
Pair: $DOT /USDT
Direction: LONG 🟢
Trade Details:
Entry Zone: 1.0800 - 1.1000
Leverage: 5x - 10x
Targets:
🎯 Target 1: 1.1350
🎯 Target 2: 1.1800
🎯 Target 3: 1.2400
🎯 Target 4: 1.3000
Stop Loss:
❌ 1.0100
$DOT ‌#GateLaunchesTrenchesWith0GasFee
post-image
DOT+10.19%
  • 9
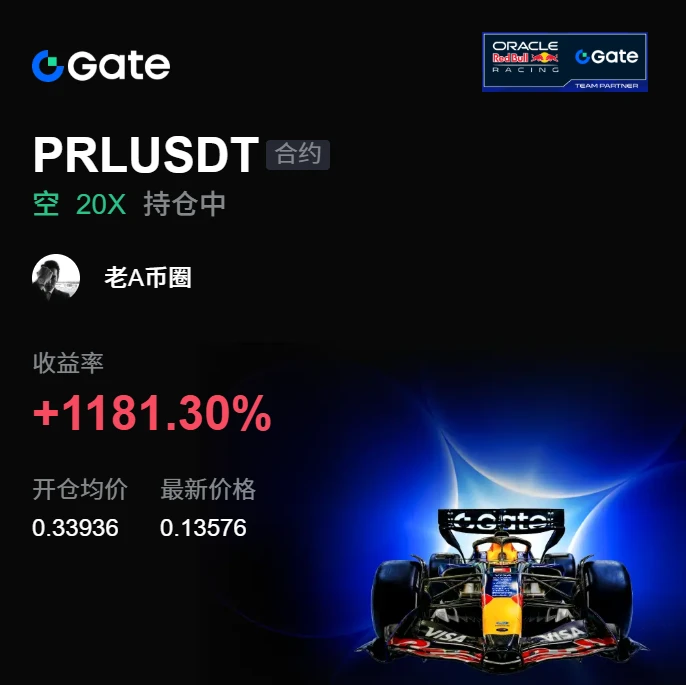
I went to the restroom for a moment, and when I came back, the candlestick chart had already completed the drop I was waiting for.
While everyone was still watching from the sidelines, $PRL made several pushes at the highs, but there was no volume. As planned, I placed a short order at 0.33936. I just refreshed the page, and the current price has already fallen to 0.13569, with the account showing +1181.3% unrealized profit. This trade feels great.
Here’s the position update: close 80% first, and move the remaining 20% to breakeven protection. If it keeps falling, let the profits run; if it r
post-image
PRL+5.62%
XRP-1.74%
LAB-2.08%
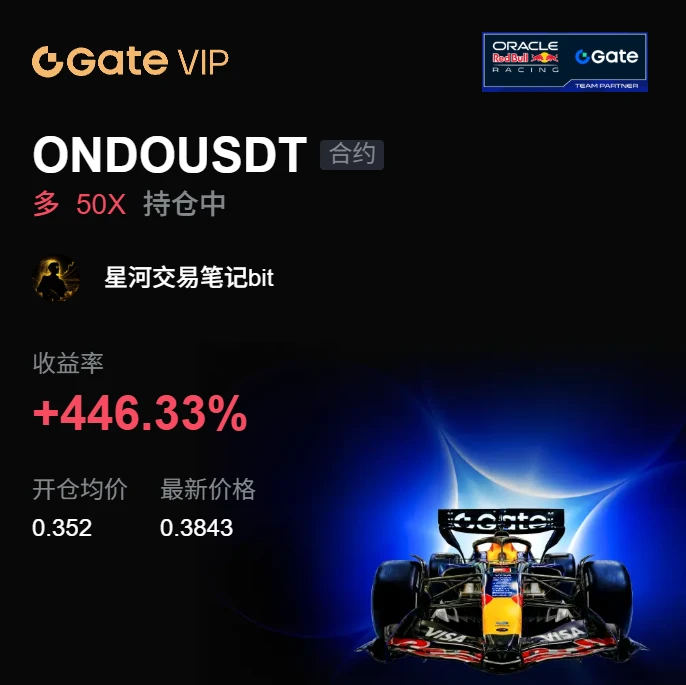
After $ONDO rallied, I didn't exit the entire position. I first took profit on 80% and moved the protection level for the remaining position above breakeven. The quick pullback just now swept out the remaining position, successfully locking in the profit.

The reason for entering was simple: after pulling back to the previous high on the hourly chart, it did not continue lower but instead reclaimed the area above the moving average with increased volume. This was a typical pullback confirmation. After going long, I kept the stop-loss below the lower boundary of the small range.

After the pu
post-image
ONDO+0.21%
LAB-2.08%
ZEC-5.58%
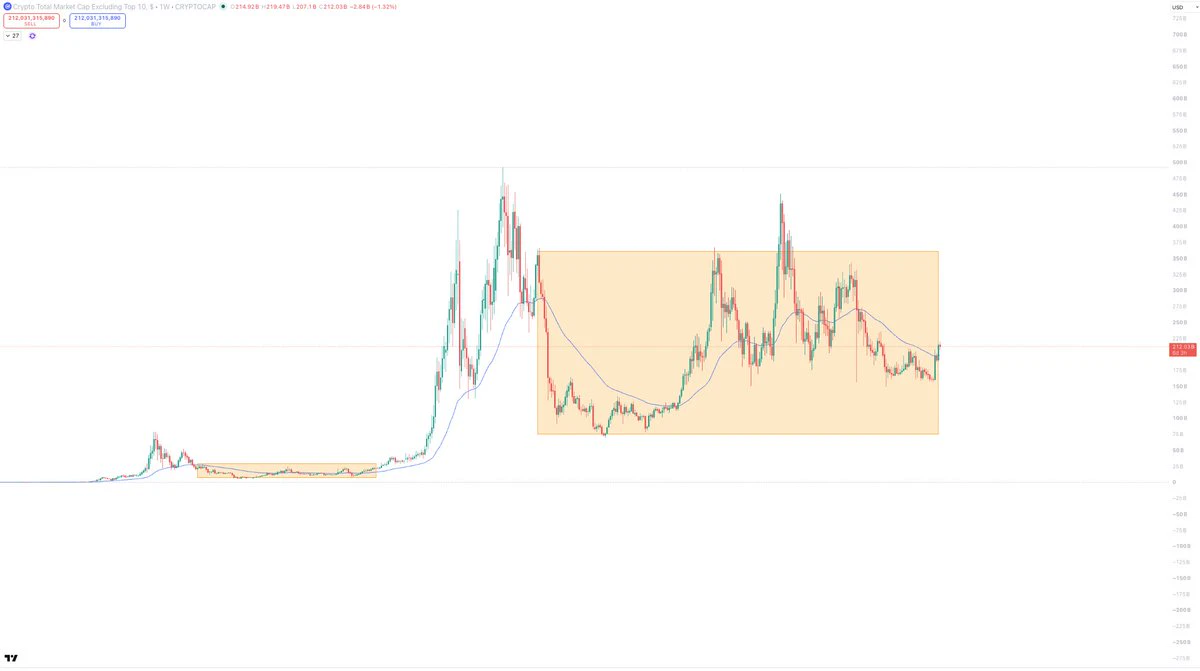
This is how bullish alts are.
End of mid cycle correction.
Hope you understand.
post-image
$SPCX /USDT is range-bound on the daily trend but the 1h ATR whispers a short is forming.

$SPCX /USDT - SHORT

Trade Plan:
Entry: 150.04 – 150.28
SL: 151.35
TP1: 149.27
TP2: 148.67
TP3: 147.78

Why this setup?
Why now? The daily trend is range, which means the 1h price of 150.16 sits at a natural magnet for mean reversion. The 15m RSI reading of 48.86 confirms the short-term momentum is neither oversold nor overbought, allowing a clean entry within the 150.04 to 150.28 zone. The 1h ATR of 0.496517 quantifies the volatility contraction before a potential snap-back toward TP1 at 149.27. If t
SPCX-0.49%
Nobody is talking about $USELESS /USDT while the 1h RSI sits at 50.17 and the daily trend screams bullish.

$USELESS /USDT - LONG

Trade Plan:
Entry: 0.22217 – 0.22877
SL: 0.19378
TP1: 0.24924
TP2: 0.26509
TP3: 0.28886

Why this setup?
Why now? The 1h price of 0.22547 aligns with the entry zone, and the 15m RSI at 50.17 shows momentum balanced enough for a clean push. The daily trend is bullish, which means the 1h ATR of 0.013206 is setting up a measured move toward TP1 at 0.24924. If that breaks, the structure targets TP2 at 0.26509, and a continuation would aim for TP3 at 0.28886. The inv
USELESS+3.19%
$ESPORTS /USDT is about to punish longs, and the setup is undeniable.

$ESPORTS /USDT - SHORT

Trade Plan:
Entry: 0.01442 – 0.01450
SL: 0.01482
TP1: 0.01419
TP2: 0.01401
TP3: 0.01374

Why this setup?
Why now? The daily trend is bearish and the 4h signal is armed at 95% confidence, creating a perfect storm for a short. The 1h price is sitting at 0.01446, which is the exact entry_ref for the trade. The 15m RSI at 41.88 shows the asset is weakening but not yet oversold, meaning the move down has room to run. The 1h ATR of 0.000149 indicates enough volatility to push the price from the entry zo
ESPORTS-0.55%
privacy gud
cat in the bag
post-image
Crypto Market and Trading Insights
live-cover
LIVE1,152
BTC, Gold, and Crude Oil Analysis
live-cover
LIVE2,586
#Solana: $105 Is the Key Level
$SOL ’s momentum is improving, but the weekly trend still needs confirmation.
• $105 = major resistance — Fibonacci, trendline and moving averages converge here.
• RSI bullish divergence suggests selling momentum weakened into the June low.
• Death cross remains active, keeping the broader trend under pressure.
• Stablecoin supply is around $16.4B, but DEX and perps volumes are declining — liquidity is rising, yet active demand remains unconfirmed.
Weekly close above $105 + successful retest → stronger recovery structure.
Rejection below $105 → broader downtrend
post-image
SOL-1.91%
$SOPH I lost 110k U last week because I chased the AI narrative without setting a stop-loss. I’ve recovered now because I’ve learned to let the data speak. SOPH is currently at 0.0052, up 25% in 24 hours, with a high of 0.0055 and a trading volume of 78 million U. This kind of volume can’t be generated by retail traders alone.
Key point: It has already risen 30% from 0.0041, but without massive volume, which indicates that the chips are still in the hands of the main players. My plan: don’t chase at the current price; buy on a pullback to 0.0048–0.0050, set a stop-loss at 0.0045, and target 0.
SOPH+33.76%
WLD+13.33%
Nobody is talking about the SYMBOL setup hiding in plain sight right now.

$CL /USDT - SHORT

Trade Plan:
Entry: 92.22 – 92.44
SL: 93.39
TP1: 91.53
TP2: 91.00
TP3: 90.20

Why this setup?
Why now? The 1h price sits at 92.33 inside a tight entry zone between 92.22 and 92.44, and the daily trend is range-bound, which means a directional breakout is overdue. The 15m RSI reading of 48.15 shows neither overbought nor oversold, leaving room for a sharp move lower. With the 1h ATR at 0.44283, the average candle size tells us the next leg down could easily sweep past the first target at 91.53 and re
CL+0.49%
Smart money is quietly loading $LINK /USDT while everyone else looks away.

$LINK /USDT - LONG

Trade Plan:
Entry: 12.734 – 12.838
SL: 12.284
TP1: 13.163
TP2: 13.414
TP3: 13.790

Why this setup?
Why now? The daily trend is bullish and the 1h price sits at 12.788, giving us a clean setup. The 15m RSI at 41.36 shows room for upside before overbought territory. The 1h ATR of 0.209242 tells us volatility is enough to reach our targets without whipsaws. Entry is anchored at 12.786 with a zone between 12.734 and 12.838, TP1 at 13.163 and TP2 at 13.414, while the invalidation level at 11.785 is th
LINK-2.35%
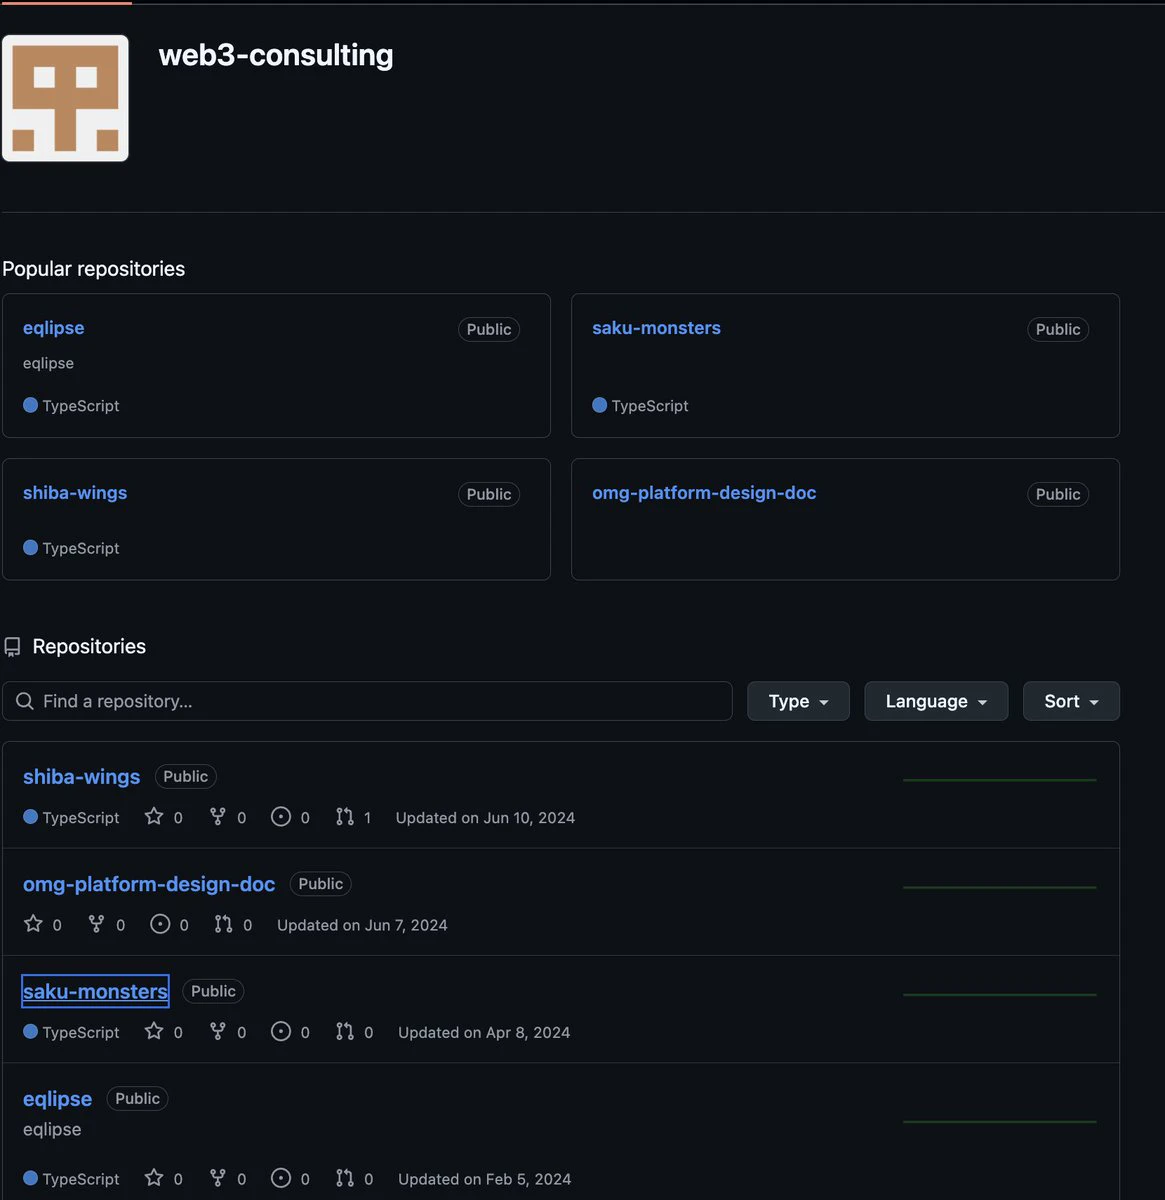
i was curious and looked at the audit (lol) for laptop coin
you will all be happy to know it is made by a web3 consulting company that most recently made "shiba-wings"
like bruh why even hire these people
post-image
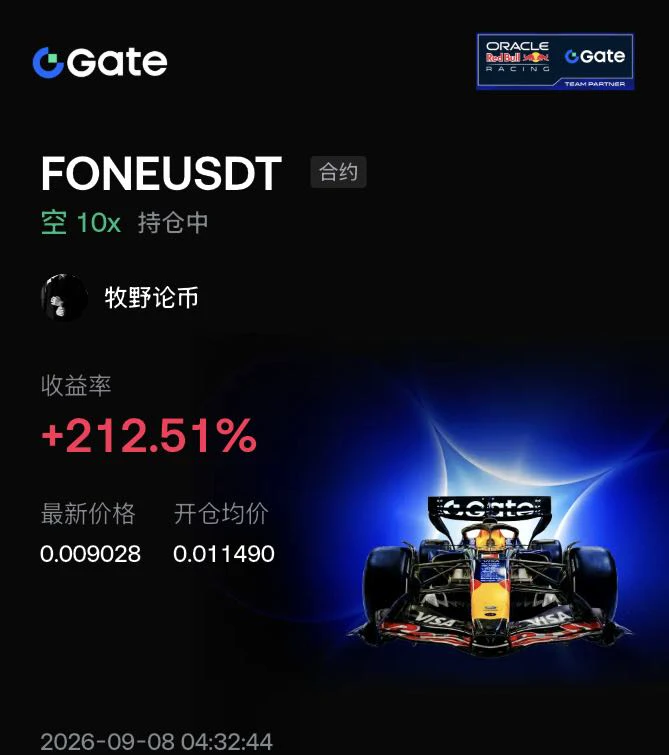
$FONE The fully circulating supply is approximately 990 million tokens, and the launch cost on Pump.fun was extremely low. After Gate launched perpetual contracts, the early holdings locked on-chain found the optimal channel for monetization.
I opened a 10x short at 0.011490. The logic is simple: when market makers find a liquidity exit, the price will inevitably return toward the cost basis of the holdings. The mark price is 0.009028, with an unrealized profit of +212.51%.
Going forward, monitor the correlation between Gate contract open interest and on-chain transfers. If open interest decli
post-image
FONE-16.86%
ETH-0.60%
BTC-0.86%
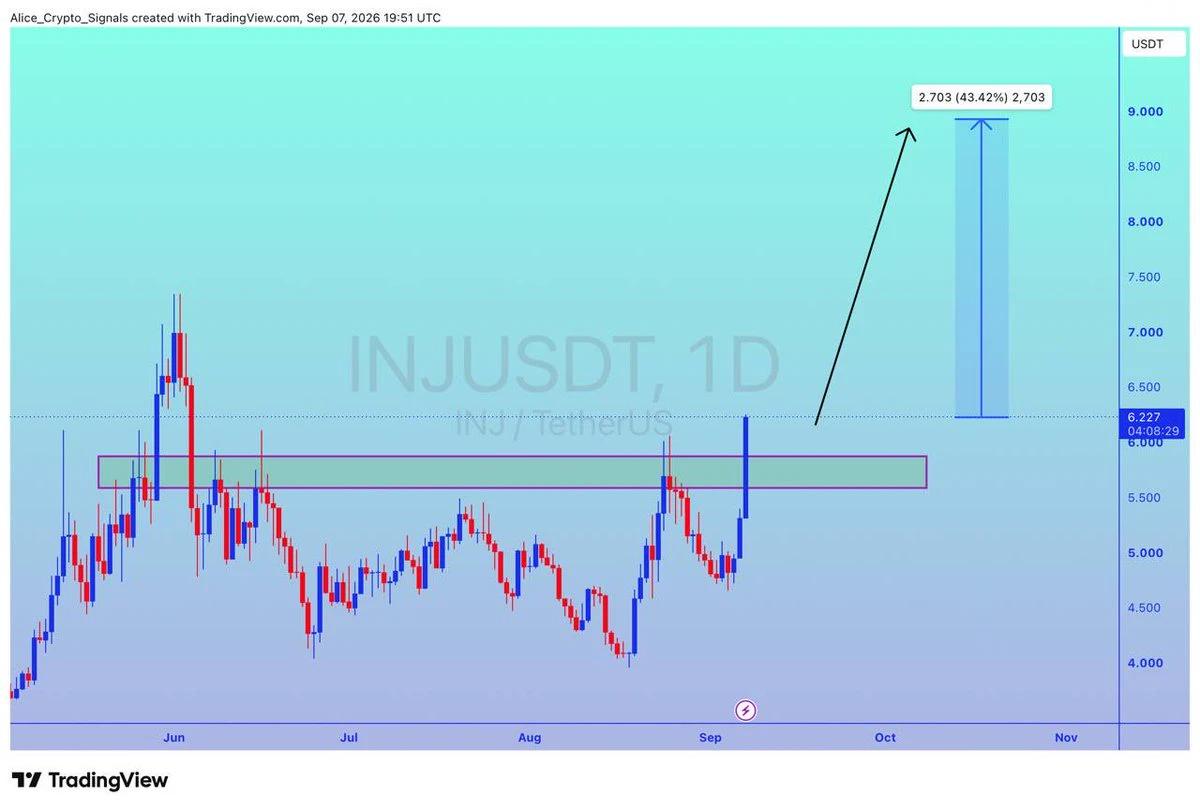
#INJ
UPDATE
#INJ breakout done. In this move we can see 40%+ gain here ✍🏻
#INJUSDT #INJBTC #BTC #Bitcoin #NFTs
post-image
INJ+17.41%
BTC-0.85%
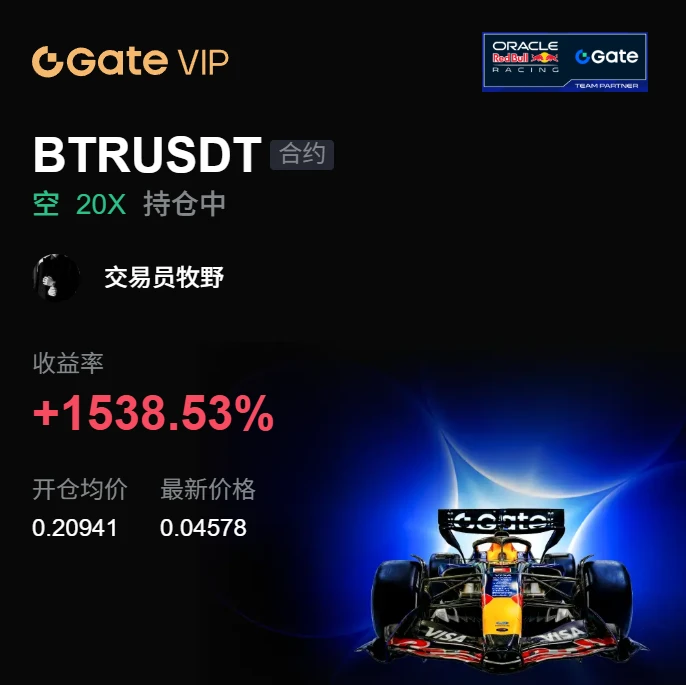
I just switched the app to the background, and it shot straight down—are you playing hide-and-seek with me? ⚡

During the repeated intraday swings, the signal I saw was crystal clear: every surge fell just short, and selling pressure was incredibly heavy. Resistance overhead was obvious; this kind of fake breakout can't fool anyone watching the trading volume.

That 0.20941 short position is now 0.04575, with +1538.53% secured. Nailed the rhythm—feels good, brothers. 📉

Markets are waited out, and profits are held onto. Panic comes from having no plan; losses come from overthinking.

Take
post-image
SNDK+0.35%
DOGE+0.22%
Load More

Join 40 M users in our growing community

⚡️ Join 40 M users in the crypto craze discussion

💬 Engage with your favorite top creators

👍 See what interests you

View More