Share your thoughts
placeholder
Article
$FET Current price 0.1815, 24h -1.95%, trading volume only 17.0M USDT, MA5 at 0.18202 has crossed below MA20 at 0.18205, the MACD histogram at -0.000288 remains bearish, RSI at 51.8 is neutral to weak, and the Bollinger Bands have narrowed to [0.17708, 0.18702], with a 6.94% amplitude over 30 candles. The funding rate remains positive at +0.0100%, indicating that longs are still paying to hold positions, while the Fear & Greed Index at 71 is in the greed zone—low volatility combined with greed and crowded longs creates a structure highly prone to downward wicks. Assessment: Bearish in the sho
post-image
FET-1.73%
BTC+1.06%
ETHFI+1.52%
$XTZ Current price is 0.3751, up 36.95% over 24h, with a trading volume of 16.5M USDT. The price has touched the upper Bollinger Band at 0.375028, while MA5 at 0.34818 has crossed above MA20 at 0.32404, forming a bullish alignment. The MACD histogram at +0.002207 continues to expand. However, RSI is as high as 80.9, entering the overbought zone, while the Fear and Greed Index is at 71, indicating greed. This shows that market sentiment is overheated and the risk of chasing prices is rising. Notably, the funding rate is -0.1898%, meaning shorts are still paying, and the short-squeeze structure
post-image
XTZ+37.50%
BTC+1.06%
SKY-1.01%
PROVE+6.57%
#日股地产电力半导体板块走强 #Gate广场中秋团圆局 Japan’s latest stock-market session looked like a broad Nikkei rally on the surface, but the internal data tells a much more concentrated story. The Nikkei 225 closed at 65,018.95, gaining 882.70 points or 1.38%, after trading between 64,403.85 and 65,436.57. Trading value across the Tokyo Prime market reached approximately ¥10.40 trillion, with about 2.86 billion shares changing hands. The headline was therefore strong, but the distribution underneath it is where the real sector-rotation signal appears.
① Nikkei vs TOPIX — the first warning that this was not a unif
post-image
JPN225+0.96%
USDJPY+0.58%
Rushing in to chase longs after seeing the Fear & Greed Index at 71 is the most common way to lose money in this market cycle. A greed reading does not indicate a top, but it means the margin for error is narrowing—at this point, focus on structure, not sentiment.
$PENDL is currently priced at 2.725, up 1.49% in 24h, with a trading volume of 7.8M USDT. On the moving-average front, MA5=2.7432 has crossed above MA20=2.67205, and the bullish alignment remains intact; the MACD histogram at +0.0006605 remains positive, while RSI=59.2 is in the neutral-to-strong zone and has not yet entered overbou
post-image
TRX-0.38%
Narrative here is as clean and natural as it gets.
$KNOTS - $STONK (50m ath)
$ETAC - $CATE (SUB 200K(!))
Survived initial pvp against a cabal etac early on. Proven community. No bundle. Everyone buying organically.
No forced narrative or vamp meme.
A pure accelerator and direct beneficial project to help push cate, just like knots did for stonk.
Paired with cate.
CATE goes up - etac goes up since its paired to cate. Etac goes up, more buybacks on gate - more flywheel and beneficial for both. Not a vamp. Not a beta. Pure accelerator.
Just as knots was for stonk and helped push it from 130m to
STONK-7.72%
CATE+27.84%
· Xuetuan (This is a desktop AI Agent I made)
It is a cat that lives on your desktop · An AI cat that lives on your desktop
A lightweight desktop companion built with native macOS frameworks (pyobjc + WKWebView): the cat isn't a window floating over your desktop, but is integrated into a full-screen scene video—it sits by the window as the seasons change. It supports 7 languages, voice conversations, LLM integration, desktop tidying, and a “one-tap lie down, yawn, and rest” feature.
A lightweight desktop companion built on native macOS frameworks (pyobjc + WKWebView). The cat isn't a floating
post-image
You own $200k of index funds. You've never touched options before.
A great company drops 15% on a bad quarter. Business is fine, profits still growing, price just got hit.
You tell the market: I'll buy 100 shares at 10% below where it is now in a year.
$4,000 hits your account today in cash flow.
(this is selling a portfolio secured put)
Now.. three things can happen.
1. It recovers. You keep $4,000
2. It sits flat for a year. You keep $4,000
3. It drops to your strike price. You buy a company you wanted at a discount...
All of these outcomes are a win.
Wanna know the best part too?
Your index
post-image
🌈 Gate Live Streaming Inspiration - September 19
Trending Topic Recommendations:
🔹 OpenAI CEO to brief the UN Security Council on AI safety next week
🔹 The US dollar is expected to post its best weekly performance in three months
🔹 Meme coin SCHIFFY's market cap briefly surpassed $8.4 million this morning, hitting a new all-time high
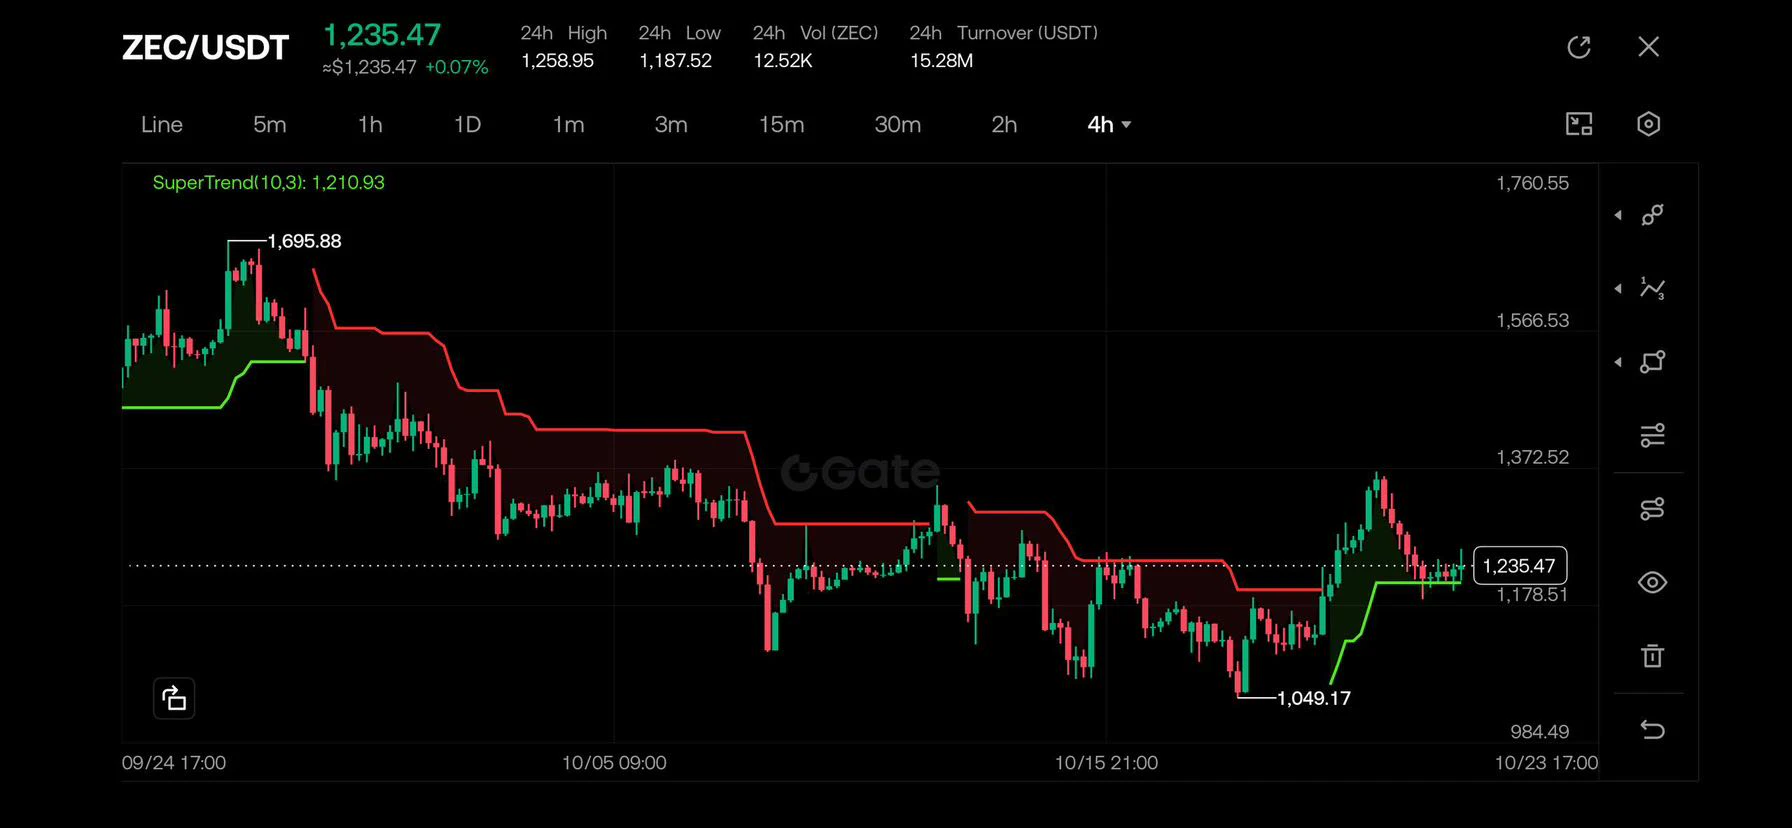
🔹 A whale holding a ZEC short position for nearly half a month was forced to close it, suffering a loss of over $10 million
🔹 Crypto and storage stocks broadly rose at the close of US equities trading; MSTR rose over 16%, while SanDisk gained over 10%
🔹 $53
post-image
MEME+3.52%
ZEC+2.97%
MSTR+16.35%
ETH+2.52%
SanDisk will be added to the S&P 100 on September 21 Musk calls for GDP to double! Is AI hardware hype or real money? Old Musk talks a big game, saying AI can push U.S. GDP from 2% to 4% next year. Do you believe it? Here’s an objective view: The logic isn’t wrong, but the figure needs to be discounted. U.S. real GDP grew just 1.48% in Q2 this year, and the IMF forecasts full-year growth of only 2.4%, so doubling it won’t be easy. But he’s right about the “direction”—Google, Amazon, and Meta together are set to spend more than $500 billion on AI capital expenditures this year, putting real mon
post-image
SNDK+11.05%
AMZN+0.93%
META-2.53%
SOXL+7.60%
KORU-2.15%
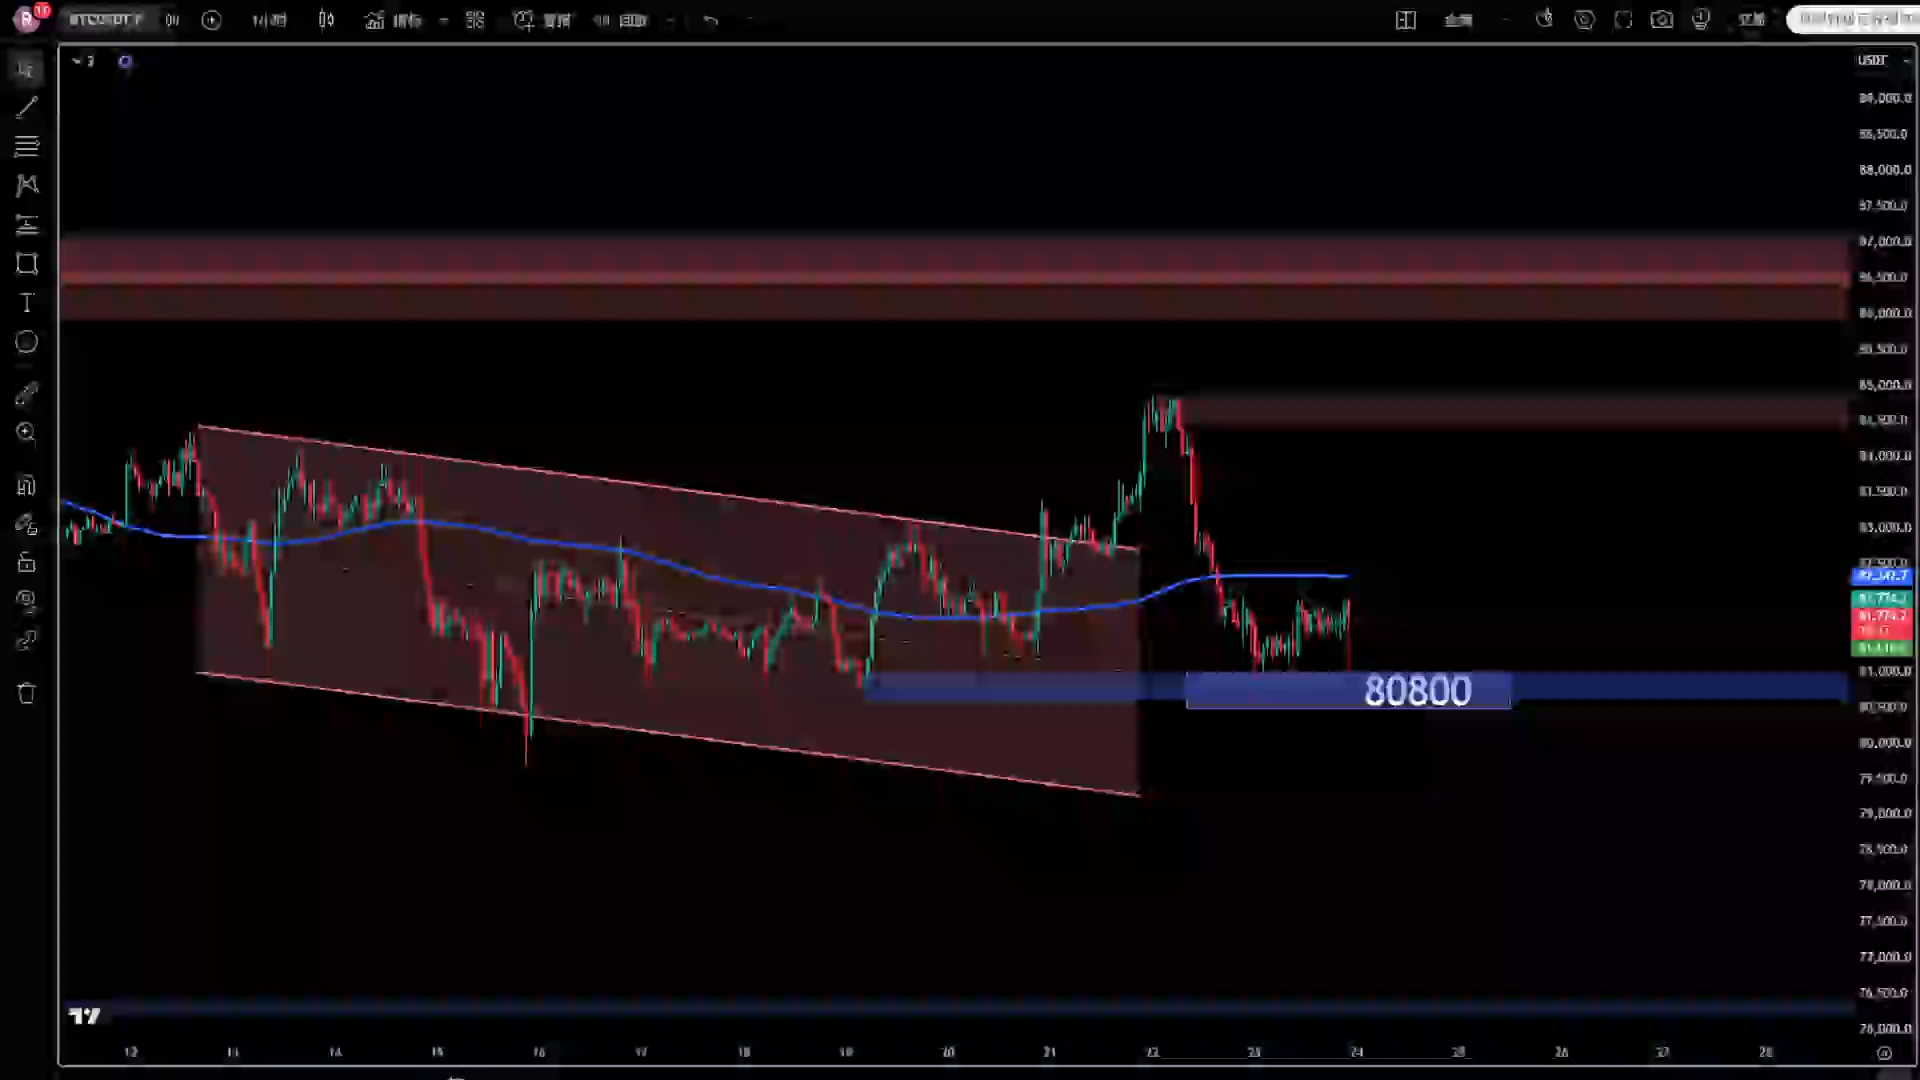
$BTC is starting to break out of its falling wedge.
What caught my attention is that similar structures appeared around the end of the 2013, 2017 and 2021 cycles.
Those breakouts were followed by major moves higher, although the pattern itself doesn’t guarantee the same outcome every time.
Now we’re seeing a similar setup in 2026.
Could this be another cycle turning point?
History doesn’t repeat perfectly, but sometimes the similarities are hard to ignore. 👀
post-image
BTC+1.06%
  • 4
#美股AI概念股全线反弹 + #Gate广场中秋团圆局
AI STOCKS ARE BACK IN FOCUS — BUT IS THIS THE START OF A NEW LEG OR JUST A RELIEF RALLY?
The U.S. technology market has entered another important phase. After a sharp wave of volatility triggered by the Federal Reserve’s latest rate decision and renewed concerns around AI valuations, artificial-intelligence and semiconductor stocks bounced strongly.
On Sep 17, the Nasdaq Composite jumped around 1.7%, while the S&P 500 gained roughly 1.1%. Semiconductor stocks were among the strongest performers, with the Philadelphia Semiconductor Index rising about 3.3%. Nvidia, A
CryptoChampion
#美股AI概念股全线反弹 + #Gate广场中秋团圆局
AI STOCKS ARE BACK IN FOCUS — BUT IS THIS THE START OF A NEW LEG OR JUST A RELIEF RALLY?
The U.S. technology market has entered another important phase. After a sharp wave of volatility triggered by the Federal Reserve’s latest rate decision and renewed concerns around AI valuations, artificial-intelligence and semiconductor stocks bounced strongly.
On Sep 17, the Nasdaq Composite jumped around 1.7%, while the S&P 500 gained roughly 1.1%. Semiconductor stocks were among the strongest performers, with the Philadelphia Semiconductor Index rising about 3.3%. Nvidia, AMD, Micron and other AI-related names helped lead the recovery.
But for me, the most important question is not simply whether AI stocks are rising again.
The bigger question is:
CAN THE FUNDAMENTALS SUPPORT ANOTHER SUSTAINED MOVE?
1. AI Demand Has Not Disappeared
The strongest argument behind the AI market remains real infrastructure demand.
AI development requires enormous amounts of computing power, advanced semiconductors, high-speed networking, memory, data centers and electricity. That creates a much broader investment cycle than simply buying shares of one AI software company.
Recent developments continue to show that companies are committing significant resources to AI infrastructure. Nvidia CEO Jensen Huang has also pointed to continued strong demand for AI computing, while the broader infrastructure ecosystem continues expanding.
This means the AI story is increasingly connected to physical infrastructure rather than only market hype.
2. Interest Rates Are Still the Major Risk
At the same time, investors cannot ignore the macro environment.
The Federal Reserve recently raised its benchmark rate by 25 basis points to 3.75%–4.00%, its first hike in more than three years, while signaling the possibility of another increase this year.
That creates an important challenge for high-growth technology companies.
When Treasury yields remain elevated, the future cash flows of high-valuation companies become more sensitive to discount rates. On September 18, the 10-year Treasury yield moved back toward 5%, showing that financial conditions remain restrictive.
So even when AI fundamentals remain strong, valuations can still experience sharp swings.
3. The Rebound Needs Confirmation
Another important factor is market breadth.
The recent recovery was powerful, but one or two strong sessions do not automatically establish a long-term trend.
For me, the next phase should be watched through several signals:
AI semiconductor leadership
Data-center spending
Corporate AI investment
Treasury yields
Oil prices
Earnings expectations
Market breadth and trading volume
If these factors improve together, the rebound could develop into a broader technology recovery.
If yields rise again while AI spending expectations weaken, the market could return to a more defensive setup.
My Market View
I see the current environment as a battle between AI structural growth and macro valuation pressure.
The AI infrastructure cycle remains one of the most important themes in global markets, but investors are also dealing with higher interest rates, elevated bond yields and volatile energy prices.
That makes confirmation more important than chasing a single green session.
The next move in AI stocks may therefore depend less on headlines and more on whether real corporate spending, earnings growth and infrastructure demand continue validating the enormous expectations already built into the sector.
For Gate Square, this is exactly the type of market environment worth discussing during the Mid-Autumn season: different markets, different narratives, but one common question — what is actually driving the next move?
#GateSquare #weeklyshare #ShareWeekly @Gate_Square
repost-content-media
SPX500+0.45%
INDEX-12.00%
NVDA+1.23%
AMD+2.76%
MU+3.80%
#GateSquareMidAutumnReunion
🎮 $TTWO — Support Ended and Rally?
In my view, Take-Two Interactive ($TTWO) is starting to look interesting after the recent pullback.
If the support areas can hold, I think there is still potential for another rally.
But first, the support needs to prove itself.
🎮 What is $TTWO?
Take-Two Interactive is a major video game company behind Rockstar Games, 2K, and Zynga.
Its major franchises include Grand Theft Auto, NBA 2K, Red Dead Redemption, and various mobile games.
What makes $TTWO interesting is that it doesn't rely on just one gaming segment. It has exposure
TTWO-2.55%
$NEAR is currently in a relative-strength position within the sector, with the smallest decline and the most active trading, but its technicals have not yet turned bullish. It is a watchlist asset awaiting confirmation, rather than one to chase long directly.
Comparatively, $DO is down 2.25% over 24h with only 11.9M in volume, while $NEAR is down 0.86% with 225.6M in volume—a shallower decline with volume nearly 19 times higher, indicating buying support after selling pressure was released; in terms of volatility, $NEAR has a 14.07% range over 30 candles, far higher than $DOT 's 6.48%, giv
post-image
SPYB
SPYBSpy Basket
Pump.Fun
MC:$2.13KHolders:1
0%
DOT-0.26%
[Mid-Autumn] Bulls vs bears at peak intensity! BTC / ETH Market Updates
live-cover
LIVE2,484
#GateMeme狂欢季 #GateMeme
#Gate广场中秋团圆局
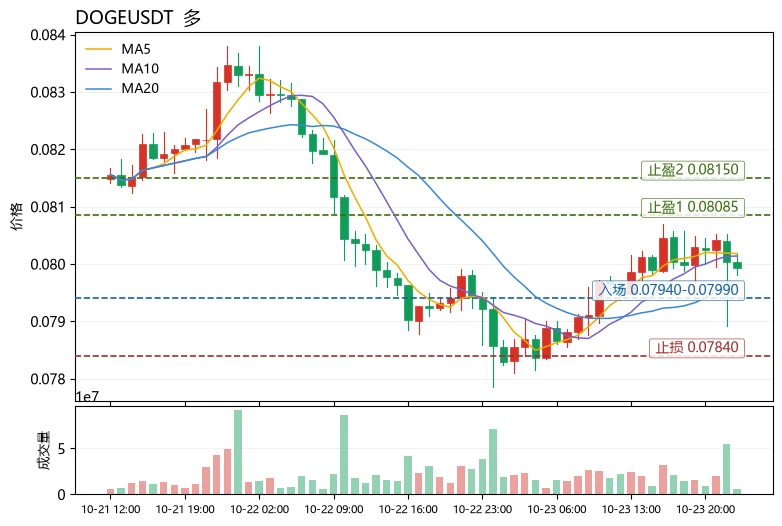
My Dogecoin Short Plan
Over the weekend, BTC surged toward 81k, while Dogecoin followed, rising to 0.088 and gaining 7-8% in 24 hours. But the broader the rally, the more I feel there is a short opportunity here. Here is my logic and plan:
Why am I bearish?
Technically, 0.0895-0.0933 is a convergence zone for multiple resistance levels, and the Bollinger Band upper line at 0.0913 also falls within this range. Once it moves above 0.09, it will face dense resistance. The daily MACD histogram remains negative; the indicator has not kept up with the price ris
post-image
DOGE+1.67%
ETH holding strong above $2,600 with bullish momentum
A break above $2,660 could bring the next move into focus.
post-image
ETH+2.52%
  • 7
“The largest-scale theft of labor in human history.”
It is reported that a Microsoft executive used this phrase to describe OpenAI’s web scraping. Sources say that management at OpenAI and Microsoft had become uneasy about scraping millions of news articles for ChatGPT’s training.
The bill for the training data is being brought to light. Whether the corpus is compliant has shifted from an ethical debate to a legal and commercial risk. It determines whether models can continue to reliably obtain high-quality content, as well as content providers’ pricing power.
Click the group link I gated belo
MSFT-1.09%
One-tweet call on an ETH whale lifting AAVE, with the market only giving back -0.24%
Less than an hour ago, a tweet put $AAVE on the leverage narrative table. At this level, I’m directly bullish on 🔥—as long as 139.5 holds, it’s merely catching its breath during the main uptrend, yet the market surprisingly didn’t follow.
The claim is that RiskFDN ELA resembles an on-chain leverage launch platform on ETH, capable of using AAVE and MORPHO to build leveraged pairs. Unconfirmed, and the market didn’t buy it either: 143.11 to 142.76, down -0.24% in total.
This bullish candle was provided by the
AAVE+3.54%
Live trading - hot crypto coin updates
live-cover
LIVE937
Long $BR
is holding a fairly solid structure, so this setup could be watched for a long on wave 2 if the price continues to hold the support zone below.Entry 1: 1.0230 – 1.0240 (current entry zone, following the price-holding momentum)Entry 2: 0.9720 – 0.9730 (nearby support retest zone)Entry 3: 0.9300 – 0.9310 (deeper support zone, good for adding if there is a shakeout)Take Profit:TP1: 1.0800TP2: 1.2000TP3: 1.3980Stop Loss: 0.8800BR currently has a fairly solid bullish recovery structure after the BOS. If it holds the 0.9720 area, there is a good chance it will continue wave 2 upward to ret
post-image
BR+20.96%
Load More

Join 40 M users in our growing community

⚡️ Join 40 M users in the crypto craze discussion

💬 Engage with your favorite top creators

👍 See what interests you

Trending Topics

JapanRealEstatePowerChipStocksRise

59.52k Views4.39k Discussing

Japan's Nikkei extended gains on Sept 18, with real estate, power, and semiconductor sectors leading. Gate covers over 12,800 global stocks and ETFs, offering one-stop USDT trading across US, HK, Korean, and Japanese markets. [👉 Read more](https://www.odaily.news/en/newsflash/518749)

USAIConceptStocksRally

34.17k Views950 Discussing

GateTopsStockPerpetualCoverage

38.45k Views2.56k Discussing

View More