
Square
Following
Hot
News
Notifications
Profile
Share your thoughts
placeholder
Article
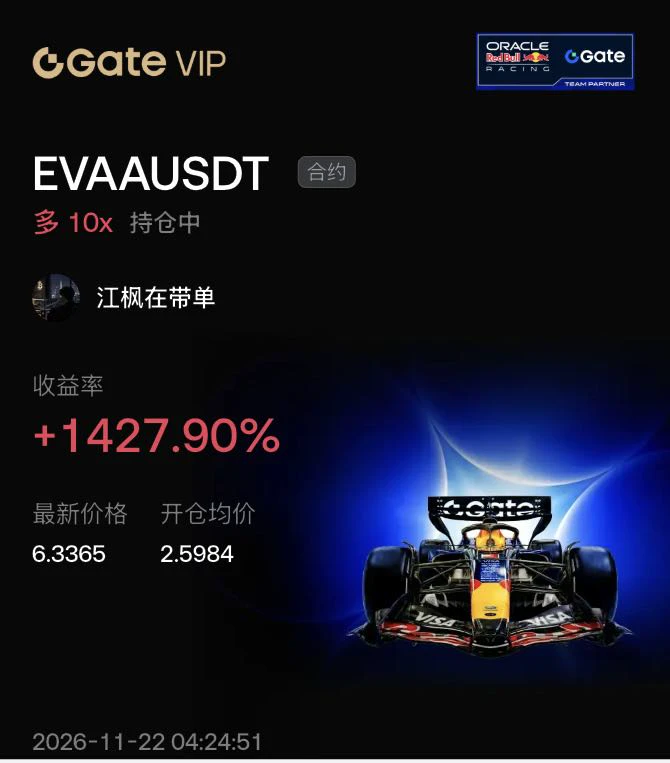
I said a long time ago that $EVAA was going to take off, just like yesterday's $ETH $BTC —a massive pump and dump
post-image
EVAA-0.42%
ETH-1.23%
BTC-0.65%
  • 1
GN if you GN💤
post-image
Trenches
IDOL
I
bade
b
IDOL
0x3b...ab07
Market Cap
$.
Change
.
24h Vol
$.
Holders
.
FIONA
F
bade
b
FIONA
B34n...pump
Market Cap
$.
Change
.
24h Vol
$.
Holders
.
PIEVERSE
P
bade
b
PIEVERSE
0x0e...25a9
Market Cap
$.
Change
.
24h Vol
$.
Holders
.
Singularity
S
bade
b
Singularity
7R4M...pump
Market Cap
$.
Change
.
24h Vol
$.
Holders
.
CLAUDIA
C
bade
b
CLAUDIA
2j5S...W2ZM
Market Cap
$.
Change
.
24h Vol
$.
Holders
.
I haven't even had my coffee yet, and the timeline says Bitcoin is plunging hard $BTC
1. Bitcoin will have spent 11 months above $60,000
2. Ethereum will have spent 11 months above $1,500
3. And some coins are still far from their 2026 low
.. the lows haven't changed ..
And some coins have made a new low, 10% below the previous one
They still haven't had a sharp drop so far
post-image
BTC-0.67%
Only 6 strong signals this round: MMT, AKE, VVV; 4 longs and 2 shorts. Check volume and structure before acting. Last round: 4 wins, 2 losses, +19.2%; SUI and PIEVERSE are in the red. Currently holding 13 positions, averaging +0.7%; waiting for confirmation. 🎯 Last round's returns: SUI entry $0.6185 → exit $0.6440, 5.0x leverage, gained +11.6%; PIEVERSE entry $2.9670 → exit $3.2877, 5.0x leverage, gained +32.6%━━━ Market View ━━━BTC 60,284 +3.0%, bullish signals have a slight edge; negative funding rate data is temporarily unavailable, and capital is still choosing a direction. Don't chase ol
post-image
MMT-3.20%
AKE+6.39%
VVV+0.37%
SUI-1.01%
PIEVERSE+0.50%
After 5 CCs got blocked, even this thing can’t handle it anymore. I don’t dare use a relay either, because the data packets get sold
post-image
Market thoughts for the coming years
post-image
Others get liquidated, I take profits! All five consecutive BTC short positions closed 🔥 Full BTC recap for the week: five straight days of shorts, zero stop-losses, precisely harvesting the move from 65333 to 58720—just follow along and pick up money all the way 💰 Monday (11/16) 🎯 High of 65333.8 landed right in the 65200–65500 range; low of 63871 broke through the first level, extending 129 points below the lower bound. Tuesday (11/17) ✅ High of 65425.5 topped out within the range; low of 63300.9 hit both the first and second levels. Wednesday (11/18) 📉 After peaking at 64934.7, it fell
post-image
BTC-0.65%
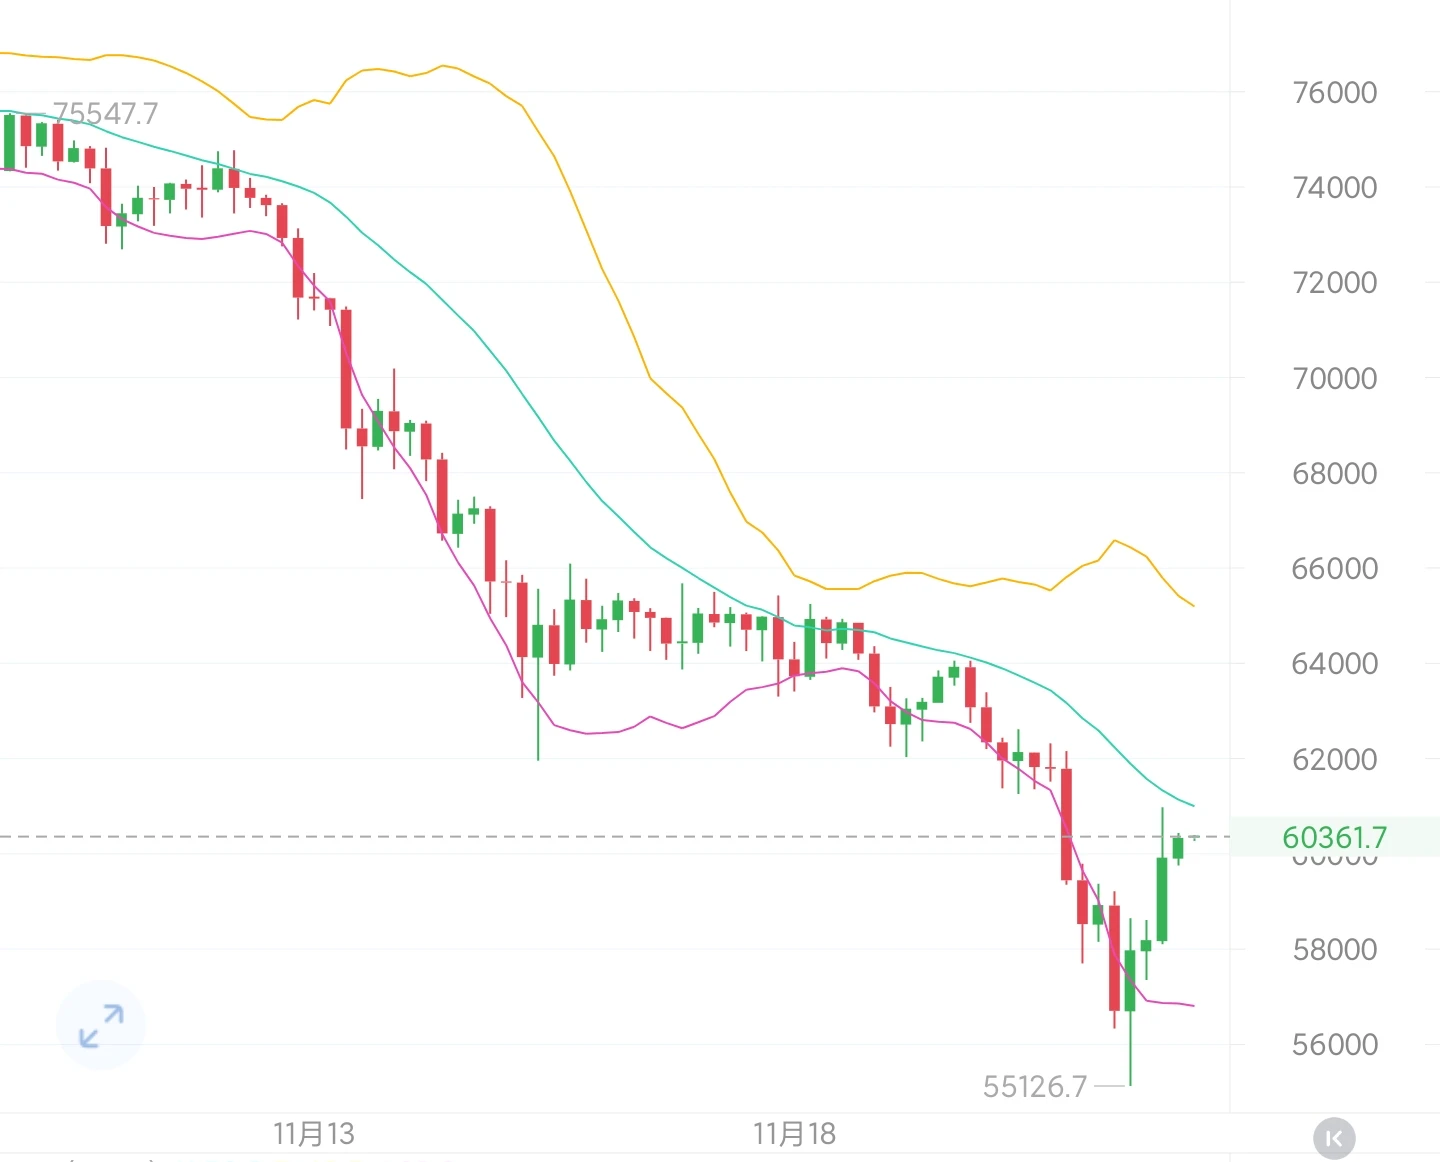
BTC is currently around 60,300, up 1.48% in a modest 24-hour rebound, ending several days of steep declines and bringing a short-term technical recovery. The daily chart remains in a weak, choppy trend, with losses exceeding 6% so far this week; overall, the market is in a bearish correction structure. Selling pressure is evident on the 4-hour chart, with price staying below the 50- and 200-period moving averages for an extended period, indicating a weak medium-term trend.

The short-term chart has completed an oversold rebound, but trading volume has not meaningfully increased, and the reboun
post-image
BTC-0.65%
Watching $BULLA struggle near resistance is almost funny. It really wants to keep pushing higher, but RSI looks like it may need a little nap. Exit quickly with a 42% gain before things get too awkward. Market watch:
$PIEVERSE : Current price 3.3892 - 24-hour change: +21.06%
$SKYAI : Current price 0.03752 - 24-hour change: +33.86%
post-image
BULLA+10.92%
PIEVERSE+0.58%
SKYAI-7.58%
Market Update
live-cover
LIVE1,106
BTC-0.67%
$DOS This 16% bearish candle sent the rebound from 0.1837 straight back to 0.1423. The chart looks like a freshly paved road cracked under the weight of a heavy truck.
Compared with that asset that slowly drifted down last week, let’s compare them point by point. Decline: one was a sharp single-day plunge, with sentiment released all at once; the other leaked lower a little each day, like a slow, dull blade. Volume: $DOS today’s 16.4M was a high-volume decline, showing that some people really sold at this level while others bought; volume in the drifting-down asset contracted, with no one step
DOS+14.98%
  • 1
  • 2
NEAR
live-cover
LIVE1,090
NEAR+1.17%
Don't rush to turn bearish; make sure you have enough ammunition
A falling market isn't necessarily all bad. For those who haven't built positions yet, this crash is essentially a repricing. If U.S. stocks and crypto markets really get brutal enough to wash out 95% of retail investors, quality tech stocks and major crypto assets will still be dragged down by panic and battered into a hole.
So don't rush to call a crash right now, and don't rush to catch a falling knife either. Save cash, work hard to make money, treat cash flow as ammunition, and prepare your watchlist in advance. The key leve
post-image
NAS100-4.60%
SPYX+0.01%
BTC-0.67%
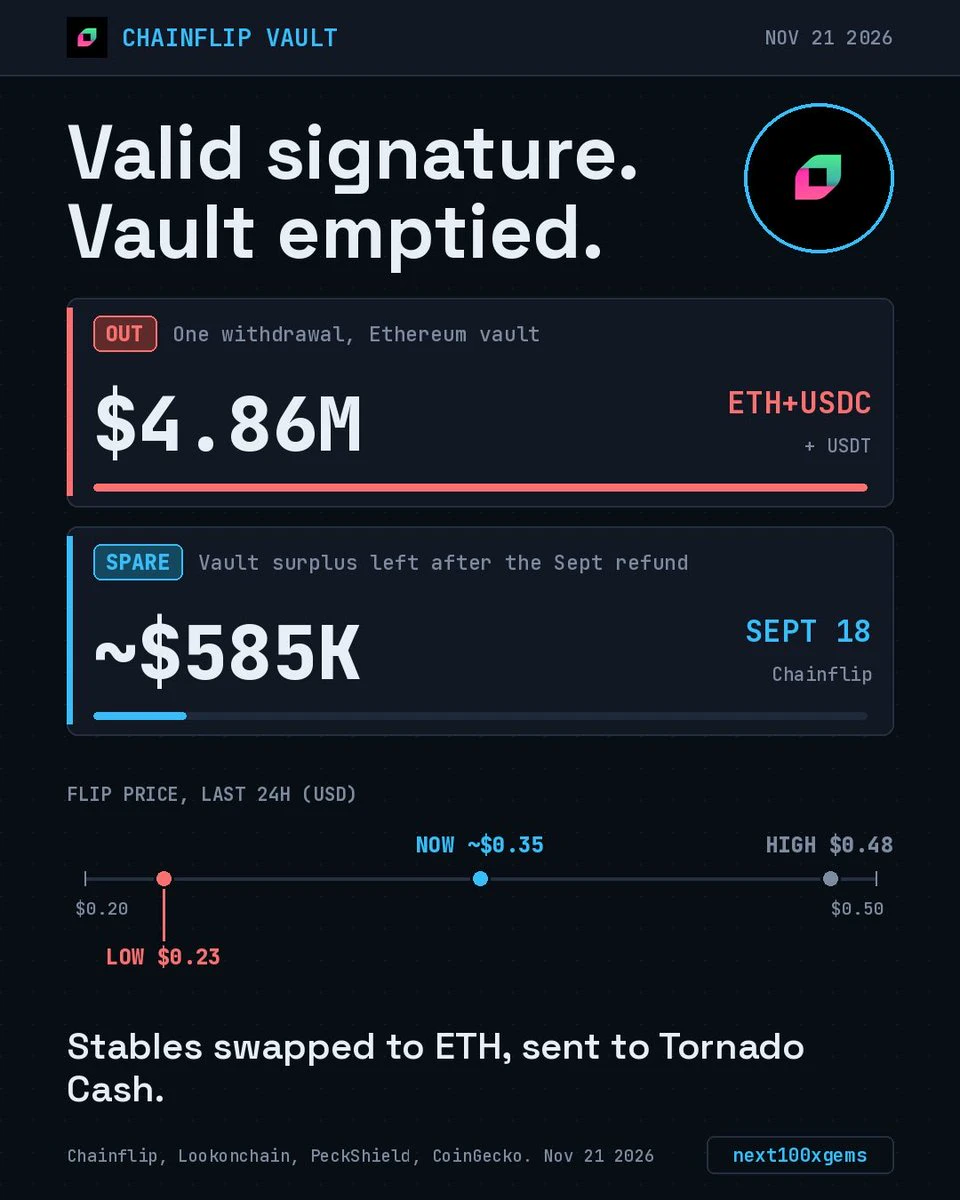
Chainflip's Ethereum vault sent out $4.86M in one transaction, and the signature on it was valid. The loot hit Tornado Cash within minutes.
Second vault hit since September. Last time spare vault funds repaid LPs, leaving about $585K
post-image
FLIP+0.55%
ETH-1.26%
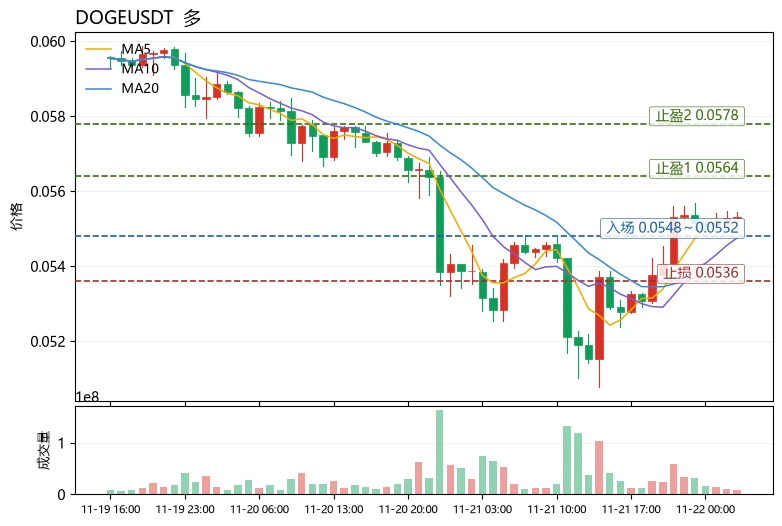
$DOGE Bottom line: Short-term bullish, but this is a rebound amid extreme fear, so only participate with a small position and execute stop-losses without exception. The current price of 0.05533 is above MA5 (0.055202) and MA20 (0.053949), the MACD histogram has turned positive at +0.000345, and the bullish moving average alignment remains intact; however, the RSI is only 56.3 and not yet overbought, while the upper Bollinger Band at 0.0563887 is the first resistance. The range over 30 candles is about 11.12%, indicating elevated volatility, and the +0.0058% funding rate suggests longs are sli
post-image
DOGE-0.22%
XRP-1.15%
BNB-0.76%
$PIPPIN 's moving averages are clearly defined: the 100-day MA is at 0.01872, and the 200-day MA is at 0.03959. The close on the 21st was around 0.017, failing to get above even the 100-day MA.

The resistance levels above are 0.0187 at the 100-day MA, around 0.0202 near the previous high, then 0.0234 further up, with 0.0543 much farther away. Below, 0.0148 is where the move kicked off on the 18th, and below that is the all-time low of 0.011.

One analysis put it plainly: to break above 0.0202, spot buying needs to come in first; derivatives alone won't get it there.

The project itself can't
post-image
PIPPIN-2.21%
ETH-1.23%
  • 1
On my way back from grocery shopping, I saw that crooked tree by the entrance to the residential complex. A typhoon bent it last year, and property management tied it up with a rope for half a year. Now the rope has loosened, but the tree is still crooked. A tree has its own way of growing; you can’t pull it straight. $IDOL Today, this chart is up 79.33% in 24h, climbing from 0.0213 to 0.0392, with 180.9M in trading volume. I’m not looking at the chart itself, but at how it got there. My rule is to first check whether it has the flaw of being “one-and-done”—if it shoots straight up in a single
IDOL-6.71%
  • 1
  • 1
🚀🔥 THE MEMECOIN BATTLE IS ON!
Four big names. But who's really leading the pack? 👀
🐕 $DOGE
🐶 $SHIB
🐸 $PEPE
🟣 $M
Which one has the strongest community and the biggest potential? 💎
👇 DROP YOUR BIGGEST BAG + TAG A MEMECOIN HOLDER WHO NEEDS TO VOTE!
#Memecoins #Crypto #BullRun #MemeCore
post-image
DOGE-0.22%
SHIB-1.28%
PEPE+0.97%
M+6.44%
Yang Guang bit | How to Get Out of a Losing Position After a Sharp Rebound Following a Breakdown
First, let’s be clear about what this is: BTC rebounded from 55126.7 to 60978.3—a deep rebound of 5851 points, or 10.61%—and is currently at 60252. But this is an oversold technical recovery driven by short covering and easing geopolitical tensions (Iran’s “two-day plan” and Trump’s “permanent agreement”), not a trend reversal—the 4-hour EMA7 remains below the EMA30, the medium-term bearish alignment is unchanged, and the key medium-term resistance at 61925 is still overhead. Understand this, and y
post-image
BTC-0.65%
On the 4-hour chart, going long $XRP : buyers need to hold 0.934. I’d like to see price hold this level on a retest. If it breaks below 0.923, I’ll abandon this idea. This is a bounce below the trend, so a stop-loss is crucial. The 4-hour price is at 0.935, below the 0.970 EMA50, so a stop-loss is important. The stop-loss distance is 1.4%, and the distance to TP3 is 2.2%. If the move goes as expected, the risk-reward ratio is about 1.6R. BTC’s short-term trend is bullish, which is a tailwind here.
Long 0.9344–0.9366 Take profit 0.9432 / 0.9484 / 0.9561 Stop-loss 0.9226 Not investment advice ·
post-image
XRP-1.15%
Load More

Join 40 M users in our growing community

⚡️ Join 40 M users in the crypto craze discussion

💬 Engage with your favorite top creators

👍 See what interests you

Trending Topics

BTCBreaksBelow60K

2.1M Views30K Discussing

BTC fell below $60,000 on November 20 for the first time since July, alongside a tech stock selloff and broader pressure on risk assets. Will $60K become resistance, or can BTC quickly reclaim it? What price or volume signals would convince you that selling pressure is easing?

GateDirectIPOPhase3ANTAllocates92100Shares

789K Views4.9K Discussing

NvidiaDropsNearly14Percent

330.4K Views7.6K Discussing

View More