Square
Following
Hot
News
Notifications
Profile
Share your thoughts
placeholder
Article
Alaska’s Senate seat flipping is the congressional signal to watch most closely tonight. Peltola beat Sullivan, giving Democrats one more vote and shaking the Senate’s already razor-thin balance once again. Don’t underestimate one state—a single vote can stall an entire agenda, and the details hold the answer. Was this a one-off or part of a trend? Watch next week to see whether other red states follow suit.
post-image
  • 1
this is how they look at you before you become their exit liquidity
post-image
Trenches
mihao
m
bade
b
mihao
4Cxj...pump
Market Cap
$.
Change
.
24h Vol
$.
Holders
.
PIEVERSE
P
bade
b
PIEVERSE
0x0e...25a9
Market Cap
$.
Change
.
24h Vol
$.
Holders
.
PIPI
P
bade
b
PIPI
6MKD...pump
Market Cap
$.
Change
.
24h Vol
$.
Holders
.
CATMARIO
C
bade
b
CATMARIO
Cc5a...pump
Market Cap
$.
Change
.
24h Vol
$.
Holders
.
DacityCoin
D
bade
b
DacityCoin
DKYc...pump
Market Cap
$.
Change
.
24h Vol
$.
Holders
.
$ETH ‌ ‌ BEARISH ETH has the potential to continue its decline in the short term. The price is trading below the 5, 10, and 30-period MA and EMA. The MACD is weakening, with selling momentum on the rise. Bearish pressure remains dominant, despite the possibility of a temporary rebound. Conclusion: The price is heading downward to test the 1,765–1,750 USDT area. If selling pressure persists, there is potential for a deeper decline.

Note: Crypto and stock transactions carry the risk of loss. Please conduct your own research (DYOR) before trading. This information is for general purposes only a
post-image
ETH-1.23%
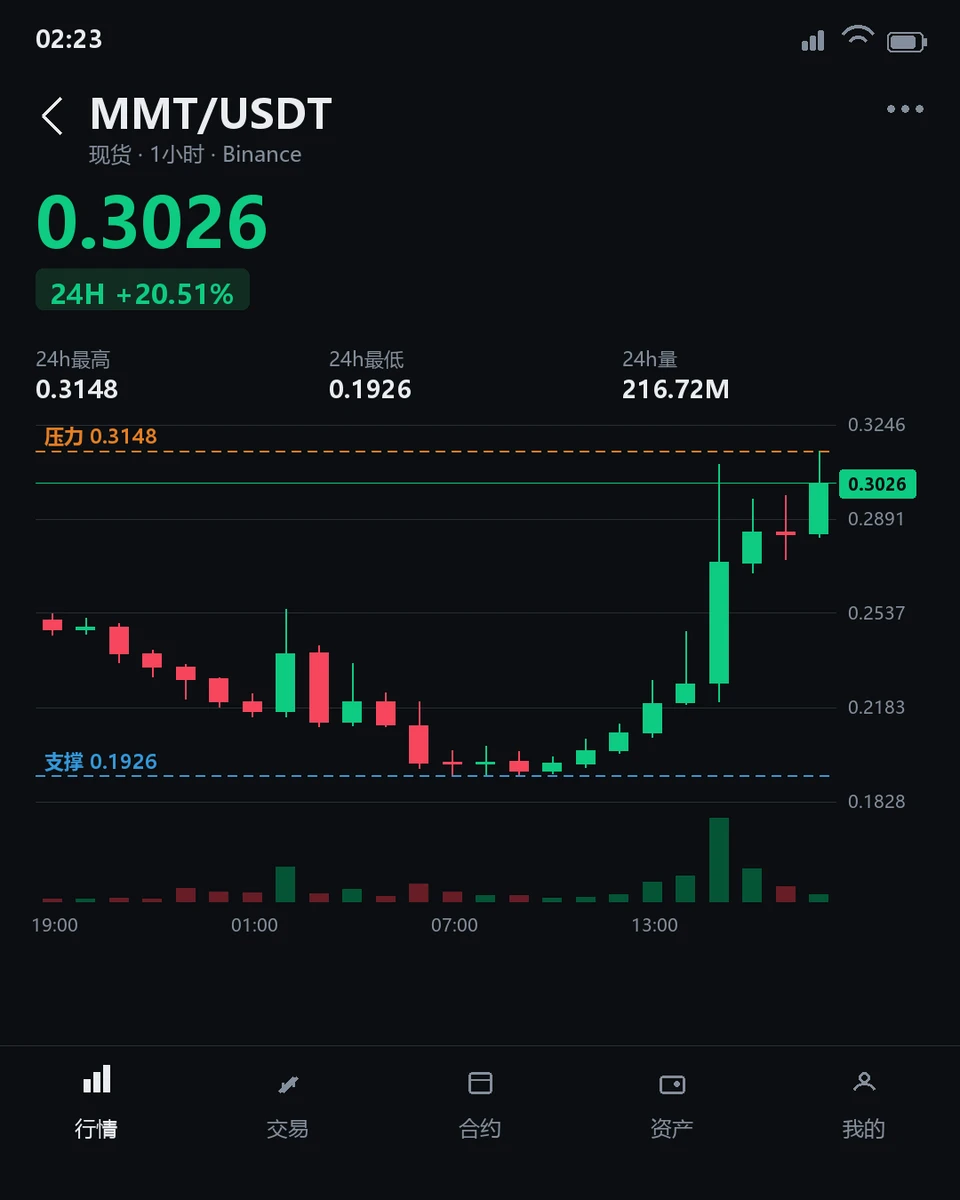
$MMT Keeps Getting Stronger as It Rises; What Deserves the Most Attention Now Is Whether Buyers Can Absorb Selling Pressure

$MMT is currently trading at 0.3037, up 20.95% over 24 hours, and has fluctuated between 0.1926 and 0.3148. The 1-hour chart shows a relatively strong trend, and the 4-hour chart is also holding firm, creating a confluence across multiple time frames. The key question is whether buyers will step in at these elevated levels, which matters more than simply chasing the rally. The 1-hour RSI14 is 79.96, approaching overbought territory, while the 4-hour RSI14 is as high as 7
post-image
MMT-2.35%
$ZEC ‌ ‌ Downtrend (Bearish). The price is trading below the MA5, MA10, MA30, and key EMA levels. - The MACD is negative, indicating that selling pressure remains dominant. - A previous rebound failed to sustain, and the price has weakened once again. Downside targets: 905 – 891.62. Resistance: 920 – 930. Conclusion: ZEC has the potential to continue its correction toward 891.62. If this level is breached, bearish pressure could intensify. The bearish scenario is invalidated if the price regains strength and moves above 930.

Note: Crypto and stock transactions carry the risk of loss. Please
post-image
ZEC+1.29%
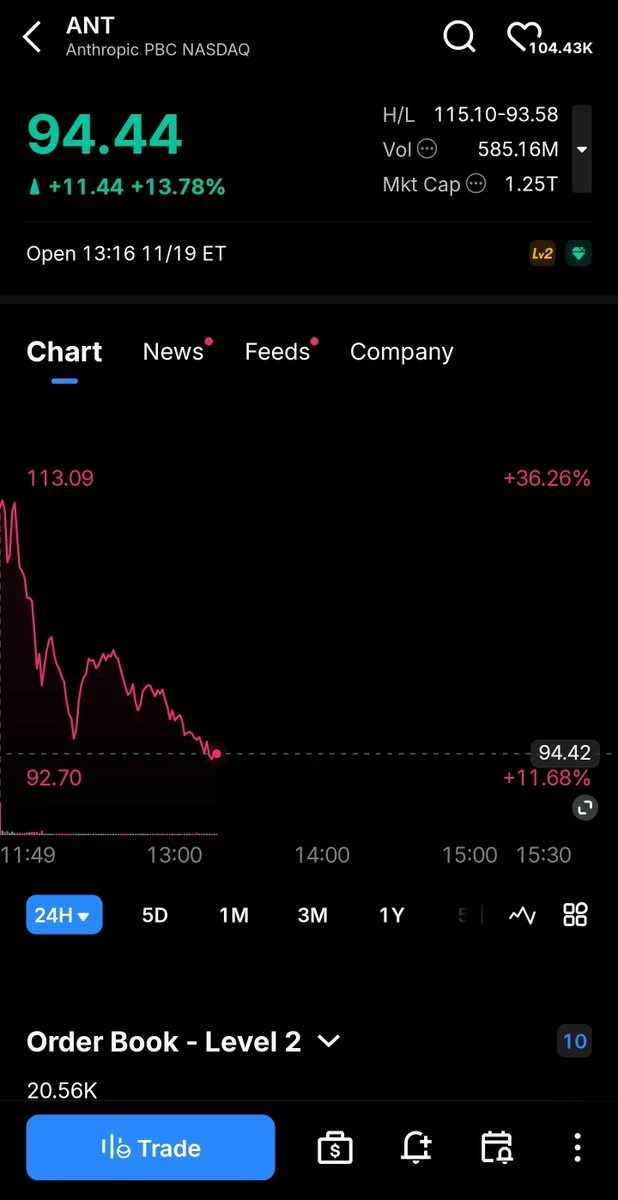
It would be so funny if it closes red by end of day.
post-image
Does anyone know what happened?
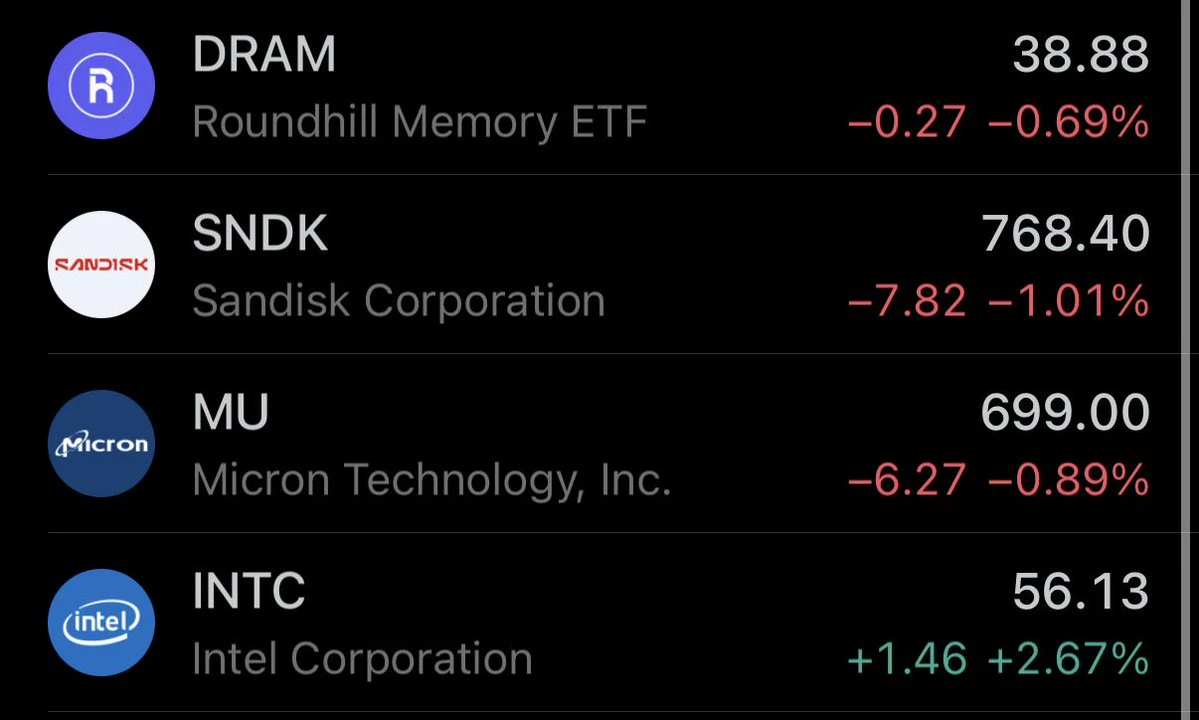
Bought some high momo AI stocks here
I think it’s quite likely that we get a dead catch bounce from $ANT IPO day
Saw this idea from a few other traders and I think it probably works well
Looking for a 15-20% bounce from here
post-image
ANT-13.60%
The selling pressure on $ZKC is finally starting to ease, but this rebound still seems to be waiting for a real catalyst to get going. Dip buyers are just sitting tight for now, waiting to see if anyone is willing to enter. Take-profit: 0.02685 Stop-loss: 0.02413 Market movers: $ICNT : Current price 0.4273 - 24-hour gain: +33.32%$ETH : Current price 1,772.15 - 24-hour gain: +0.26%
post-image
ZKC-4.94%
ICNT-10.32%
$BTC ‌ ‌ BEARISH BTC has the potential to continue its decline in the short term. The price is trading below the MA5, MA10, and MA30. - The MACD is in negative territory, indicating that selling pressure remains dominant. - The previous rebound has weakened, and the price has corrected downward once again. Price targets: Potential to test the support level at 62,062. If this level is breached, the decline may continue. The nearest resistance is around 63,250. Conclusion: The outlook remains BEARISH as long as BTC fails to break back above the 63,250–63,460 range.

Note: Crypto and stock trans
post-image
BTC-0.65%
At the tire repair shop, the mechanic checks whether the tread is worn smooth first, not whether the valve cap is shiny. $1000LUNC These past two days, it’s been framed as “an old coin coming back to life,” with claims that rising volume at the bottom means money has returned. Sounds convincing, but a closer look says otherwise: 24h trading volume was 87.0M, with a high of 0.0498 and a low of 0.0391, a swing of over twenty points—that looks more like turnover after a sharp rally than the start of a slow bull run.
With old coins, the key isn’t how much they rise in a day, but whether they can
  • 2
  • 2
Anthropic Launches the Biggest IPO in History! Priced at $83 per Share and Raising Over $100 Billion
live-cover
LIVE2,669
ZEC+1.16%
BTC-0.67%
ETH-1.26%
SOL-0.77%
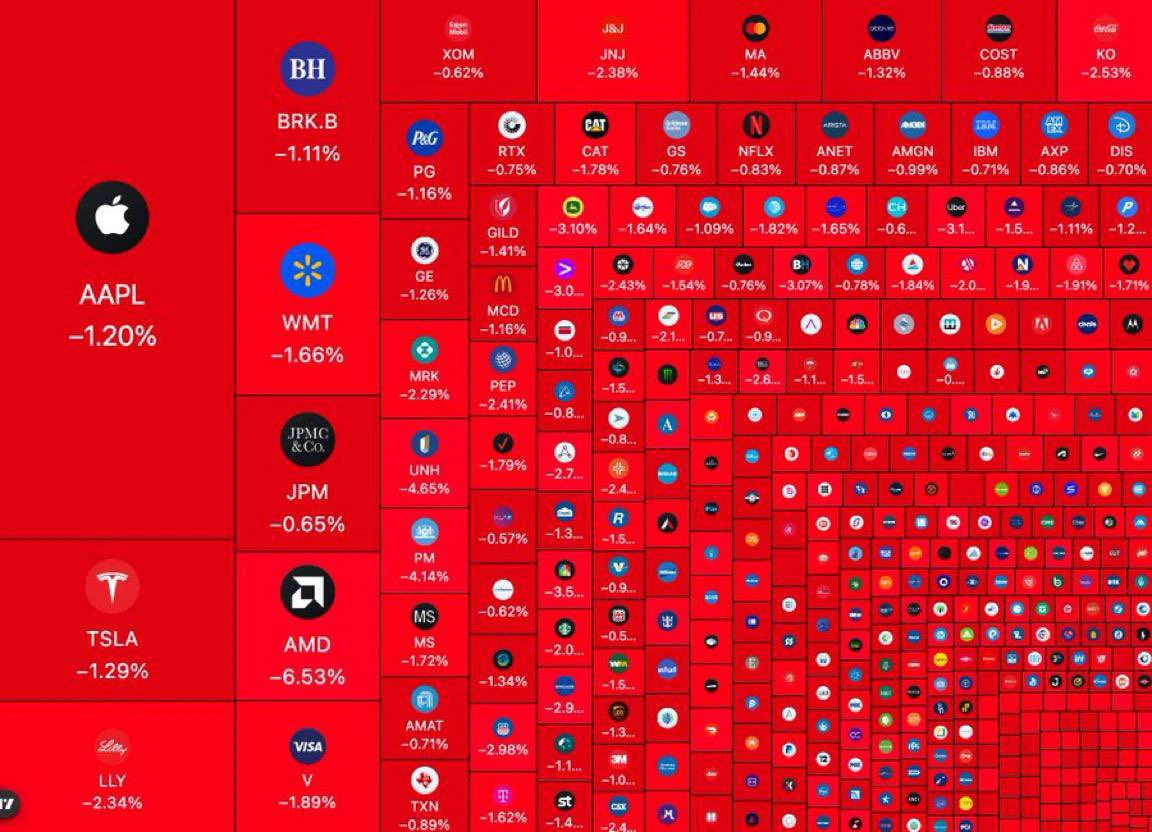
MASSIVE CRASH IN US STOCK MARKET
$1.16 TRILLION wiped out in just 60 minutes.
post-image
[NEW STREAMER]market update
live-cover
LIVE1,642
BTC-0.67%
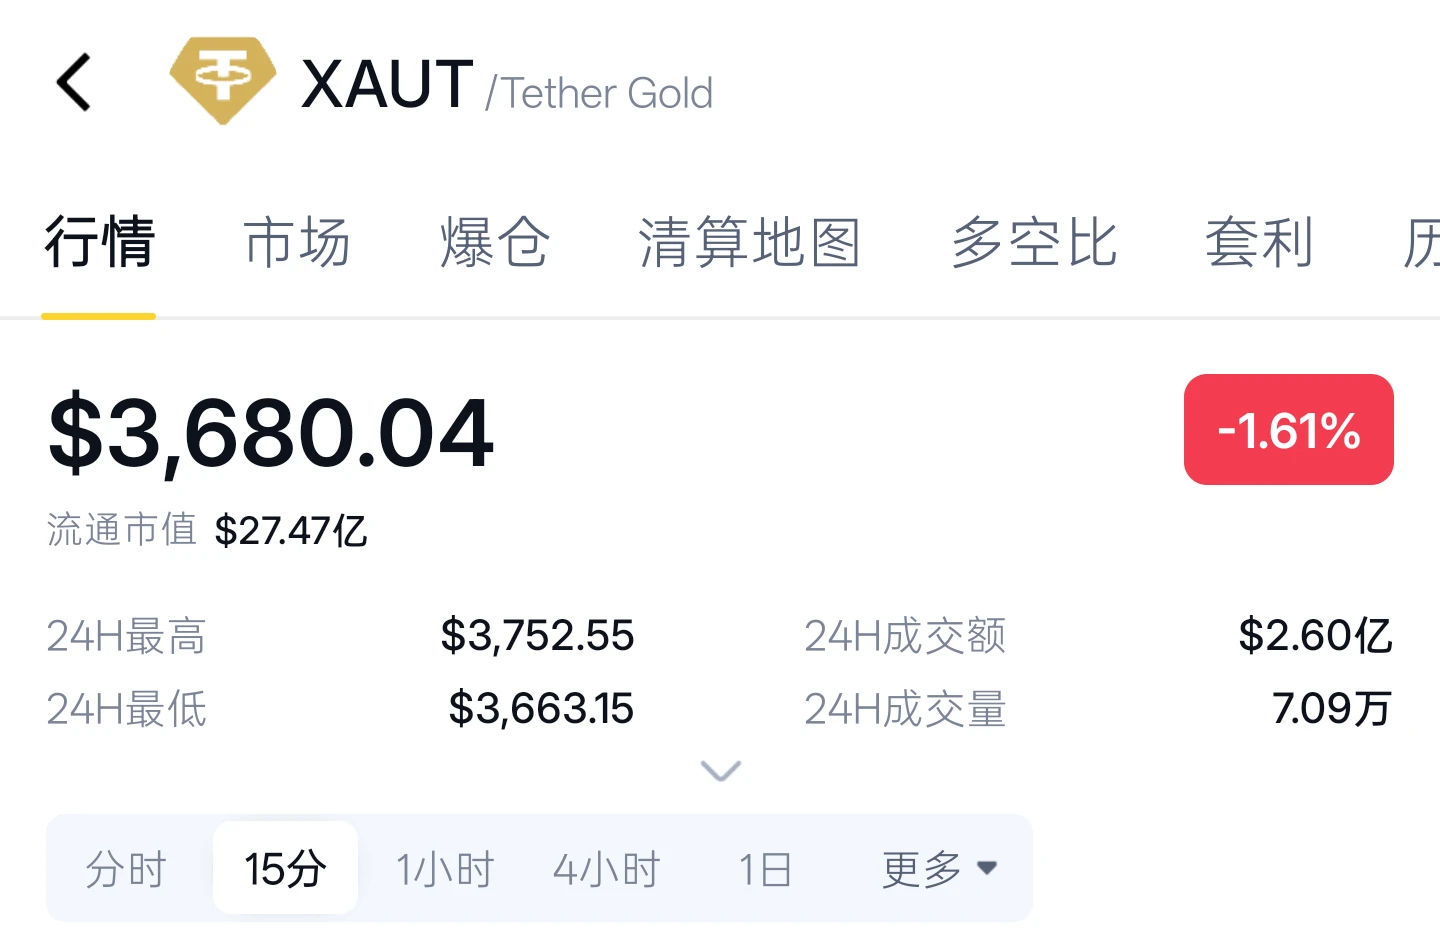
A volume-backed selloff after a sharp rally! 3670 support is holding for now; short the bounce!

Gold rallied to around 3758 during today’s Asian session before meeting resistance and pulling back. Selling pressure from bears then continued to build, sending prices lower in choppy trading and through the previous platform at 3720 and the key 3700 level. After hitting a low at the key 3670 level, prices rebounded and are currently trading near 3689. Overall, the market is showing a bearish pattern of “rally, pullback, then rebound from the lows,” with bears firmly in control. 3670 is a key shor
post-image
GLDX-0.40%
PAXG+0.37%
SPCX-4.10%
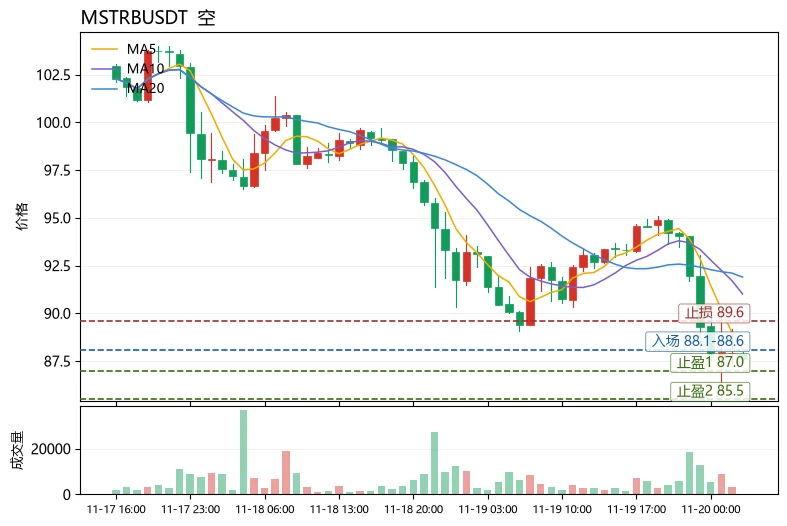
$MSTRB The bearish structure remains intact, so rallies are still primarily opportunities to sell. The current price of 87.6 is nearing the lower Bollinger band at 87.07. A technical bounce may occur in the short term, but it would not change the downtrend.
The moving averages show MA5=88.12 below MA20=91.89, with short- and medium-term averages in a bearish alignment and price trading below them. The MACD histogram remains negative at -0.487, as bearish momentum continues to build. RSI=28.1 is in oversold territory, while the Fear and Greed Index at 10 signals extreme fear, indicating that ma
post-image
MSTRB
MSTRBMSTRB
Four.meme
MC:$3.29KHolders:4
0.07%
AAVE-1.22%
Anthropic officially lists today at an issue price of $83 and a $1.5 trillion valuation, with its first-day performance serving as a barometer for risk assets. The S&P 500 has already fallen for five straight days, and even Nvidia's better-than-expected earnings couldn't prop it up. Tonight, first watch whether the debut can lift sentiment; if not, the market will keep grinding lower.
$BTC is trading back and forth between 62,000 and 64,400. 62,000 is the floor; if it gives way, support will need to be found near 61,000. It will take a move above 64,800 to signal a recovery; otherwise, the ch
post-image
BTC-0.67%
XRP-1.15%
NEAR+1.17%
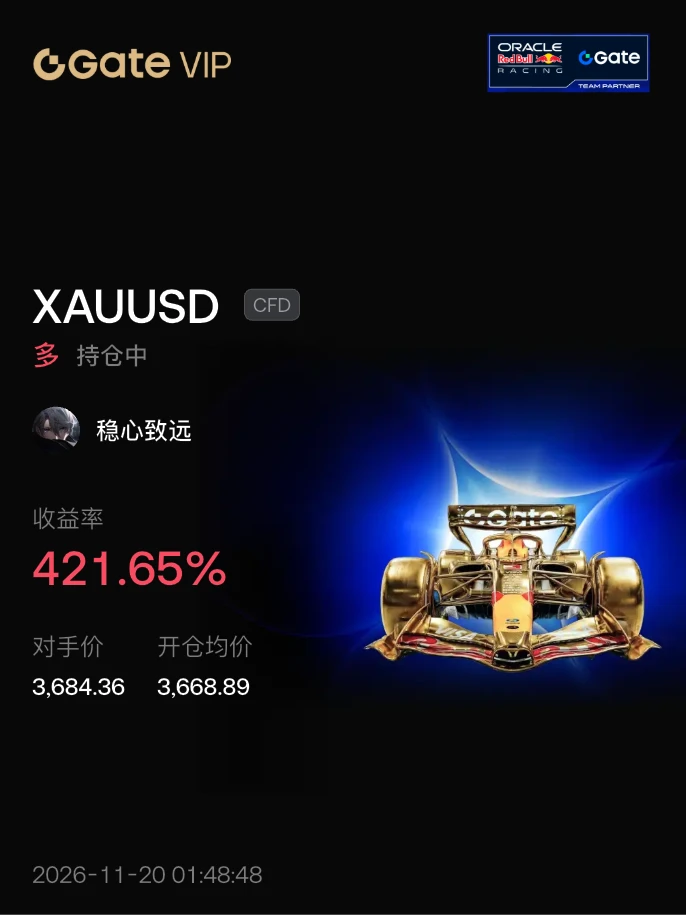
#晒出我的持仓收益 Bought the dip, guys!!!
post-image
XAUUSD-1.37%
$XRP ‌ has found a pause after a heavy sell-off, but is this the start of a proper recovery?

After dropping to $0.8930, XRP has bounced and is now consolidating around $0.9738. Buyers are showing some interest, but the daily trend still needs confirmation.

Levels I’m watching:

Support: $0.95
Major support: $0.893
Immediate resistance: $1.00–$1.02
Trend reversal zone: $1.131

A reclaim of $1.00–$1.02 would be a positive first step. A stronger move above the daily Super trend at $1.131 would make the recovery more convincing.

For now, the bounce is encouraging, but XRP needs to prove it ca
XRP-1.15%
NVDA-1.58%
1000LUNC | Long 🟢 | Bullish | 15-minute 24-hour: +21.74% | Volume: 85.5M USDT Long rationale: Price is above EMA200; EMA20/50/200 are in bullish alignment; RSI14 is 59.0; MACD histogram is positive; ADX14 is 12.7; volume is 1.07x the 20-candle average; trend pullback/continuation. Entry price: 0.04745 Stop loss: 0.0453404 Take-profit 1: 0.050087 | Take-profit 2: 0.0516692 | Take-profit 3: 0.0537789Entry price is for reference only; do not chase the price. The strategy is invalidated if the stop-loss level is hit. This is a technical analysis strategy only and does not constitute financial adv
post-image
Load More

Join 40 M users in our growing community

⚡️ Join 40 M users in the crypto craze discussion

💬 Engage with your favorite top creators

👍 See what interests you

Trending Topics

GateLeadsRWAPerpExpansion

454.6K Views3.7K Discussing

Glassnode’s latest The Week On-chain report shows that Gate expanded its RWA perpetual listings from around 20 at the start of the year to 490 today, moving from 5th to 2nd by listing count — the biggest climb among tracked exchanges this year. Gate’s RWA perp open interest has also grown to around $2.1B, more than 20x its January level, ranking third globally behind Binance and Hyperliquid. From stocks and ETFs to indices, commodities and FX, RWA perpetuals are bringing more traditional assets into crypto trading. Which traditional assets would you most like to see Gate list next? [👉 Full Report](https://research.glassnode.com/the-week-onchain-week-46-2026/)

FedMayNeedA50bpRateHike

398.3K Views2.5K Discussing

ThreeLaunchpoolProjectsNowLive

984.2K Views35.4K Discussing

View More