


Square
Following
Hot
News
Notifications
Profile
Share your thoughts
placeholder
Article
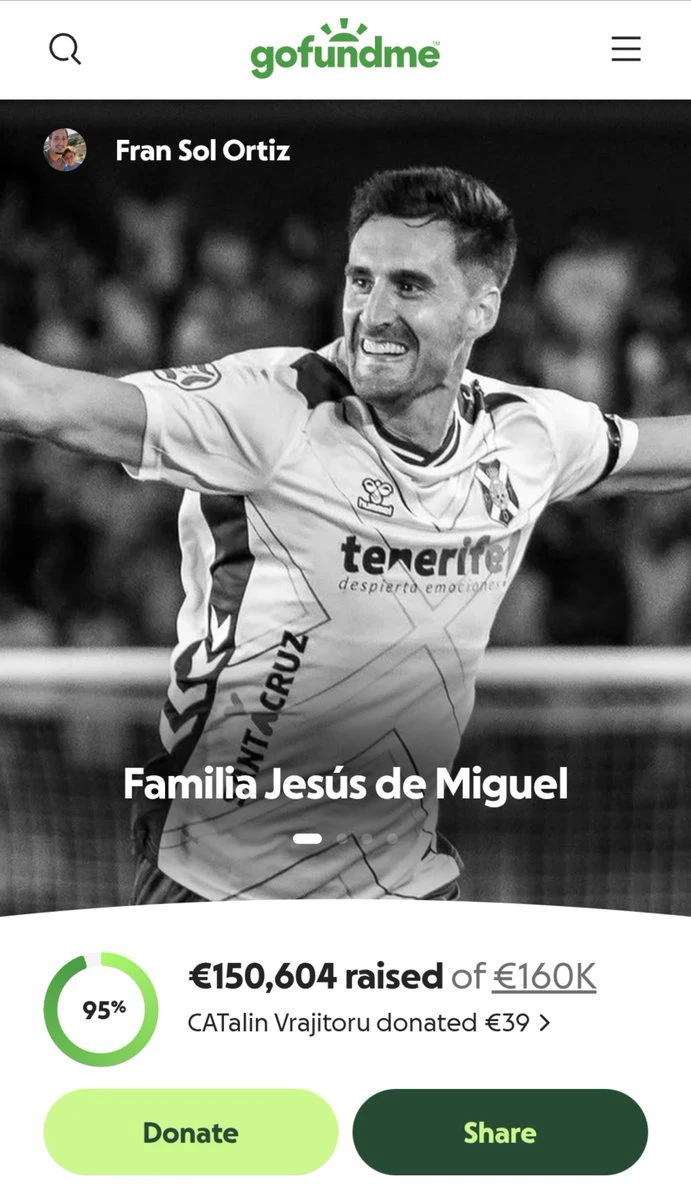
Fans are closing in on raising €160,000 for the family of the late Jesus de Miguel.
Once again, Humanity Wins!❤️
post-image
BTC ETH MARKET PREDICTION
live-cover
LIVE12
Trenches
ZIG
Z
bade
b
ZIG
0x8c...1145
Market Cap
$.
Change
.
24h Vol
$.
Holders
.
STONK
S
bade
b
STONK
6GmA...UNgx
Market Cap
$.
Change
.
24h Vol
$.
Holders
.
BTC
B
bade
b
BTC
C5xp...pump
Market Cap
$.
Change
.
24h Vol
$.
Holders
.
IDOL
I
bade
b
IDOL
0x3b...ab07
Market Cap
$.
Change
.
24h Vol
$.
Holders
.
scamsem
s
bade
b
scamsem
41Wp...pump
Market Cap
$.
Change
.
24h Vol
$.
Holders
.
I just saw a liquidation record that made me even more confident in my bearish view on $TRUMP
: a trader’s $2.68 million short position was liquidated outright. More importantly, he had already taken a hit on Bitcoin before. After two consecutive blowups, he still dared to put such a heavy short position on a small-cap contract with only $30 million in open interest. This was simply a lack of risk management, and it’s no surprise he got stopped out. The short liquidation shows that the price did surge upward at one point, but the rally did not reverse the overall direction.
The current price i
post-image
TRUMP-0.90%
$AKE I’m betting this pullback won’t break 0.0050. If it does, I’ll wash my hair upside down on livestream. It’s at 0.0057 now, up 42% in 24 hours. It hit a high of 0.0066 before getting slammed back down, with trading volume of 413 million—retail traders can’t generate that kind of volume. The group was still calling for it to go to zero this morning, then in the afternoon it shot straight past the previous high—a classic double whammy of futures short liquidations and spot buying. The order book shows bids below 0.0055 getting eaten up fast, while the sell wall above 0.0060 is thick but gets
AKE+6.07%
Today's breakfast
Spicy pepper soup + Fat Uncle brand pan-fried dumplings
Aren't these golden pan-fried dumplings making your mouth water? 😍
#AsiaPacificStocksPlunge #ShareWeekly

Asia-Pacific Markets Under Pressure: Is the AI Trade Facing a Major Reality Check?

The recent weakness across Asia-Pacific equity markets highlights an important change in global investor sentiment. After a powerful rally driven by artificial intelligence, semiconductor demand, and expectations of long-term technology growth, investors are beginning to question whether some valuations have moved too far ahead of actual business performance.

In my view, this is not simply a normal market correction. It looks more like a selective repricing of companies
CryptoChampion
#AsiaPacificStocksPlunge #ShareWeekly

Asia-Pacific Markets Under Pressure: Is the AI Trade Facing a Major Reality Check?

The recent weakness across Asia-Pacific equity markets highlights an important change in global investor sentiment. After a powerful rally driven by artificial intelligence, semiconductor demand, and expectations of long-term technology growth, investors are beginning to question whether some valuations have moved too far ahead of actual business performance.

In my view, this is not simply a normal market correction. It looks more like a selective repricing of companies that have become heavily dependent on the AI investment cycle. South Korea, Taiwan, and Japan are experiencing different levels of pressure because their market structures and exposure to technology stocks are not the same.

1. The AI Valuation Trade Is Losing Momentum

The correction began with significant weakness in U.S. semiconductor stocks. The Philadelphia Semiconductor Index reportedly dropped around 12% in one session, marking its biggest single-day decline since 2020.

The selling pressure quickly spread throughout Asia. SK hynix and Samsung Electronics experienced intraday declines exceeding 10%, while SoftBank briefly lost nearly 16%.

These movements suggest that investors are reducing exposure to crowded technology positions. The concern is not necessarily that AI demand is disappearing. Instead, the market may be questioning whether current share prices already reflect too much future growth.

This distinction matters because a strong industry can still experience a major stock market correction when valuations become excessive.

2. Why Different Asian Markets Are Reacting Differently

One interesting development is that not every Asian market experienced the same selling pressure.

The Hang Seng Tech Index recovered almost all its early losses after opening lower, while mainland Chinese A-shares showed greater resilience compared with Japanese, South Korean, and Taiwanese equities.

This suggests that investors are becoming more selective rather than abandoning every risky asset simultaneously.

Markets with expensive technology valuations and concentrated semiconductor exposure are facing stronger pressure. Meanwhile, markets with relatively lower valuations and different sector compositions are showing better resistance.

South Korea's finance minister also described the market reaction as excessive and indicated that margin-related rules would be relaxed for three months. This demonstrates that policymakers are paying attention to the potential impact of external volatility.

3. South Korea: High Risk, High Recovery Potential

South Korea is my first market to watch.

Samsung Electronics and SK hynix represent significant parts of its technology investment story. Both companies are closely connected to global memory demand, AI infrastructure, and semiconductor development.

If semiconductor sentiment improves, these stocks could potentially lead a strong recovery. However, concentrated foreign investor positioning and high sensitivity to global technology valuations could create additional volatility.

I would prefer to wait for U.S. semiconductor stocks to stabilize before considering opportunities in this market.

4. Taiwan: Watching TSMC for a Reversal

Taiwan is my second priority.

TSMC remains central to the global semiconductor supply chain, particularly because of its advanced manufacturing capabilities. However, the recent decline has placed considerable pressure on Taiwanese equities, with the index reportedly falling more than 20% from its peak.

After such a substantial correction, valuations and potential entry opportunities deserve attention. Still, a sustainable recovery will depend heavily on whether U.S. semiconductor stocks can establish a stable bottom.

5. Japan: A Different Recovery Story

Japan comes third in my ranking.

The Nikkei has entered technical bear-market territory, but not every sector is equally vulnerable. Traditional manufacturers and automakers, including Toyota, have shown relatively greater resilience compared with highly exposed technology-related assets.

SoftBank remains an important source of volatility because of its technology investment exposure.

Japan could experience an earlier technical rebound, but whether that recovery can continue will depend on global risk sentiment and corporate earnings.

My Market Strategy and Final View

My preferred order of attention is South Korea first, Taiwan second, and Japan third.

However, I am not treating falling prices as automatic buying opportunities. A sharp rebound after heavy selling does not necessarily confirm that a new bullish trend has started.

The signals I want to see are U.S. semiconductor stocks holding their lows for several consecutive sessions, SK hynix and TSMC stopping their downward momentum, and improving market breadth across Asian equities.

For now, capital protection, controlled leverage, and patience are more important than chasing short-term rebounds.

I believe the long-term AI story remains important, but investors must separate genuine business growth from excessive market expectations. The next opportunity may come when valuations become more reasonable and price action begins confirming that selling pressure is fading.

What matters most is not buying the first dip, but identifying the point where the market finally starts recovering with strength.

This is my market perspective, not financial advice.

#亚太股市集体重挫 #WCTCS9 @Gate_Square #GateSquareTradingChallenge
  • 2
MARKET PREDICTION
live-cover
LIVE88
That was fast.
Midnight, Charles Hoskinson's privacy chain, took nearly 7 months to reach 1M transactions after its March launch.
The next 500,000 took ~10 days. It passed 1.5M on November 5.
@MidnightNtwrk @IOHK_Charles
NIGHT-3.10%
#GateSocialAnnualStreamerAndCreatorAwards #ShareWeekly

Gate Social 2026 Awards: Recognition Should Reflect Real Contribution, Not Just Activity

Every growing online community needs people who contribute something meaningful. Some members educate others through live discussions, some explain market developments through written analysis, and others help beginners understand the cryptocurrency industry. These contributions may look different, but each one plays an important role in building a stronger community.

This is why I believe the Gate Social 2026 Year-End Community Awards are an impor
CryptoChampion
#GateSocialAnnualStreamerAndCreatorAwards #ShareWeekly

Gate Social 2026 Awards: Recognition Should Reflect Real Contribution, Not Just Activity

Every growing online community needs people who contribute something meaningful. Some members educate others through live discussions, some explain market developments through written analysis, and others help beginners understand the cryptocurrency industry. These contributions may look different, but each one plays an important role in building a stronger community.

This is why I believe the Gate Social 2026 Year-End Community Awards are an important opportunity to recognize the people behind the platform's growth.

According to the official announcement, registration is open for two major categories: Annual Streamer and Annual Creator. Participants have until November 10, 2026, to complete registration, with the registration period running from November 3 to November 10.

The Top 20 participants in each category will receive recognition and rewards. The announced prizes include DJI products, AirPods, projectors and USDT. These rewards make the competition exciting, but I believe the recognition itself should carry an even greater meaning.

Two Categories, Two Different Responsibilities

Annual Streamer and Annual Creator should be evaluated according to the different skills required by each role.

A successful streamer does more than simply start a livestream. Keeping viewers interested requires preparation, communication skills, consistent interaction and a good understanding of the topics being discussed. In crypto streaming, explaining market movements, discussing trading opportunities, understanding risk and responding to audience questions can make a session genuinely educational.

On the other hand, an Annual Creator must communicate ideas through written or visual content. Research, originality, presentation, accuracy and analytical thinking are essential. A good post should not simply repeat market headlines. It should explain what happened, why it matters and what developments readers should monitor next.

Both categories deserve recognition, but their performance should be measured with appropriate criteria.

The Difference Between Posting and Creating Value

One issue I believe deserves serious attention is content originality.

Publishing ten similar posts does not necessarily provide more value than publishing one carefully researched analysis. Likewise, high engagement does not always mean that the information being shared is accurate or useful.

In my opinion, a fair evaluation should consider several factors:

- Originality: Does the participant present independent ideas rather than repeatedly copying existing discussions?
- Research: Are market observations supported by reliable information and meaningful analysis?
- Consistency: Does the participant contribute regularly throughout the competition?
- Educational Value: Can readers or viewers learn something useful from the content?
- Engagement Quality: Are discussions meaningful, with genuine responses rather than activity created only to increase numbers?
- Accuracy and Responsibility: Does the creator explain uncertainty and acknowledge potential risks?

These qualities can help distinguish genuine contributions from activity that only looks impressive on a leaderboard.

Why Fair Competition Matters

Awards become more valuable when participants trust the selection process. A transparent evaluation system encourages creators to improve their work instead of focusing only on increasing publication frequency or engagement numbers.

I would also like to see equal opportunities for different content styles. A detailed market analysis, an educational beginner's guide, a thoughtful livestream and an original industry discussion can all contribute value in different ways.

My Personal Perspective

I appreciate opportunities like Gate Social's annual awards because they encourage people to share knowledge, develop communication skills and become more involved in the crypto community.

My preference is to be recognized through meaningful analysis, original observations and consistent contributions. I believe a strong creator should help readers think independently rather than simply tell them what to believe.

Ultimately, the Top 20 should represent participants who have demonstrated genuine effort, creativity, knowledge and positive community impact throughout the year.

The best award is not just a prize received at the end of a competition. It is the trust and respect earned from the community through the quality of one's work.

What is your opinion? Should Gate Social prioritize originality and research, audience engagement, consistency, or a balanced combination of all three when selecting the Annual Streamer and Annual Creator Top 20?

This is my market perspective, not financial advice.

#WCTCS9 #weeklyshare @Gate_Square #GateSquareTradingChallenge
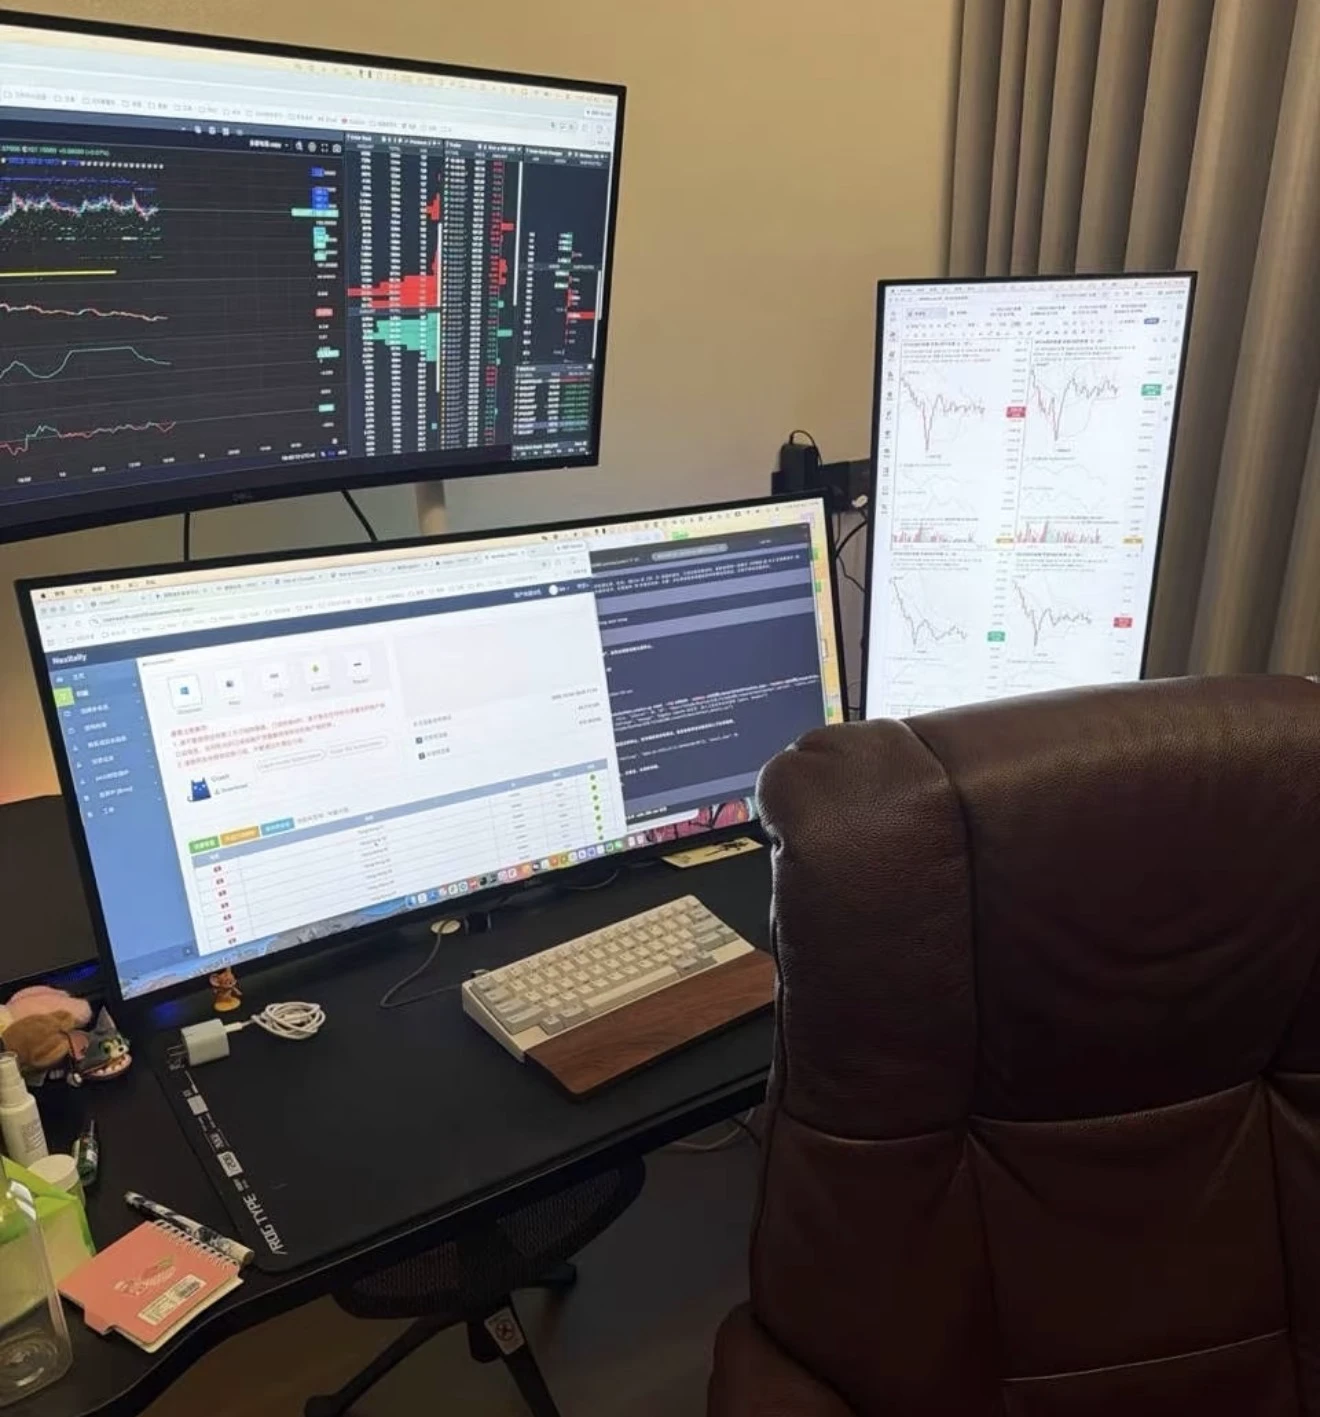
Crypto market: Long-term holder supply share—are old wallets accumulating or distributing? Bull-to-bear transition: old coins stay put, or even continue accumulating. Bear-to-bull transition: old coins start moving to exchanges in large amounts. When veterans distribute, newcomers are celebrating—this is what defines a cycle top. ③ Exchange balances: falling balances = coins being withdrawn (accumulation); rising balances = preparing to sell. Note: ETF/institutional custody can distort this metric, so compare like with like. ④ Stablecoin total market cap: the market’s “ammunition reserve.” Exp
post-image
BTC-0.65%
ETH-1.23%
Crypto cycles aren’t one clock; they’re four gears turning together. ① The primary cycle: liquidity (the most important, and most often overlooked). The crypto market doesn’t create money; money comes from outside. The real cycle is: Fed rate hikes/balance sheet reduction → risk assets bleed → rate cuts/balance sheet expansion in a bear market → liquidity spills over → bull market. Halving is just a narrative; liquidity is the fuel. The 2020 bull run was so explosive because the halving coincided with unlimited QE. Focusing only on the halving and ignoring liquidity is like trying to carve a m
post-image
BTC-0.65%
  • 1
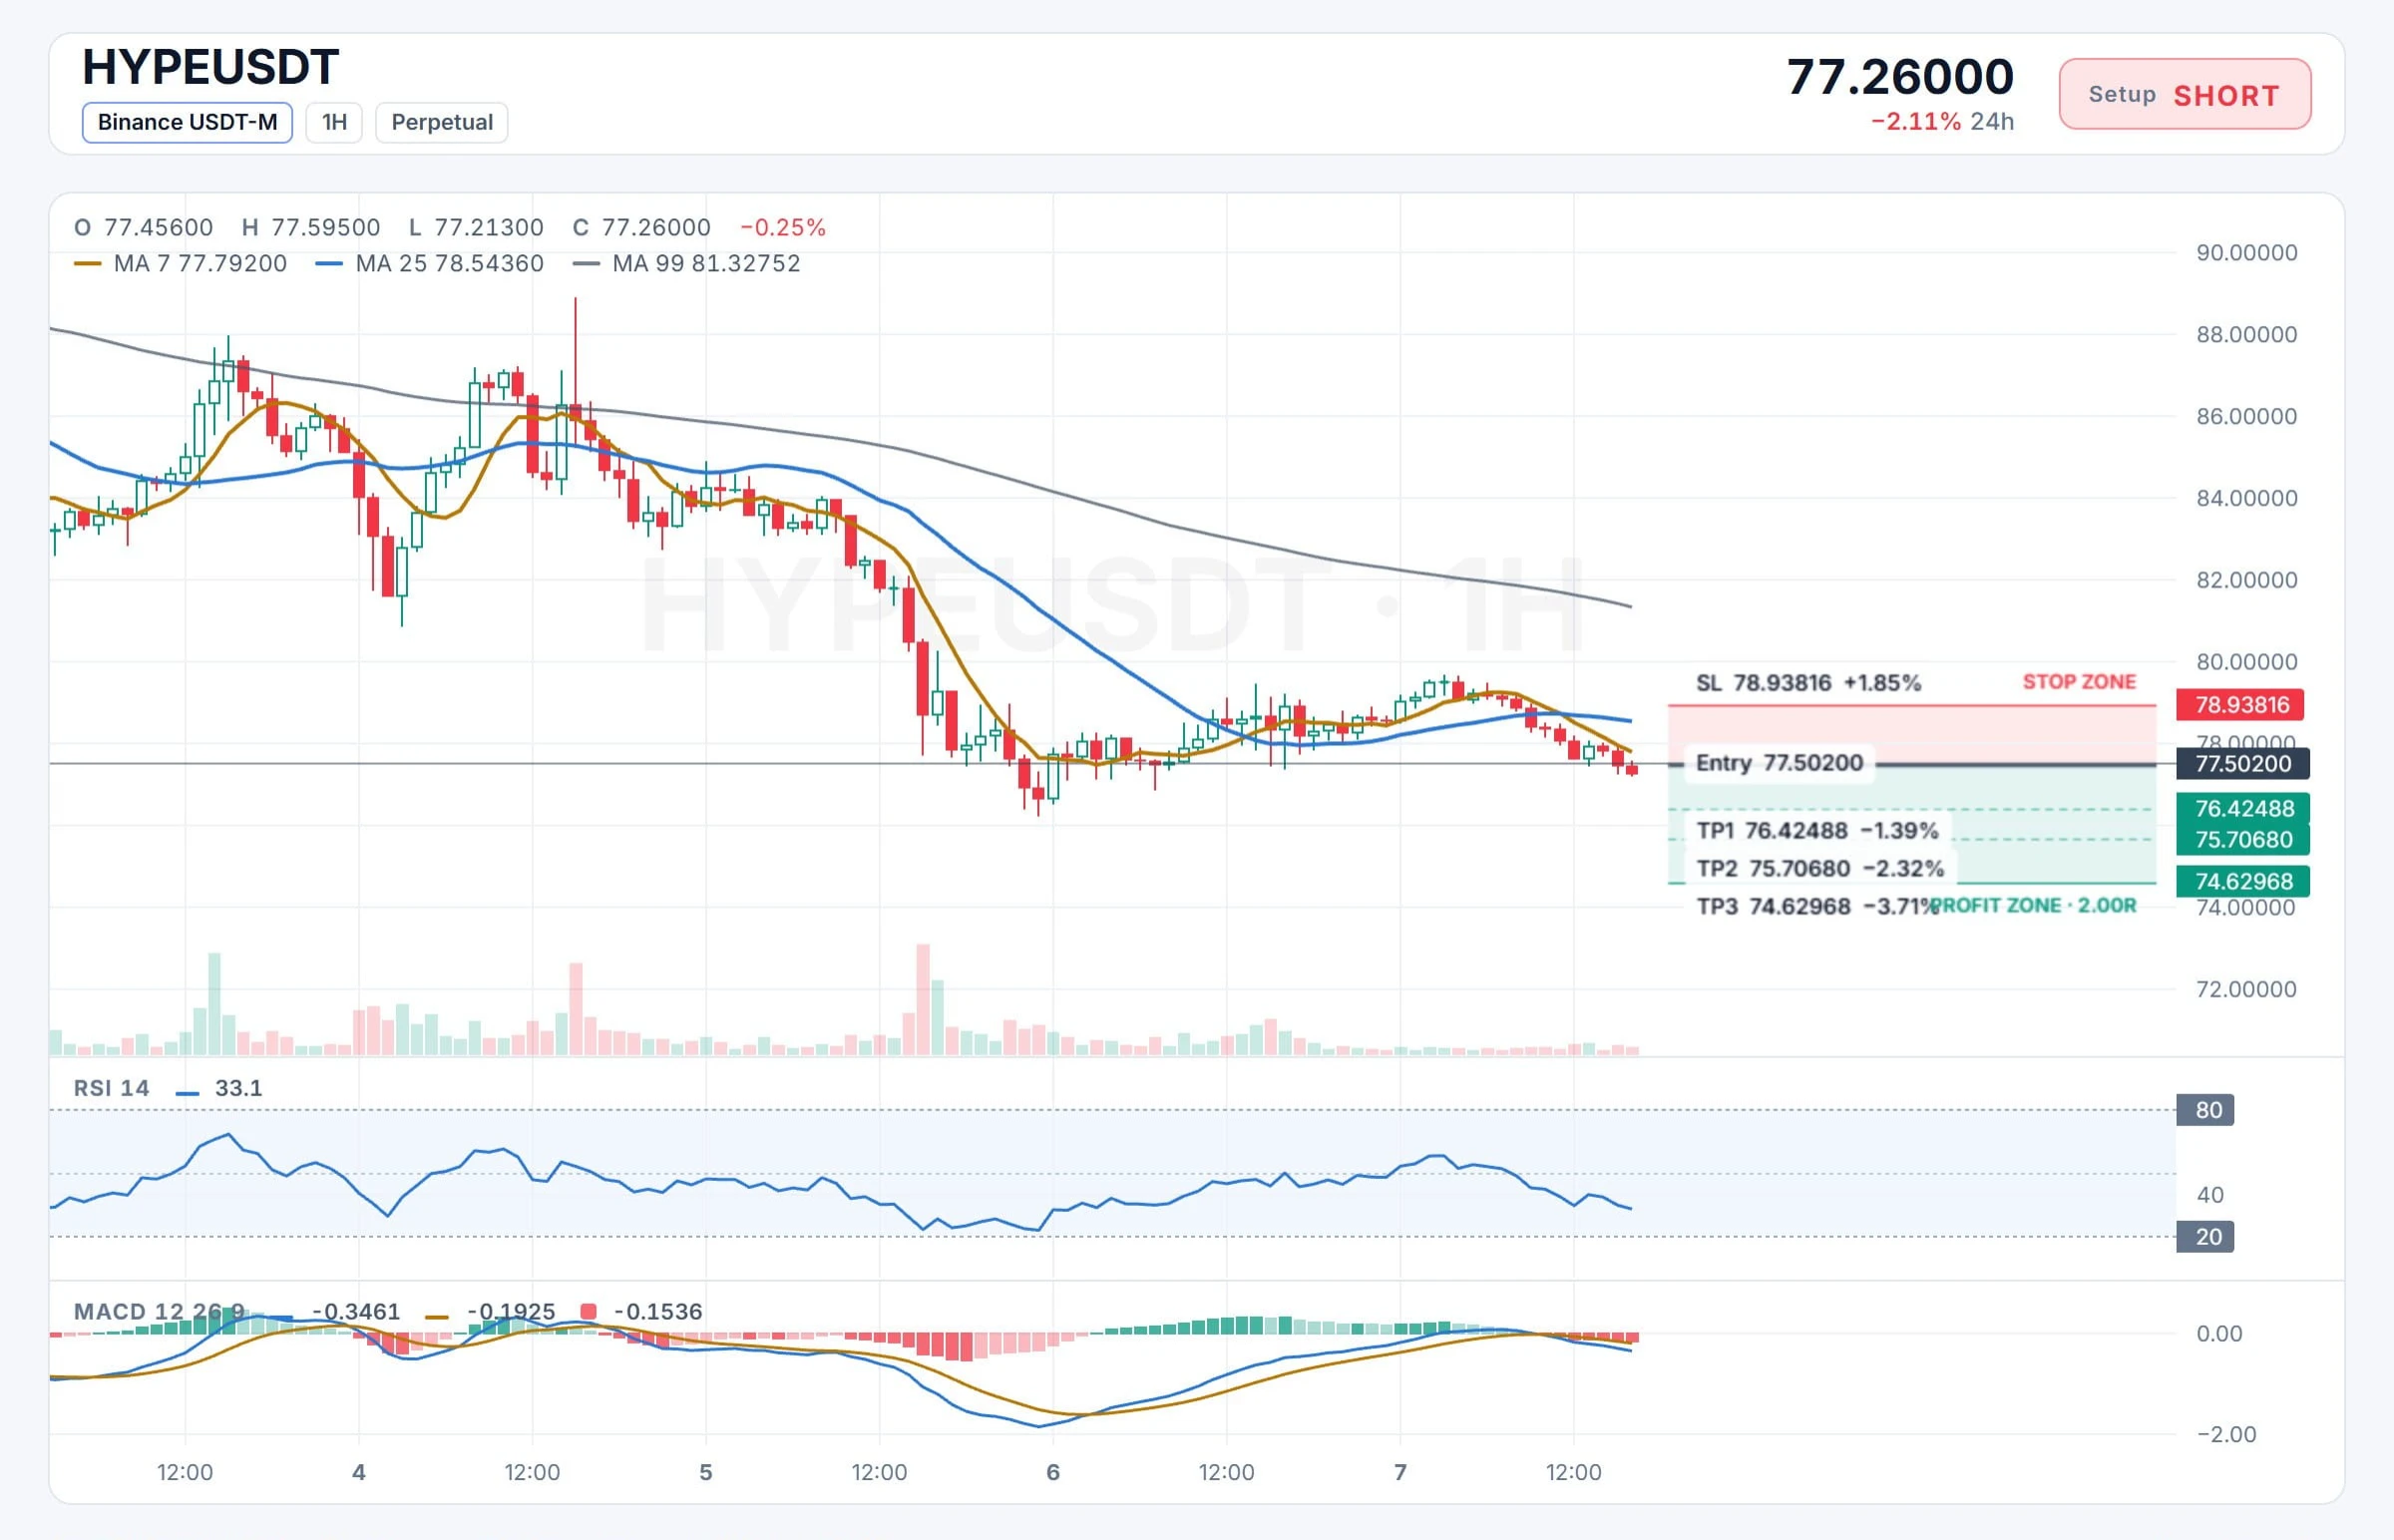
BULLS CAUGHT $HYPE USDT Short Trade Ready to Go

$HYPE /USDT

Trade Direction: SHORT

Entry Price Zone: 77.50200

Take-Profit Levels:
🔹 TP1: 76.42488
🔹 TP2: 75.70680
🔹 TP3: 74.62968

🛑 Stop-Loss Level: 78.93816

$HYPE ‌
post-image
HYPE+0.33%
This guy has a really strong mentality. He's long BTC and ETH and sitting on a combined unrealized loss of over $2 million, yet he's still so calm. But looking at his liquidation price, he doesn't seem to have much to worry about. $BTC $ETH
post-image
BTC-0.65%
ETH-1.23%
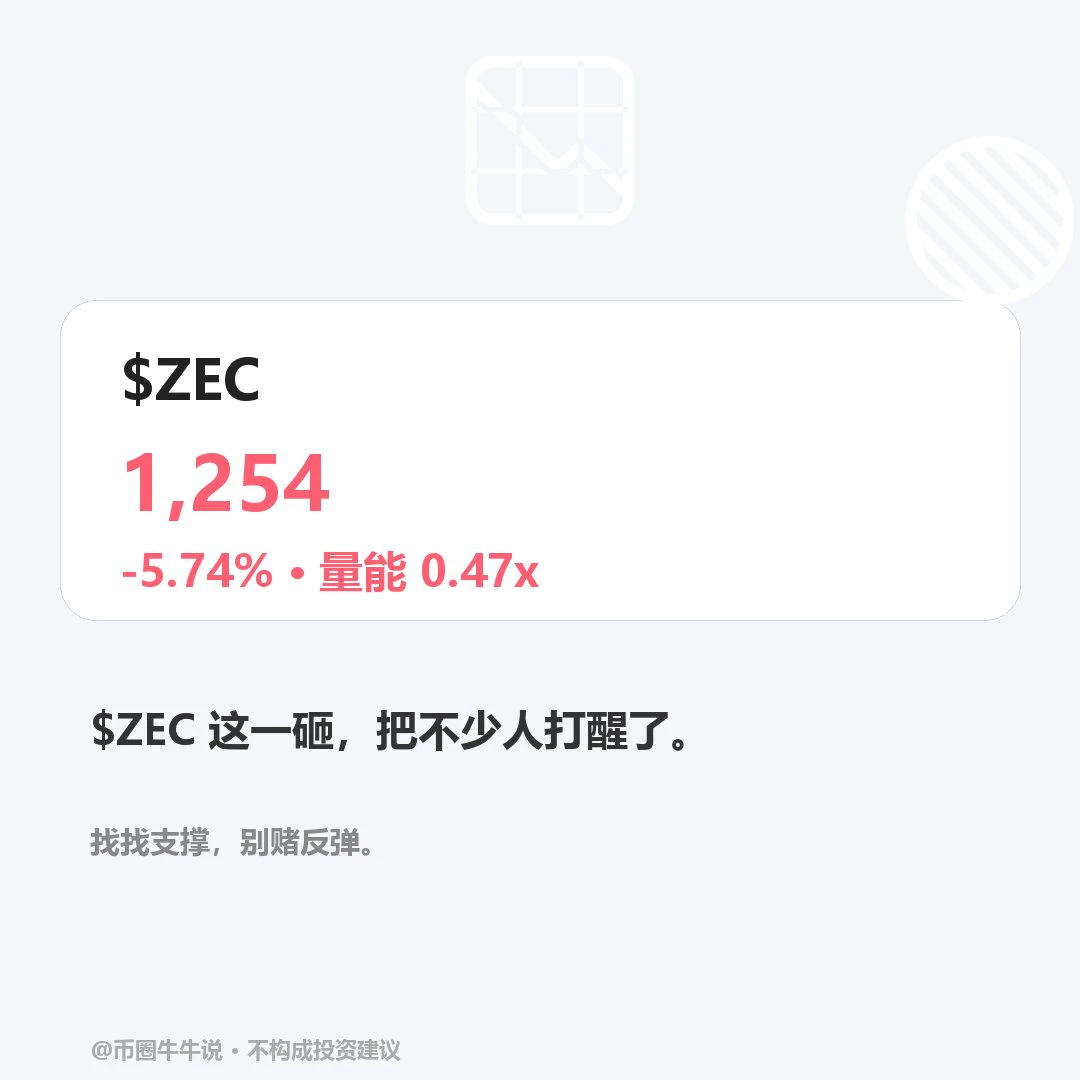
$ZEC Currently at 1254.35, down 5.74% over 24H (range: 1236.65–1364.08). The 1H trend is weak, with RSI at 17.73 (oversold), price below EMA20 at 1280.44, and a volume ratio of 0.47. The 4H trend is weak, with RSI at 53.02 and price below EMA20 at 1283.65. Conditions: Holding above the 1364.08 resistance could signal continuation; breaking below the 1236.65 support would weaken the structure. In the review, focus on whether price can hold above 1364.08 and whether it can reclaim 1236.65 after a breakdown. With volume at just 0.47x, a level break on low volume or a breakdown without a reclaim i
post-image
ZEC+1.16%
#CryptoMarketUnderPressure #ShareWeekly

Crypto Market Under Pressure: The Battle Between Sellers, Buyers, and Market Confidence

The cryptocurrency market is facing a challenging phase, with selling pressure spreading across Bitcoin, Ethereum, and major altcoins. The important question is not simply why prices are falling, but why buyers are struggling to defend important levels while sellers continue to dominate market activity. In my view, this weakness reflects a combination of profit-taking, declining confidence, leveraged liquidations, macroeconomic uncertainty, and cautious capital all
CryptoChampion
#CryptoMarketUnderPressure #ShareWeekly

Crypto Market Under Pressure: The Battle Between Sellers, Buyers, and Market Confidence

The cryptocurrency market is facing a challenging phase, with selling pressure spreading across Bitcoin, Ethereum, and major altcoins. The important question is not simply why prices are falling, but why buyers are struggling to defend important levels while sellers continue to dominate market activity. In my view, this weakness reflects a combination of profit-taking, declining confidence, leveraged liquidations, macroeconomic uncertainty, and cautious capital allocation.

1. Bitcoin Is Setting the Direction for the Entire Market

Bitcoin remains the leading indicator of overall crypto market sentiment. When BTC loses important support levels, traders usually become more defensive across the entire market.

Consider a scenario in which Bitcoin declines from $80,000 to $76,000, representing a 5% correction. Ethereum could experience a decline of approximately 6–8%, while smaller altcoins might lose 10–15%, depending on their liquidity and market demand.

This difference matters because altcoins generally have higher volatility. When Bitcoin weakens, investors often reduce exposure to smaller assets first and move toward more liquid cryptocurrencies or stablecoins.

2. Profit-Taking Is Increasing Available Supply

Another major factor is the willingness of investors to secure profits or reduce losses. Some long-term holders may decide that recent gains are sufficient, while short-term traders may close positions as soon as prices break important support zones.

This creates additional selling pressure in the spot market.

Selling does not necessarily mean that investors have lost confidence in cryptocurrency permanently. In many cases, it represents portfolio rebalancing and responsible risk management. However, when thousands of participants make similar decisions, their combined activity can overwhelm available buying demand.

3. Fear Is Changing Investor Behavior

Market psychology plays a major role during corrections. When prices are rising, investors are often comfortable buying dips. But when the market continues making lower highs and lower lows, confidence starts disappearing.

Fear and uncertainty can encourage traders to close positions earlier than planned. Meanwhile, potential buyers may postpone entries because they expect better prices.

Macroeconomic uncertainty, interest-rate expectations, regulatory developments, and unexpected economic data can make this situation worse.

The result is a market where sellers are active but buyers prefer to remain on the sidelines.

4. Leveraged Liquidations Can Accelerate the Decline

Leverage is another important reason why crypto corrections sometimes become unusually aggressive.

Traders using borrowed capital can face automatic liquidation when prices move against their positions. For example, if Bitcoin falls toward $76,000 and a large number of leveraged long positions have liquidation levels nearby, forced selling can accelerate the downward movement.

This creates a chain reaction:

- Bitcoin declines and leveraged positions become vulnerable.
- Exchanges automatically close positions that cannot maintain sufficient margin.
- Forced selling adds more pressure to the market.
- Additional support levels break, triggering further liquidations.

Open interest and funding rates are useful indicators for understanding this process. Falling open interest during a sharp correction can suggest that excessive leverage is being removed from the market.

5. Capital Is Becoming More Defensive

When uncertainty increases, investors frequently move capital away from volatile assets.

Some may prefer cash, stablecoins, government bonds, or gold instead of maintaining large cryptocurrency positions.

Stablecoin exchange reserves and inflows can help identify whether investors are preparing to enter the market or simply waiting for better conditions.

However, stablecoin inflows alone do not guarantee buying activity. Actual spot volume and sustained demand are also important.

6. Why Are Altcoins Falling Harder Than Bitcoin?

Altcoins generally have thinner liquidity and more concentrated trading activity than Bitcoin.

During periods of uncertainty, investors often sell smaller tokens first because they carry greater volatility and additional project-specific risks.

There are also other sources of supply, including token unlocks, early investor distributions, and miner selling in proof-of-work networks.

For example, if a token releases 5–10% of its circulating supply into an already weak market, that additional supply can create considerable pressure unless demand increases.

This explains why some altcoins experience much deeper corrections even when Bitcoin's decline appears relatively moderate.

7. What Could Bring Buyers Back?

A sustainable recovery requires more than one green candle.

I would watch several indicators:

- Bitcoin holding its important support zones instead of repeatedly breaking lower.
- Increasing spot buying volume and sustained demand.
- Selling volume declining while prices stabilize.
- Funding rates returning toward neutral levels.
- Open interest rebuilding gradually without excessive leverage.
- Exchange outflows and accumulation activity indicating stronger holding behavior.
- Bitcoin dominance stabilizing before broader altcoin participation improves.

These signals would provide stronger evidence that the market is recovering rather than experiencing another temporary bounce.

8. How Long Could This Weakness Continue?

There is no fixed timeline for a cryptocurrency market bottom. A correction can last several days or extend over multiple weeks, depending on liquidity, macroeconomic conditions, investor confidence, and demand.

If Bitcoin successfully establishes a base and buyers gradually absorb available supply, market conditions could improve.

However, if BTC continues making lower highs, spot demand remains weak, and altcoins repeatedly lose support, selling pressure could continue for longer.

That is why predicting an exact bottom is less useful than monitoring confirmed market behavior.

My Trading Perspective and Risk Management

In this environment, I prefer confirmation over aggressive predictions. I would avoid chasing sudden recoveries or opening oversized leveraged positions simply because prices appear cheaper.

My approach is to identify support and resistance, wait for a confirmed breakout and retest, and manage exposure according to the risk involved.

I consider 1–2% account risk per trade a more disciplined approach than risking a large portion of capital on a single market direction.

Dollar-cost averaging can also help investors spread entries over time, although it cannot eliminate downside risk.

Final Thoughts

The current crypto weakness is not the result of one single factor. Profit-taking, Bitcoin's direction, declining confidence, liquidations, defensive capital rotation, miner selling, and token unlocks can all contribute to the same negative cycle.

The key question is when genuine demand will return.

For now, I believe patience, liquidity management, and disciplined risk control are more important than trying to predict every short-term price movement. A stronger recovery will become more convincing when Bitcoin stabilizes, selling pressure declines, and spot buyers demonstrate consistent demand.

The next major opportunity may come not from guessing the bottom, but from recognizing the moment when market conditions genuinely begin to change.

This is my market perspective, not financial advice.

#WCTCS9 #weeklyshare @Gate_Square #GateSquareTradingChallenge
BTC-0.67%
ETH-1.26%
TOKEN-0.16%
XAUUSD-0.45%
  • 1
$XRP Has Already Seen Selling Pressure, but Whether Buyers Are Defending Support Remains to Be Confirmed

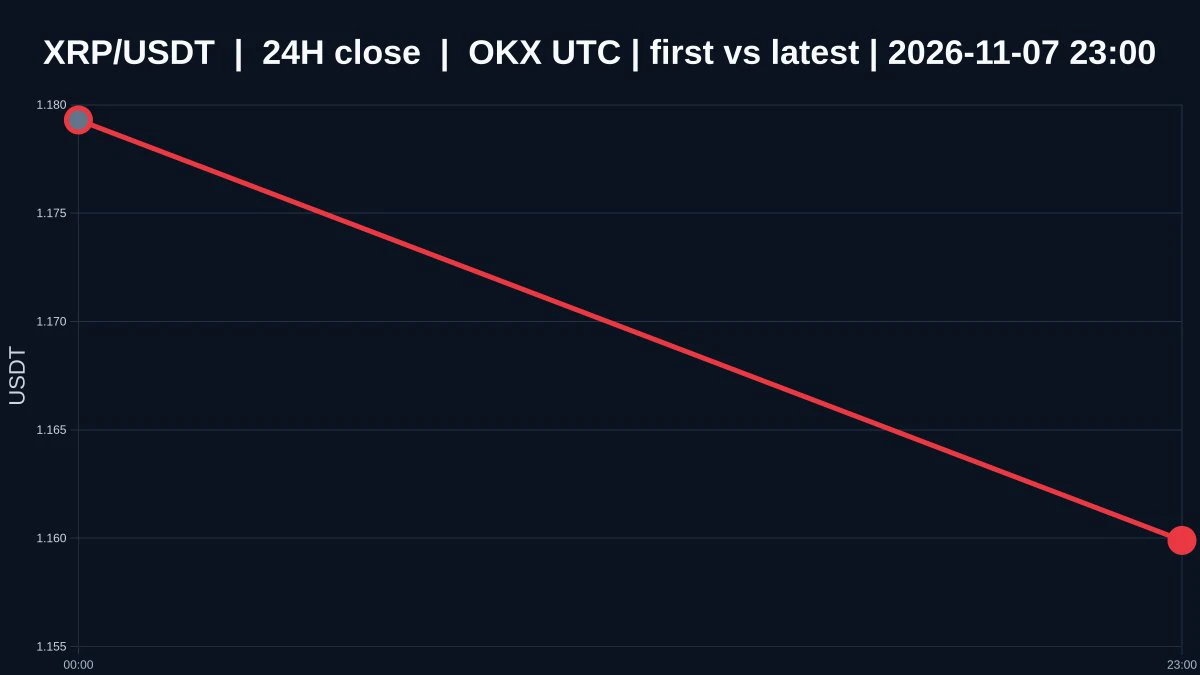
The fact that selling pressure has occurred does not automatically mean the price is cheap, much less prove that anyone is actually defending the area around 1.1495. $XRP is currently priced at 1.1597, down 1.4698385726423235% over 24 hours, with an intraday low of 1.1495 and a high of 1.1826. The 1-hour and 4-hour trends are both weak, and the volume ratio is 0.027431344101916215. Oversold describes a condition; a bottom is a confirmed outcome.

Reading oversold conditions as a bottom is
post-image
XRP-1.15%
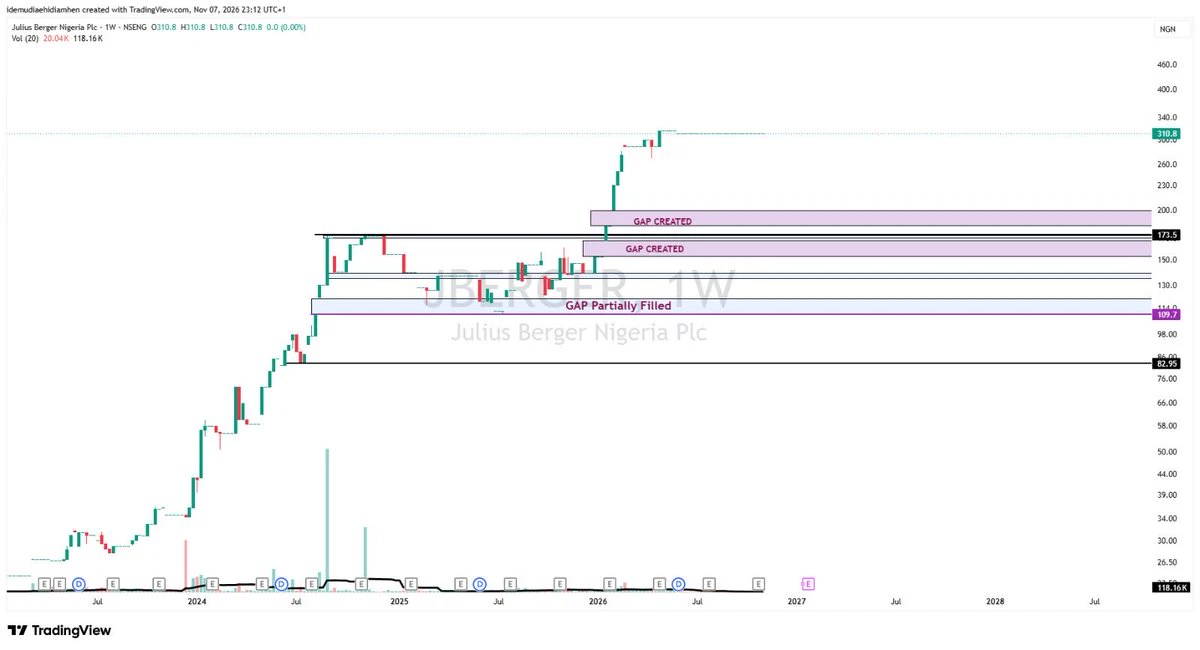
JBERGER
High time JBERGER undergoes some corrections.
Time to start paying attention to our former NAGASHEKU stock.
Hit an ATH of N315/share.
The only region I am watching is the gap of N183-N199.6 created in January 2026 which led to the ATH.
If I do not see that correction then I will not play this
#NFA
post-image
$Bull Is Coming, don't chase! There's nothing but traps beneath the 9.36% gain. The 24h trading volume of 10.7M looks lively, but the price surged from 0.0533 to 0.0607 and then dropped back to 0.0592—the upper wick makes it clear someone is dumping. On-chain, there are no new holder addresses backing it up; this is pure sentiment-driven trading, and chasing the high is just handing the market makers a knife. My rule: with coins like this, only trade pullbacks on the right side; scale in between 0.055 and 0.056, cut losses unconditionally if it breaks below 0.0533, and set the first take-profi
牛来-1.82%
$ONE Current price: 0.002112. The first resistance above is the upper Bollinger Band at 0.002408, and support below is MA20 at 0.002043. The Extreme Fear Index at 25, combined with a negative funding rate of -0.0018%, indicates crowded shorts, with conditions for a rebound building. The 24-hour surge of 25.94% and trading volume of 46.2M USDT reflect a genuine increase in volume. MA5 has crossed above MA20, RSI at 57.6 still has room to rise, and the slightly negative MACD histogram is merely a lagging signal. Amid broad market weakness, capital is rotating into highly volatile small caps, wi
post-image
ONE-1.19%
AAVE-1.22%
$ZEC ‌ Bearish. The price has the potential to weaken further toward the 1,245–1,236 range. The MA5 and MA10 are under pressure from the MA30, while the MACD remains in negative territory. Conclusion: The downward trend remains strong. A minor rebound is possible, but as long as the price fails to break above 1,280, bearish pressure will continue to dominate.

Note: Crypto and stock transactions carry the risk of loss. Please conduct your own research (DYOR) before trading. This information is for general purposes only and does not constitute a solicitation, recommendation, or investment advi
post-image
ZEC+1.29%
  • 1
Load More

Join 40 M users in our growing community

⚡️ Join 40 M users in the crypto craze discussion

💬 Engage with your favorite top creators

👍 See what interests you

Trending Topics

USAIStocksHitHard

21.64k Views3.68k Discussing

U.S. stocks sold off sharply on Thursday, November 5 (UTC). The Nasdaq closed down around 5.5%, entering correction territory, while the Philadelphia Semiconductor Index plunged roughly 12%, with chip stocks including $NVDA and $AMD posting steep losses. Beyond profit-taking, investors are growing concerned about the pace of AI data center construction, capital spending, and future returns on investment. The key question now is whether the AI sector’s lofty growth expectations need to be repriced. Where do you think the next opportunities will emerge: chip stocks, tech giants, or other sectors?

USNonfarmPayrolls

36.29k Views4.35k Discussing

StakeOnLaunchpoolToShare450KVLX

10.87k Views834 Discussing

View More