Share your thoughts
placeholder
Article
$SHROOM 🚀👀
post-image
$1000 to $100,000 Crypto Trade Challenge Today
live-cover
LIVE530
crypto market trend
live-cover
LIVE74
$PUMP I’m bullish. Whales’ long-to-short ratio is 2.59 times that of retail traders, and the gap is right there—the price is 0.00421, down 23% from the 90-day high, yet retail traders are still desperately piling into short positions while whales are taking the opposite side and going long. The $93.0M in futures open interest also shows that the positions haven’t dispersed; this isn’t an abandoned market. Over the next 24 hours, I expect a bullish, consolidating range with limited downside, looking more like a gradual grind designed to wear down retail shorts. The 2.59x gap is right there, and
post-image
PUMP-0.59%
Altcoins chart against Bitcoin 👇
'
The all-time high + major trendline has been broken, and it was retested with more than 13 candles.
We can say a 100%—600% season is coming, God willing 🟩🔥
post-image
$TSLA
It was rejected at its average around $376. It may look for a new bottom through grinding moves
post-image
TSLA-5.96%
I’m watching $AAVE for a short here.
AAVE got rejected hard from the $136 area, and the 1H chart is now printing lower highs while price keeps slipping below $131. Sellers still look in control unless that level gets reclaimed.
Entry: $129.70–$130.30
Targets:
TP1: $128.60
TP2: $127.90
TP3: $126.20
Stop: $131.30
For me, $131 is the key level. As long as AAVE stays below it, I’m looking for continuation lower. A clean reclaim above $131.3 would invalidate the short idea.
#Gate60MillionUsers #BTCReclaims80K
post-image
AAVE-2.17%
  • 3
  • 1
One is still underpriced.
post-image
$ETH Signal】1H momentum exhaustion, bearish continuation
$ETH 1H MACD histogram -7.17, RSI 43.38, price is moving along the lower edge of the Bollinger middle band, with volume shrinking to 28K. The 4H MACD bullish histogram is shortening, with insufficient buying support. Order book depth imbalance stands at -1.15%, with selling pressure dominant. Funding rate is 0.0021%, with no short-squeeze conditions.
🎯 Direction: Short
⚡ Entry/limit order: 2445.5513 - 2452.9100
🛑 Stop-loss: 2477.4391
🚀 Target 1: 2416.1163
🚀 Target 2: 2397.7195
🛡️Trade management:
- Execution strategy: After reach
post-image
ETH-1.71%
$MARSCOIN surged 69% in 24 hours but retreated after spiking to 0.2145, and is now moving sideways at 0.1950; the $830 million trading volume shows bulls and bears are taking money from each other's pockets. Those who are bullish believe that the Musk narrative plus a threefold surge on heavy bottom volume shows the major players have not left, making the pullback a chance to get in, with a stop-loss at 0.17 to bet on a second wave; those who are bearish believe that the hourly bearish divergence and turnover above 40% at the highs are distribution signals, while the 0.21 level has too much t
MARSCOIN+80.34%
After $DOGE , #SHIB , $PEPE
WHO IS NEXT #100x IN 2026???
post-image
DOGE-3.24%
SHIB-2.97%
PEPE-3.85%
IN+1.73%
With this trend, I don’t even need to think—the account is dancing on its own.
While everyone else was still watching from the sidelines, I kept my eye on those few rebounds. The volume didn’t follow, and the price stayed under pressure—clearly, there was no one willing to take it higher. I quietly entered a short at 0.3043, and it felt great. At the time, I even wondered if I was acting too soon, but the market immediately proved me right.
Now the price has slid to 0.2368, with returns at +435.46%. That was a satisfying bite of profit. The timing was right, and the wait was worth it. I’ve tak
post-image
BNB-0.60%
SNDK+11.60%
I wasn't even expecting to break even, but it actually pushed me into profit. This service is seriously on point. $BE While everyone was still waiting on the sidelines, I kept my eye on that range that was repeatedly oscillating intraday. The more it churned, the more I felt something was brewing.

Buying pressure was quietly building, with buyers stepping in every time it dipped. With a bottoming structure like this, I had to give it a shot. I opened a long at 200.9. The holding process wasn't exactly smooth, but as long as the trend remained intact, I held on.

Now that 267.7 has been reac
post-image
BE+13.30%
SOL-1.91%
SNDK+11.60%
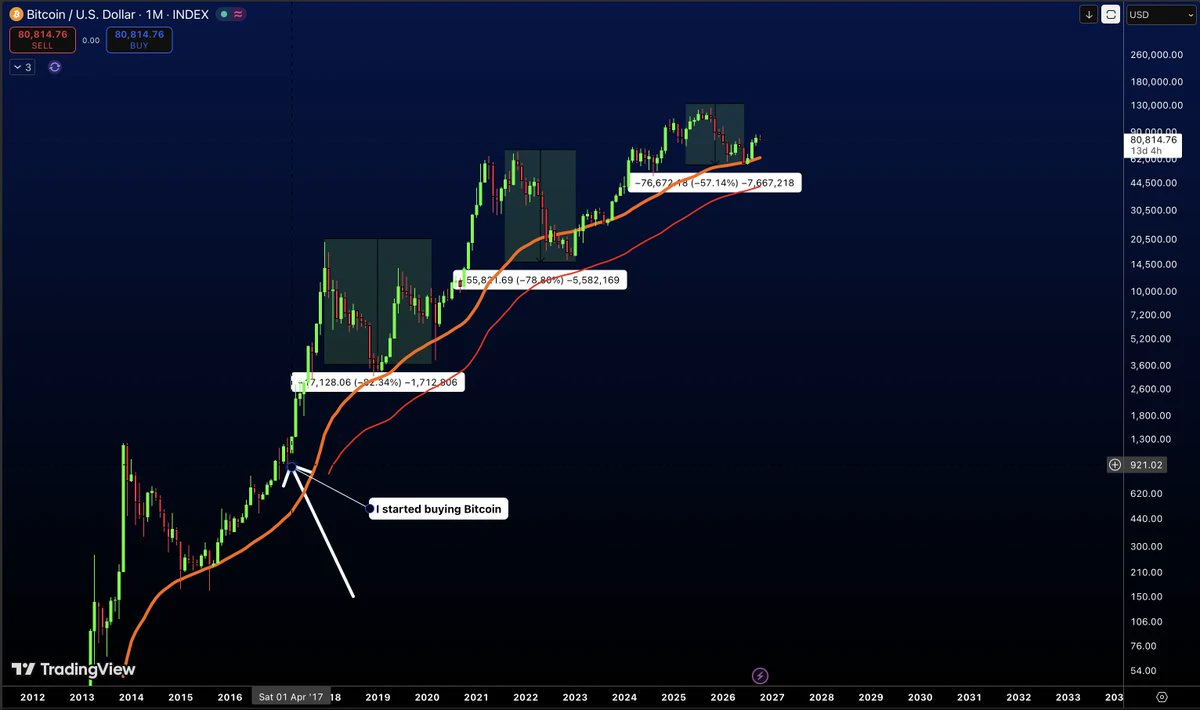
A deeper correction sub 58k would be a movie 🍿📺
$BTC
post-image
BTC-1.87%
  • 2
A few days ago, the hand that set the stop-loss trembled slightly. This morning, I realized that was unnecessary filial devotion.

A few days ago before bed, $LINK was still moving sideways at the bottom, testing my patience, but I took a look and saw it hadn’t broken down, so all was well. I entered at 9.352 then.

This morning, I saw 11.613, with a return of +1715.16%. Staying up wasn’t for nothing—I finally got a bite of this meat 😌. Managing risk in advance is called rationality; cutting after taking losses is called a heroic last stand.

Take 80% off the table first, and move the sto
post-image
LINK-1.54%
LAB+1.19%
ZEC+8.64%
Why is $CL /USDT quietly sliding while everyone watches the wrong timeframe?

$CL /USDT - SHORT

Trade Plan:
Entry: 90.61 – 90.95
SL: 92.37
TP1: 89.59
TP2: 88.79
TP3: 87.60

Why this setup?
- 4H bias flips SHORT with 55% confidence—not a screaming sell, but a tactical fade.
- Price sits at 90.78, hugging the 1H pivot; RSI 15m at 46.95 shows zero momentum to the upside.
- ATR 1H (0.66) confirms a tight coil—compression precedes expansion.
- Target ladder: 89.59 → 88.79 → 87.60. Invalidation only if 88.47 cracks (trend1D remains "range," so this is a scalp, not a trend trade).
**Why n
CL-0.73%
This trend is so obvious I don’t even need to think—the account is dancing on its own. While everyone was still watching from the sidelines, I already felt something was off. It had clearly moved sideways at the highs for so long, selling pressure kept building, yet trading volume kept shrinking. That wasn’t a good sign.

I saw it even more clearly as it formed a base intraday: insufficient support, with no one willing to buy on the way up. This kind of price-volume divergence couldn’t last long. So around 0.03576, I directly shared a short-selling idea, focusing on going with the trend.

No
post-image
SNDK+11.60%
ADA-4.40%
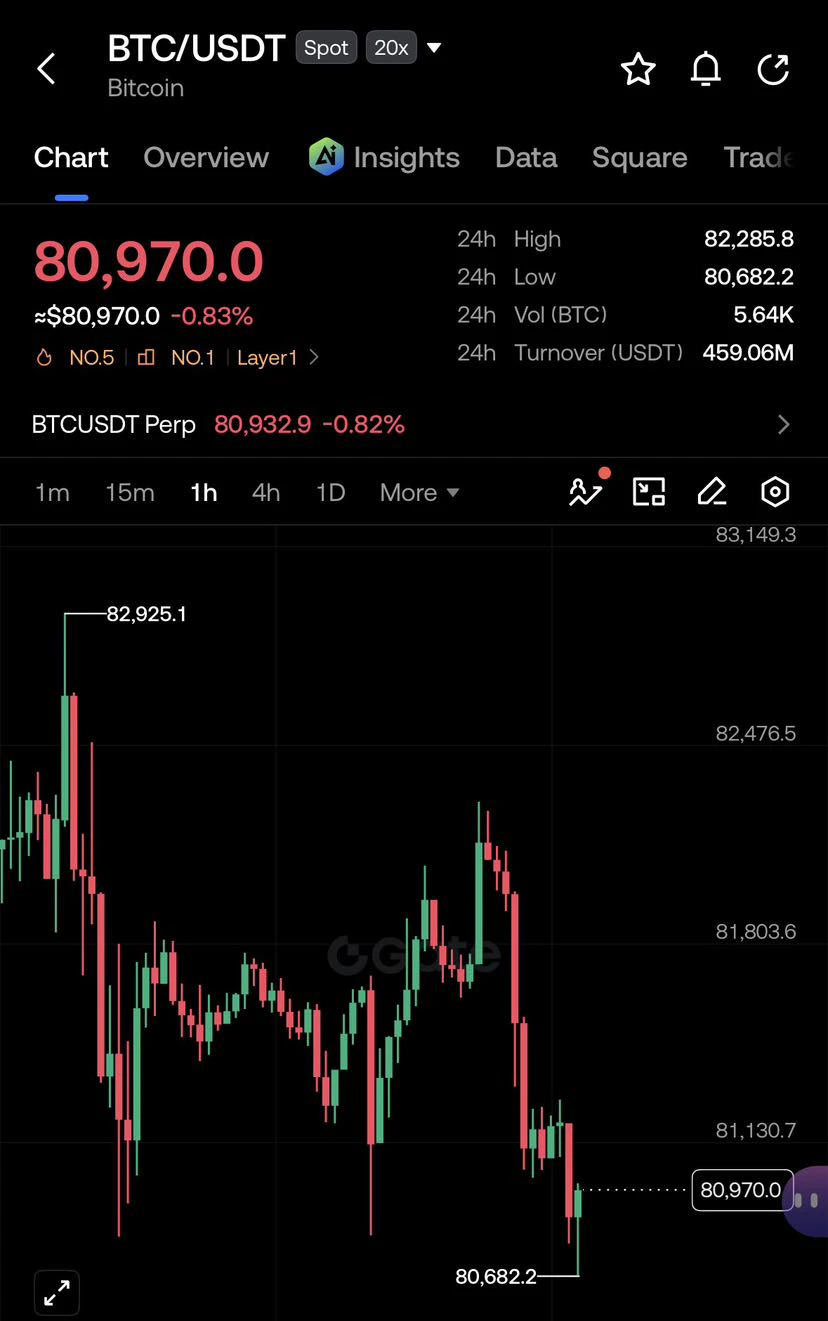
Everyone’s long BTC at 79.6K—but the 4h tape just whispered a different name.

$BTC /USDT - SHORT

Trade Plan:
Entry: 79535.51 – 79792.77
SL: 80898.98
TP1: 78738.01
TP2: 78120.59
TP3: 77194.46

Why this setup?
Why now? The 1D is rangebound, not trending—so this is a scalp, not a story. With RSI on the 15m at 48.67 (no momentum), and ATR at 514 showing tight squeeze potential, the path of least resistance is down to TP1 at 78,738. If that breaks, TP2 at 78,120 is a magnet. The invalidation at 78,954 is your line in the sand—if price reclaims it, the short thesis dies instantly.

Debate:
Are
BTC-1.84%
🚨 Catastrophic forecasts if they come true... Oil prices are on the list
The U.S. Treasury Secretary expects oil to fall to $40 🔥
The time for calm forecasts is over, and we have entered the language of burning numbers
Treasury Secretary Scott Bessent makes a seismic statement that hits the oil and bond markets at once:
• Oil target ..
A sharp plunge to $40 per barrel immediately after the conflict with Iran ends
• Bond earthquake ..
The frightening decline in oil will break U.S. Treasury yields, which are sitting at their highest levels in years
• The link to Trump ..
This statement complet
Load More

Join 40 M users in our growing community

⚡️ Join 40 M users in the crypto craze discussion

💬 Engage with your favorite top creators

👍 See what interests you

View More