





Square
Following
Hot
News
Notifications
Profile
Share your thoughts
placeholder
Article
BTC drops below $60K for first time in a while, altcoins plunge
Bitcoin has broken below $60,000 for the first time since early July.
Bitcoin continued to face heavy selling pressure and fell below the $60,000 mark for the first time since July. At the time of recording, BTC dropped approximately 3.08% to $59,610, breaking the key psychological level of $60,000.
⚠️ Personal market analysis only. NFA — manage risk and DYOR.
Educational content, not investment advice or a recommendation to buy, sell, deposit, or withdraw any asset. No paid promotion or referral/affiliate links.
post-image
BTC-0.67%
Give it to me straight, bro. Don’t say, “I’m not worried because I’m holding spot.” Are you actually freaking out right now? Don’t pretend to be calm—just be honest.
bitcoin:native
post-image
BTC-0.67%
Trenches
FIONA
F
bade
b
FIONA
B34n...pump
Market Cap
$.
Change
.
24h Vol
$.
Holders
.
PIEVERSE
P
bade
b
PIEVERSE
0x0e...25a9
Market Cap
$.
Change
.
24h Vol
$.
Holders
.
mihao
m
bade
b
mihao
4Cxj...pump
Market Cap
$.
Change
.
24h Vol
$.
Holders
.
CLAUDIA
C
bade
b
CLAUDIA
2j5S...W2ZM
Market Cap
$.
Change
.
24h Vol
$.
Holders
.
PROS
P
bade
b
PROS
0x8b...9832
Market Cap
$.
Change
.
24h Vol
$.
Holders
.
Openly short $ETH ‌
ETH-1.23%
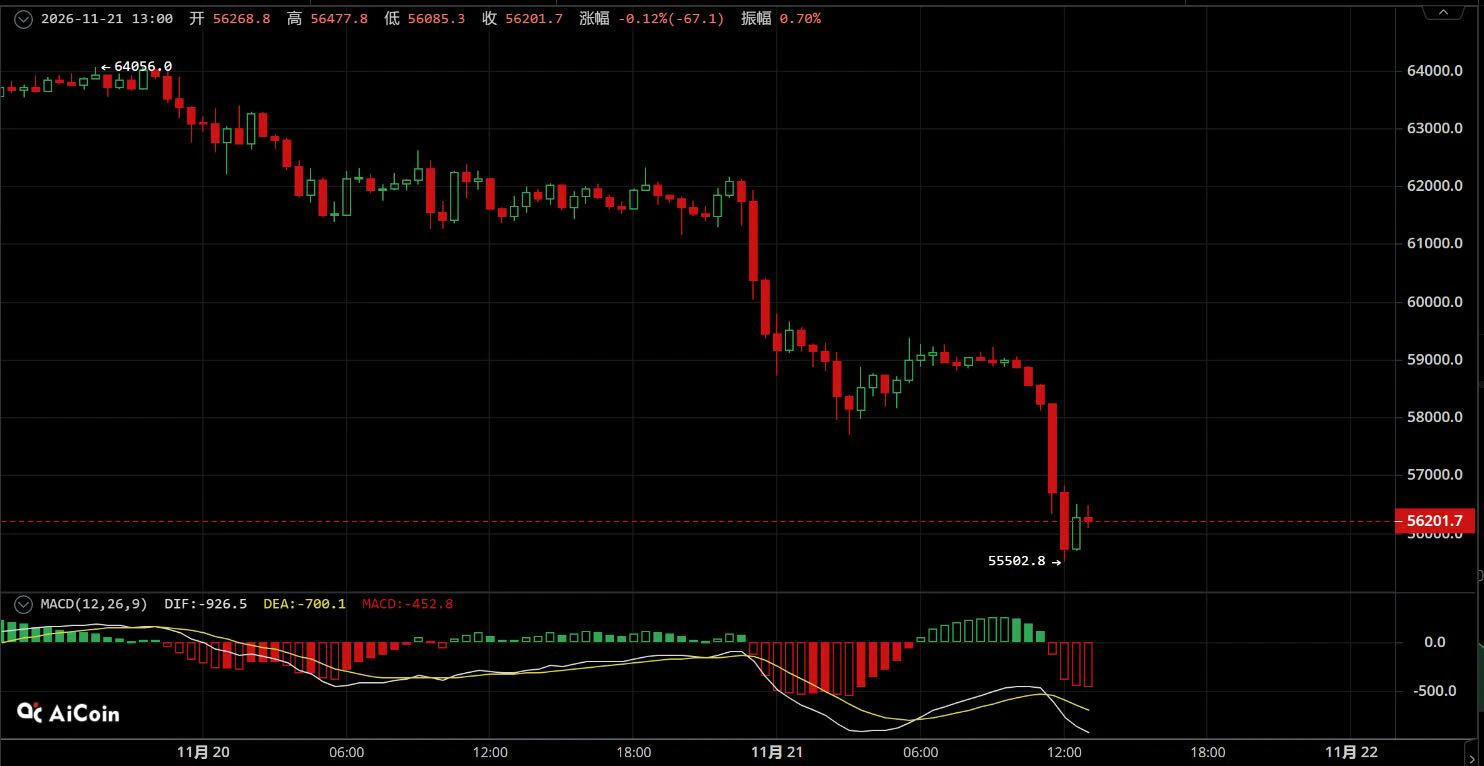
Nov 21 $BTC accelerated its plunge to set a new period low; short the rebound in line with the trend

【Trading Strategy】
Short entry range: Enter on a rebound to 56900-57300
Stop loss: Above 57800
Take-profit targets: First target 55600-55400, second target 55000-54700

【Core Logic】
On the 30-minute chart, two rounds of stair-step accelerated declines took price from a high of 64056 to a new period low of 55502.8. This was a concentrated wave of selling across the broader market, and the overall downtrend is now fully established.
The current move is merely a weak recovery after the sharp plun
post-image
BTC-0.67%
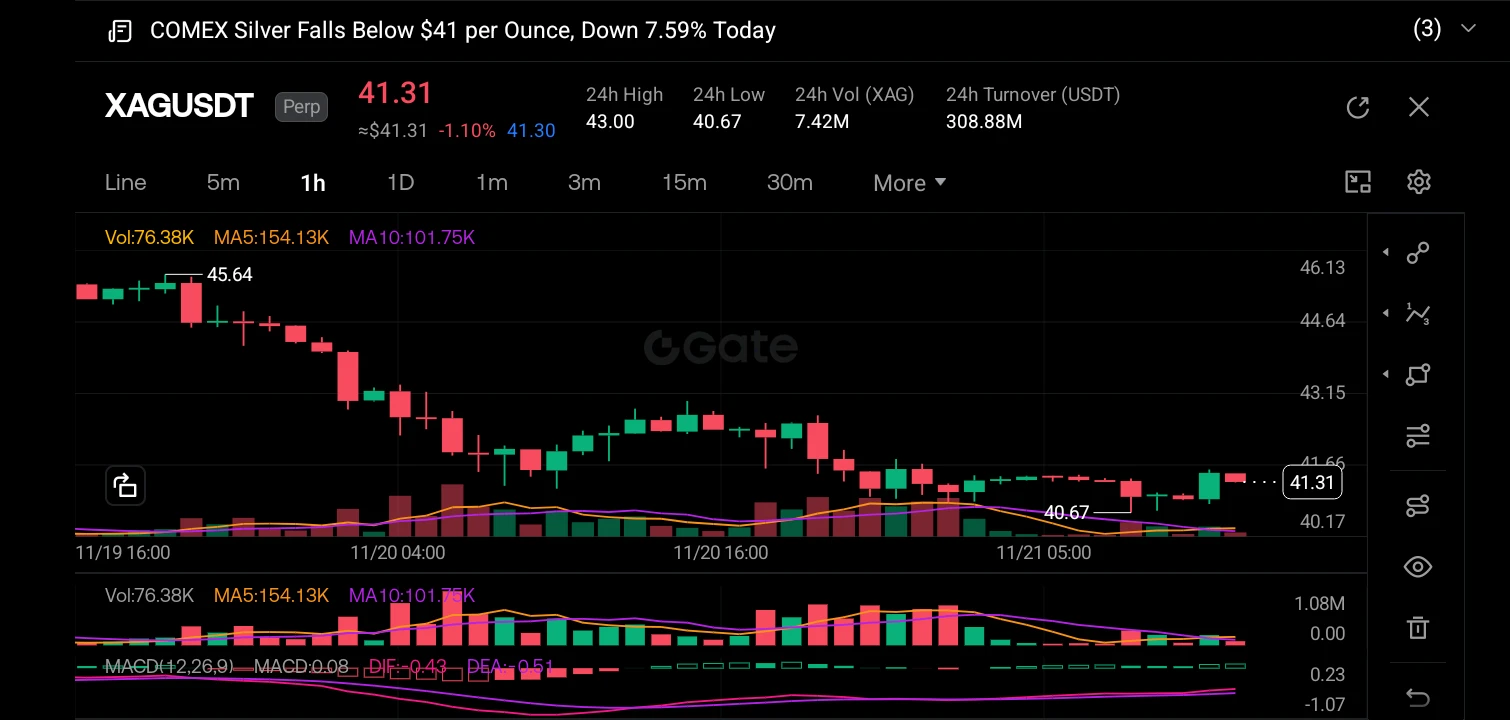
$XAGUSD ‌
A trading style blending technical analysis with on-chain data is particularly potent when observing whale accumulation. While technicals can show you when a price is consolidating, whale accumulation data tells you why it might soon break out. By tracking large wallet inflows and outflows alongside chart patterns (such as the current MACD convergence on the XAGUSDT chart), traders can distinguish between a retail-driven fake-out and institutional accumulation. This approach allows you to position early alongside "smart money" while using technical levels to define strict invalidati
post-image
XAGUSD-3.80%
  • 1
$VELVET Fully exited, buying the dip in Bitcoin and Ethereum
post-image
VELVET-3.58%
Ethereum continues to slide. Yesterday’s ETH short positions were closed for profit, and the downtrend is deepening. Be cautious about going long! $ETH
ETH-1.23%
market updates
live-cover
LIVE1,468
ADA-1.48%
SOL-0.77%
UNI+3.05%
LTC-0.07%
📉 BTC fell below $60,000—can it rebound this weekend?

On November 20, BTC briefly fell below $60,000, hitting its lowest level since July. Tech stocks also came under pressure, and selling sentiment continued to intensify.

The market had been discussing whether $60,000 could hold. Now the question is: after breaking below it, can BTC quickly reclaim that level? 👀

🔮 Weekend market predictions are live!

📈 Bullish camp: Quickly reclaim $60,000

📉 Bearish camp: Continue lower and search for new support

💬 Do you think BTC will reclaim $60,000 first, or fall further first?

Leave your pre
GateSquare
📉 BTC fell below $60,000—can it rebound this weekend?
On November 20, BTC briefly fell below $60,000, hitting its lowest level since July. Tech stocks also came under pressure, and selling sentiment continued to intensify.
The market had been discussing whether $60,000 could hold. Now the question is: after breaking below it, can BTC quickly reclaim that level? 👀
🔮 Weekend market predictions are live!
📈 Bullish camp: Quickly reclaim $60,000
📉 Bearish camp: Continue lower and search for new support
💬 Do you think BTC will reclaim $60,000 first, or fall further first?
Leave your prediction + a key price level in the comments, and we’ll review it together next week!
#BTC跌破6万美元关口

repost-content-media
BTC-0.67%
#BTCBreaksBelow60K #ShareWeekly #WCTCS9
Bitcoin Breaks Below $60K: Temporary Correction or a New Bearish Trend?

Bitcoin has lost the $60,000 level, one of the most watched psychological supports of this cycle. The latest snapshot showed BTC around $58,370, down about 5.7% over 24 hours. Traders are now reporting fills near $56,000, which is roughly 6.7% below $60,000 and about 4% below the snapshot price. Whichever print you use, the message is the same: the market has moved from defending $60,000 to testing what sits underneath it.

The 24-hour range shows how fast this happened. The high w
  • 1
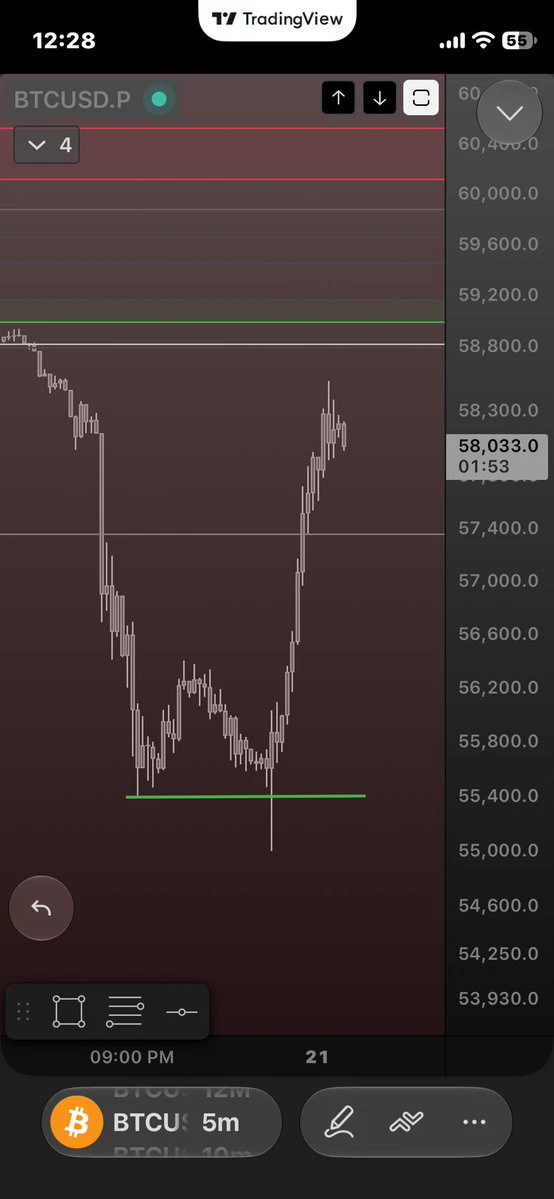
This wick fucked my perfect call 😂😭
Anyways we are back in the range as anticipated..powerful move
We want to hold the bottom of the range here at 57.3k
I shall sleep now
🥷🛌
post-image
#btc #BNB     #sol
They say you shouldn't hang yourself from a single tree... so I found 6 trees.

Wage slaves, an ant's lot[抠鼻]; this generation of people born in the 1980s has it so hard, with no policies or benefits at all... I've tied up all the hemp rope I could buy...
​
BTC-0.67%
BNB-0.76%
SOL-0.77%
Guys, the latest hit releases from newcomers
FC2-PPV-4587943
FC2-PPV-4825364
FC2-PPV-4121738
FC2-PPV-4733095
FC2-PPV-4741172
FC2-PPV-4595631
post-image
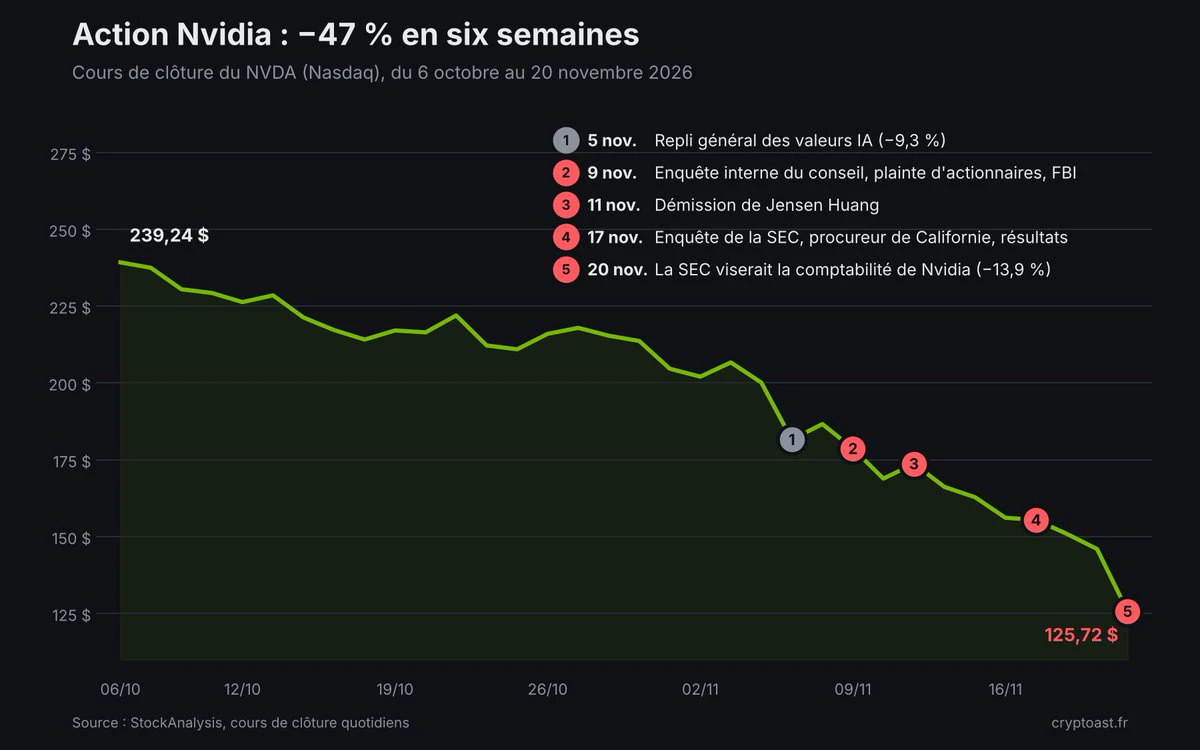
🚨 In just two weeks, Nvidia has found itself targeted by a series of investigations and proceedings:
🔹 The SEC is reportedly examining potential accounting issues
🔹 The FBI is interested in Jensen Huang's relationship with Alice Huang, a former Megaspeed executive suspected of spying for China
🔹 The Department of Justice is conducting a criminal investigation into Megaspeed, suspected of diverting Nvidia chips to China
🔹 Democratic lawmakers are seeking to determine whether Nvidia interfered in this investigation
🔹 A shareholder has filed a lawsuit, alleging that Nvidia concealed these t
post-image
NVDA-13.84%
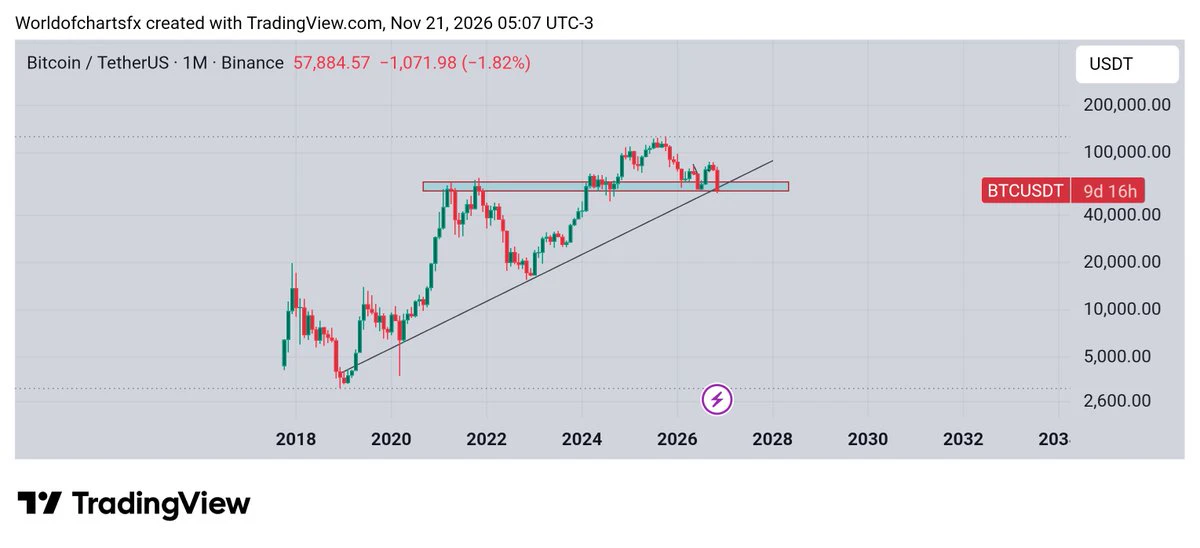
$BTC #Btc is currently testing a crucial support zone on the monthly timeframe, which also aligns with its long-term ascending trendline. This is an important area to watch closely. If BTC manages to hold this support and trendline, we could potentially see a strong recovery from these levels. However, a confirmed breakdown could open the door to further downside, potentially creating even better opportunities to accumulate Bitcoin at lower prices. For now, patience is key — let's wait and see how the monthly structure develops.
post-image
BTC-0.67%
Keith Alan warns Bitcoin moving average crossover signal may return
Bitcoin is showing two notable moving-average crosses that are drawing comparisons to a key period in 2023.
After a sharp drop from around $80,000 to near $61,000 in November, Bitcoin is forming a technical setup that reminds traders of late 2023.
⚠️ Personal market analysis only. NFA — manage risk and DYOR.
Educational content, not investment advice or a recommendation to buy, sell, deposit, or withdraw any asset. No paid promotion or referral/affiliate links.
post-image
BTC-0.67%
  • 1
B TC market up dates
live-cover
LIVE2,406
BTC-0.67%
ETH-1.26%
Very smart move by Hex team, showing the outcome while the model is downloading! 😂
post-image
Kongming - Spot Position · Bullish Signal
$ETH $BTC $SOL

I reviewed the cycle patterns over the next twelve years, and the current price is right at a key support zone. This is a major bottoming opportunity that comes once every four years—miss it, and you’ll have to wait another four years!!
90-day trading P&L +1,626.6+47.55%BTC-5.58%ETH-6.14%SOL-6.25%
Risk warning: The above reflects only my personal market views and does not constitute investment advice. The crypto market is highly volatile, so please be sure to manage your positions and control risk.
post-image
ETH-1.26%
BTC-0.67%
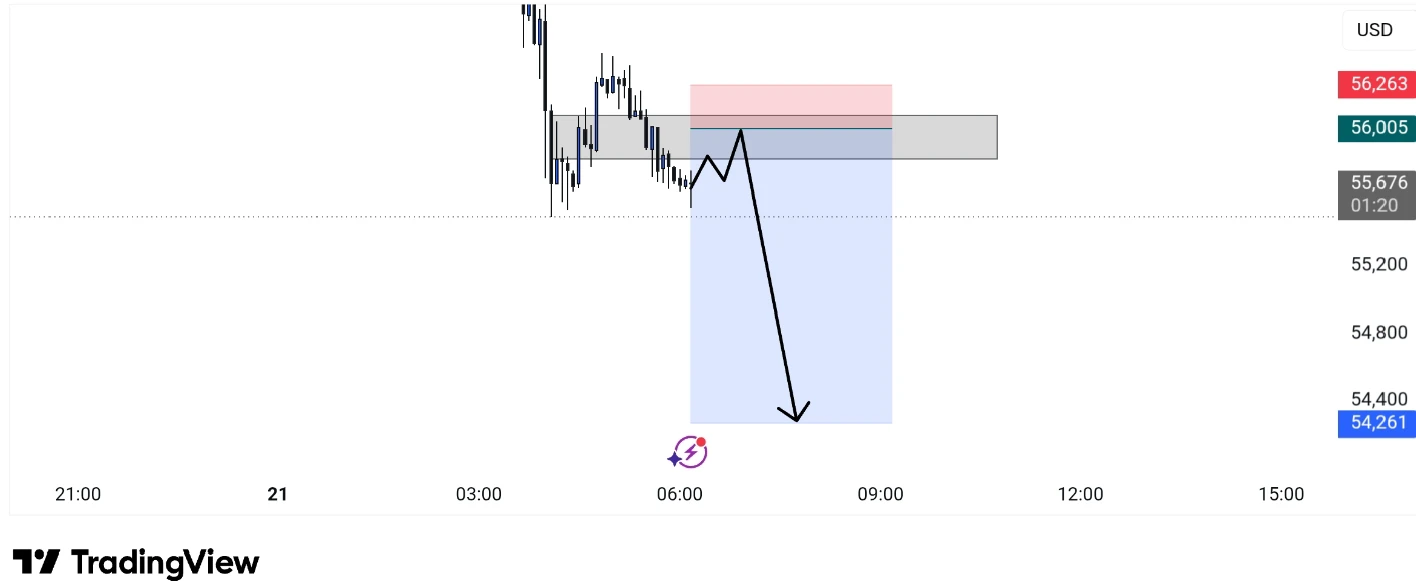
BTCUSD SELL SETUP | Bearish Continuation Watch

Bitcoin is facing selling pressure, and the current structure suggests a potential downside continuation if resistance holds.

BTCUSD — SELL / SHORT SETUP

Current Price: $55,676

* Entry Zone: $55,700 – $55,800

* TP1: $55,000

* TP2: $54,500

* TP3: $54,000

* Stop Loss: $56,300 – $56,400

### Technical Outlook | 5-Minute Chart

BTC is consolidating below a key supply zone following a strong bearish displacement. The current structure suggests that price may attempt a short-term pullback toward resistance before its next directional move.

I'm
post-image
BTC-0.65%
  • 1
Load More

Join 40 M users in our growing community

⚡️ Join 40 M users in the crypto craze discussion

💬 Engage with your favorite top creators

👍 See what interests you

Trending Topics

BTCBreaksBelow60K

2.1M Views29.2K Discussing

BTC fell below $60,000 on November 20 for the first time since July, alongside a tech stock selloff and broader pressure on risk assets. Will $60K become resistance, or can BTC quickly reclaim it? What price or volume signals would convince you that selling pressure is easing?

GateDirectIPOPhase3ANTAllocates92100Shares

739.5K Views4.8K Discussing

NvidiaDropsNearly14Percent

310.5K Views7.5K Discussing

View More