










Square
Following
Hot
News
Notifications
Profile
Share your thoughts
placeholder
Article
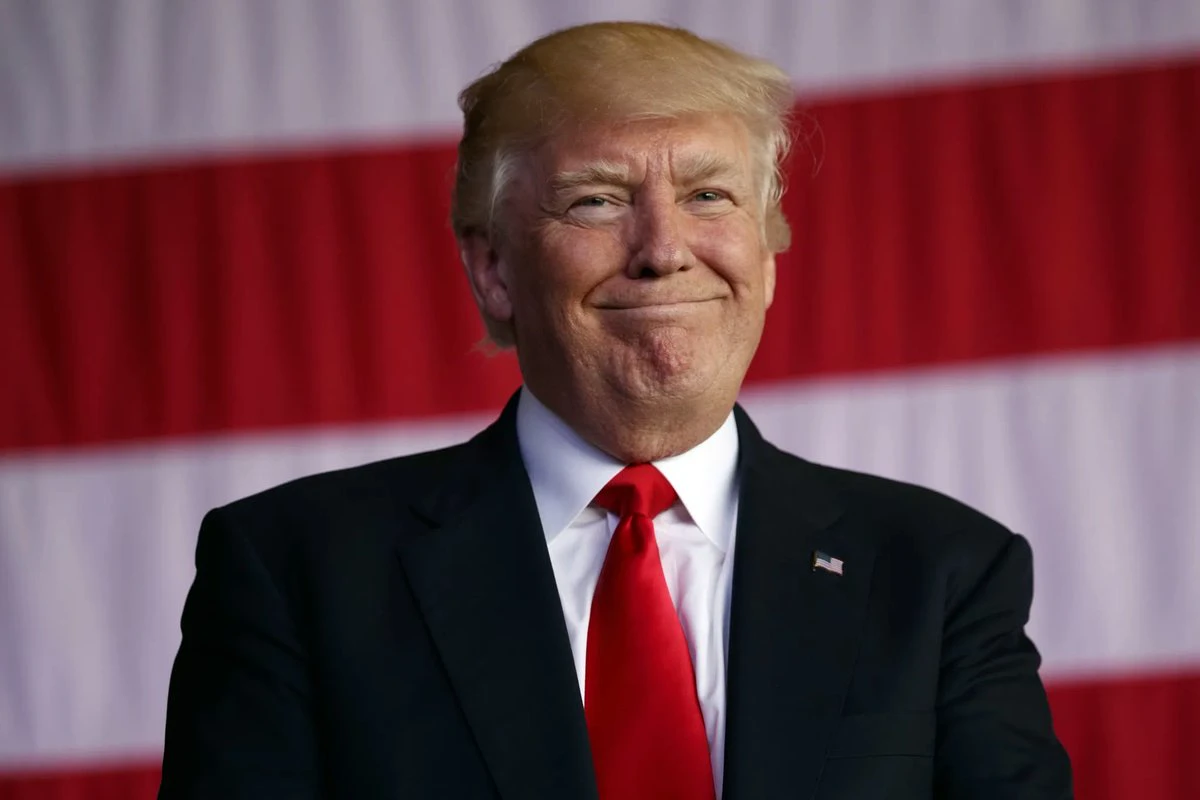
JUST IN: 🇺🇸 President Trump discloses 751 stock trades in September totaling up to $148,000,000
post-image
11.20 Qiqi on Gold Morning Analysis: The decline has extended again, and the rebound is facing clear resistance!

The downward trend continued in early trading, with gold prices falling steadily and consolidating near 3601. Prices dipped to an intraday low of 3590 as short-term bearish pressure continued to build.

External sentiment remains weak, and continued capital outflows are adding further pressure on prices. The brief halt in the decline is merely a slight pause; there is insufficient momentum for an upward recovery, so don’t rush to buy the dip.

Trading strategy: Resistance is in the
post-image
XAU+0.38%
Trenches
mihao
m
bade
b
mihao
4Cxj...pump
Market Cap
$.
Change
.
24h Vol
$.
Holders
.
PIEVERSE
P
bade
b
PIEVERSE
0x0e...25a9
Market Cap
$.
Change
.
24h Vol
$.
Holders
.
FIONA
F
bade
b
FIONA
B34n...pump
Market Cap
$.
Change
.
24h Vol
$.
Holders
.
PIPI
P
bade
b
PIPI
6MKD...pump
Market Cap
$.
Change
.
24h Vol
$.
Holders
.
CATMARIO
C
bade
b
CATMARIO
Cc5a...pump
Market Cap
$.
Change
.
24h Vol
$.
Holders
Proper and appropriate etiquette
post-image
Short from 2063 to 1758! This ETH trade has captured 305 points; next stop: 1600!

This ETH short was entered near 2063 and has now moved about 305 points, to around 1758.

I haven't rushed to exit, because the broader bearish outlook remains intact, and around 1600 is still a key target area I'm watching.

Why am I still bearish?

On the news front, the signals recently coming from the Federal Reserve have been hawkish. The meeting minutes show that officials remain concerned about inflation staying above expectations, and further rate hikes have not been ruled out.

This doesn't mean the Fed
BTC-0.65%
ETH-1.23%
$VELVET Hold on to the 1,000x coin, hold on to it—steady happiness.
VELVET-3.58%
i’ll leave this here
post-image
$GWEI - SHORTentry: 0.0138tp1: 0.0137tp2: 0.0135tp3: 0.0134stop: 0.0152GWEI's RSI at 43.2 suggests a mild bearish bias, with EMA20 below EMA50 indicating a potential downside move. MACD below its signal line points to bearish momentum, while RSI remains within neutral levels. Volume at 0.26x suggests lower than recent averages, highlighting a risk of further declines. These technical indicators suggest caution in a short position, though a solid reversal pattern is lacking.
post-image
GWEI+0.81%
This $HUMA short position didn’t work out. The stop-loss at 0.008945 was triggered after the price closed above the stop level. The reaction in that area was weak, and the price needed to move 4.55% to reach the first target. Before entering next time, wait for a reaction candlestick at that price level.

Trade results:
- The 0.008271–0.008359 range was filled immediately after the limit order was placed
- Most favorable move for us: 1.38% (TP1 required 4.55%)
- Stopped out at 0.008945 after about 5 hours and 15 minutes
- The price closed above the stop level; it wasn’t just a wick touching i
post-image
HUMA-1.99%
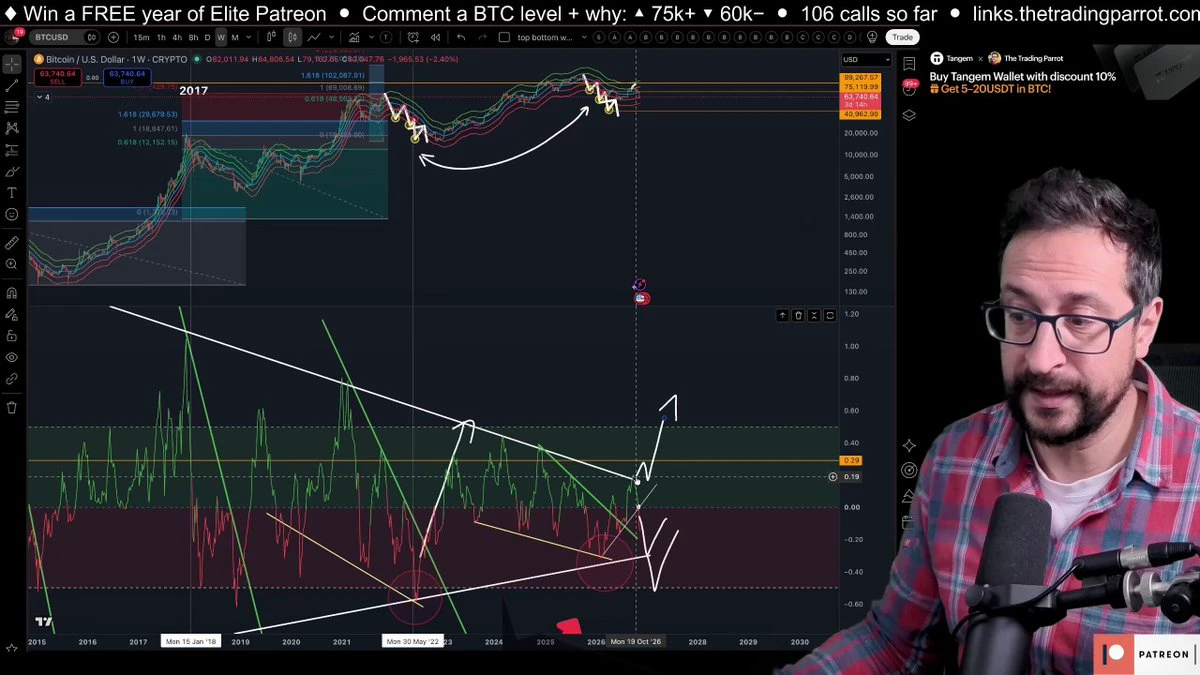
🎯 Mariano's 16-year-old volatility model just pointed at 54.4K — the level where long-term liquidations complete and where we met final support in 2022. But here's the caveat only hardcore followers remember: the model has been stretched lower before. At 12:39 in today's video
#Bitcoin #BTC #Crypto #TechnicalAnalysis #Volatility
post-image
BTC-0.67%
#TetherPushesBackOnSPRating
TETHER VS S&P GLOBAL: A MAJOR DEBATE OVER USDT RESERVES, FINANCIAL TRANSPARENCY AND STABLECOIN TRUST

The latest disagreement between Tether and S&P Global Ratings has created an important discussion across the cryptocurrency industry. The issue is not simply about a company receiving a weak assessment. It raises much bigger questions about stablecoin reserves, financial transparency, risk management, investor confidence and the future of digital dollars.

On November 18, 2026, S&P Global maintained its lowest stablecoin stability assessment for Tether's USDT at 5
  • 3
NVIDIAs profits are impressive, but its cash is under pressure?! | US Stock Market, Individual Stock
live-cover
LIVE1,727
BTC-0.67%
ETH-1.26%
SOL-0.77%
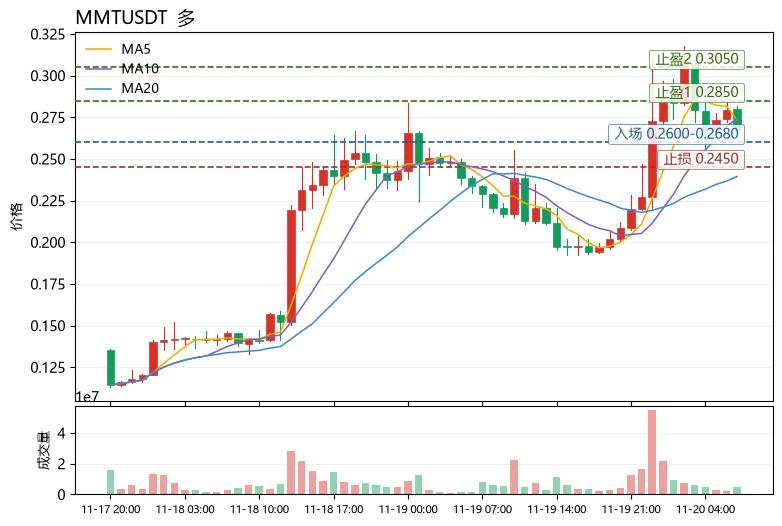
$MMT Current price 0.2673, 24h +16.12%, trading volume 56.7M USDT; MA5=0.27338 above MA20=0.23943, MACD histogram +0.00274 remains bullish, RSI 57.7 is neutral to strong, price is trading near the upper band within the Bollinger Bands [0.163509, 0.315351], funding rate +0.0024%, and the Fear & Greed Index is only 10 (extreme fear). The data speaks for itself, and the conclusion is clear: the bullish moving-average alignment and positive MACD histogram reinforce each other, making the short-term structure bullish. However, RSI has not broken 60, and the price is less than 0.05 from the upper B
post-image
MMT-2.35%
DOGE-0.22%
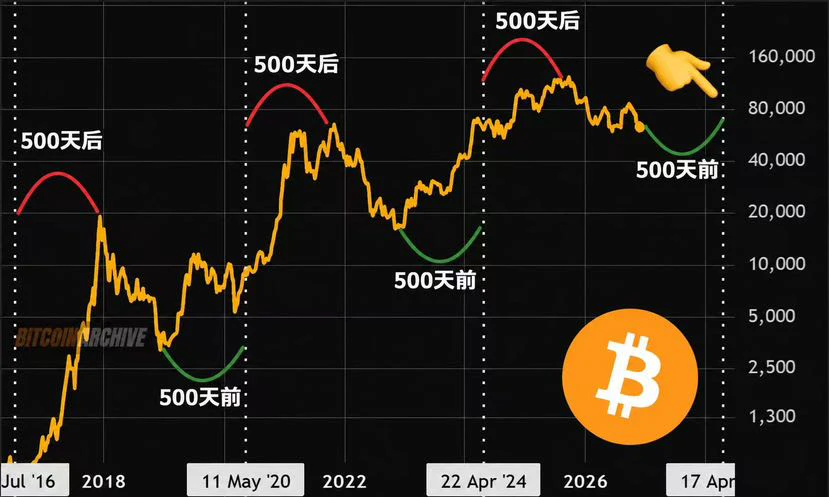
The crypto market’s most no-brainer Bitcoin cycle strategy:

500 days before the Bitcoin halving: Buy

500 days after the Bitcoin halving: Sell

Across the 2016, 2020, and 2024 cycles, the red arc sold the top and the green arc bought the bottom, almost perfectly.

A reminder: there are exactly ~510 days left until the 2028 $BTC halving 👀

The halving’s direct sell-pressure impact is indeed getting smaller, but it has long since become a consensus anchor for global capital.

Every time we reach 500 days before the halving, everyone is shouting, “This time is different”;

looking back, each t
post-image
BTC-0.67%
  • 1
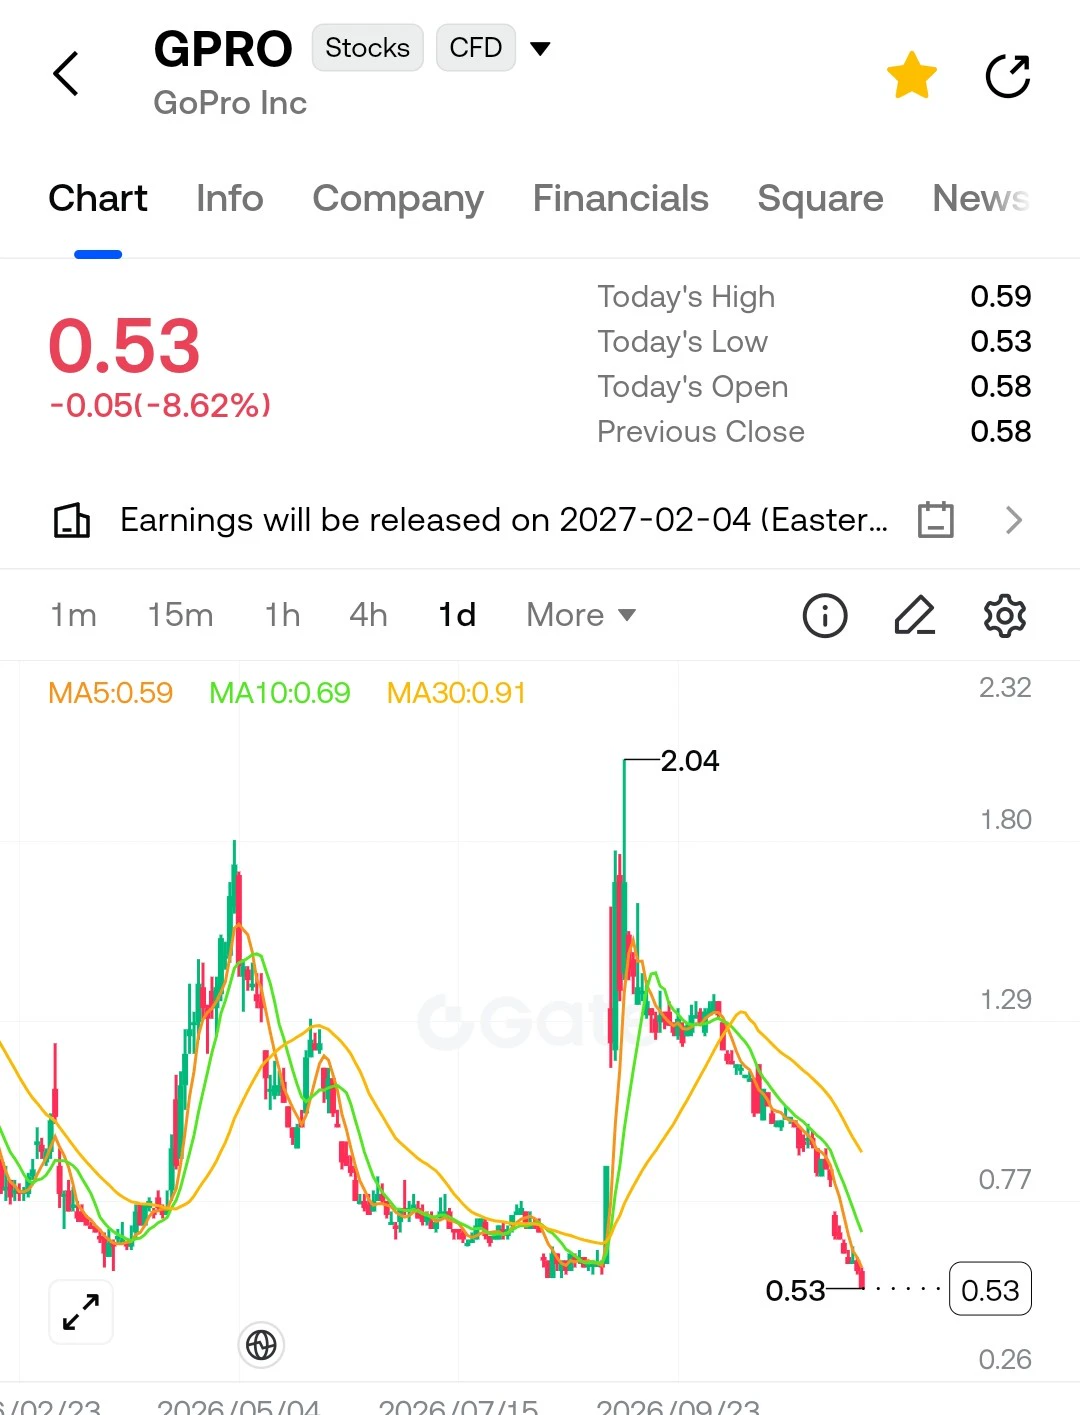
GoPro shares fell 8.62% during the day to $0.53. The daily high was $0.59, the low $0.53, and the opening price $0.58.

Moving averages—5-day ($0.59), 10-day ($0.69), and 30-day ($0.91)—all sit above the current price, indicating a downward trend in both the short and medium term. On the chart, the decline has been relentless since a sharp spike to $2.04 in September.

GoPro operates in the action camera and subscription business. Once the leader in this space, the company now generates revenue from both hardware sales and subscriptions. However, the market has shrunk, smartphone cameras have
post-image
GPRO-8.62%
  • 2
  • 2
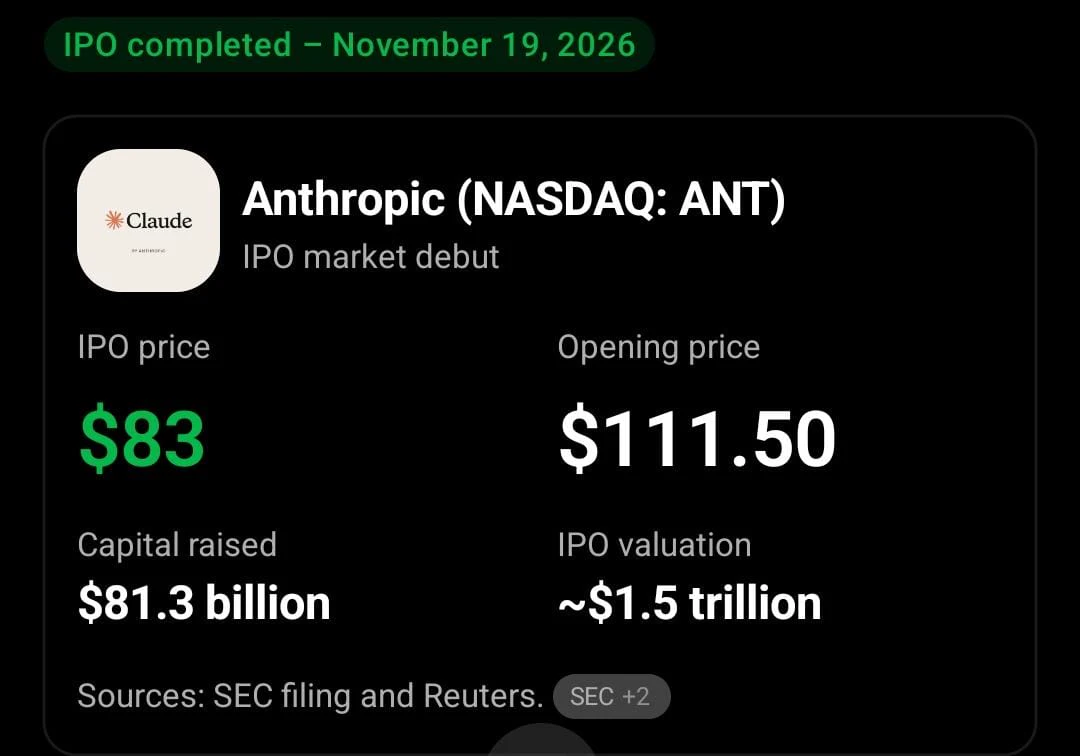
🚀 ANTHROPIC MAKES HISTORY WITH A MASSIVE $81.3 BILLION IPO!

Artificial intelligence is getting bigger, and Anthropic has just made a remarkable market debut!

$ANT opened trading on the Nasdaq at $111.50, compared with its IPO price of $83, delivering an impressive 34% opening premium.

📊 Key IPO Highlights:

- IPO Price: $83
- Opening Price: $111.50
- Capital Raised: $81.3 Billion
- IPO Valuation: Approximately $1.5 Trillion
- Listing Date: November 19, 2026

This historic debut reportedly surpasses SpaceX's previous IPO fundraising record.

The big question now is whether investor demand
post-image
ANT-13.13%
SPCX-3.69%
ZEC+1.29%
NAS100-0.30%
US30+0.00%
QQQ market update
live-cover
LIVE1,413
BTC-0.67%
XRP-1.15%
HYPE+0.24%
NEAR+1.17%
USDC+0.01%
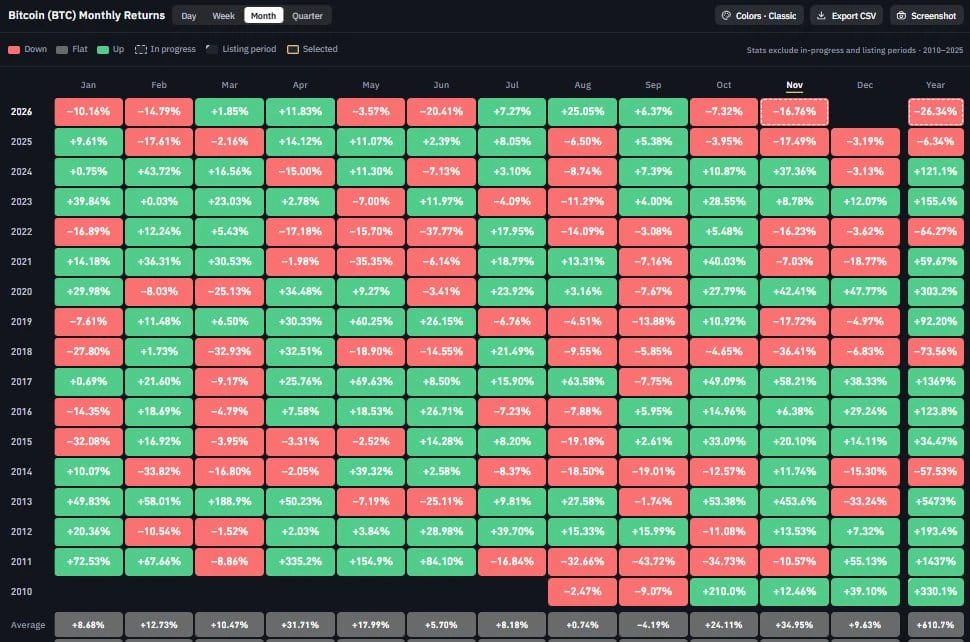
During the last 3 midterm years, $BTC saw a red December.

But since we've already dumped so much in Q4, I think we could finally break the curse this time!

$LAB
$NAORIS
$EVAA
$CAP
#ShareWeekly #FedMayNeedA50bpRateHike #AnthropicIPOPricesAt83 #MasayoshiSonRegretsMissingAnthropic #TetherPushesBackOnSPRating
post-image
BTC-0.65%
LAB-4.55%
NAORIS+0.80%
EVAA-0.42%
CAP+8.34%
Anthropic’s $1.5 trillion IPO put on two very different shows on day one
It opened at $111.5, surged to $115.1 intraday, and closed at $97.17. Same stock, same day: those allocated shares at $83 gained 17%, while those who chased at $111 lost 13%. The largest IPO in history put the divide on full display from day one.
First, the numbers: The offering price was $83, 6% above the $70–$78 range; 980 million shares were issued, raising $81.3 billion, plus $26 billion from a private placement, for a total of $107.3 billion—more than SpaceX’s $86.2 billion. The $1.5 trillion figure is the fully dilu
post-image
ANT+0.00%
  • 1
📅👑 NEW WEEK, NEW MEMECOIN BATTLE!
Which #Memecoin is ready to steal the spotlight and dominate the charts this week? 🚀🔥
👇 Drop your favourite $TICKER and tell us which one you're riding!
Let's see who takes the crown! 💎
#Crypto #Memecoins #BullRun
post-image
MEME-0.94%
Why does the Japanese economy matter to me?

A "carry trade" involves borrowing money at a low interest rate to invest in higher-yielding assets. For years, interest rates in Japan were effectively zero. Investors would borrow in yen and use those funds to purchase assets like dollars, stocks, or cryptocurrencies, profiting from the interest rate differential.

This strategy worked for everyone. As long as the yen remained cheap, these positions continued to grow. However, there is a catch: if the yen appreciates, the cost of the debt rises. When debt becomes more expensive, everyone rushes to
post-image
User_any
Inflation in Japan accelerates once again
Core inflation in Japan reached 2.2% in October—up from 2.1% in September and 1.7% in August. In other words, the trend is once again pointing upward.
While the figure fell slightly short of the 2.3% expectation, this offers little relief; inflation has now remained above the central bank’s 2% target for the second consecutive month. A single month might be a coincidence, but two months in a row indicate a clear trend.
Core inflation excludes fresh food prices, which can fluctuate wildly from week to week depending on weather conditions. Removing them provides a much clearer picture of the underlying price trend.
This metric includes petroleum products, meaning that increases in energy and food costs are reflected in the figure—precisely the areas where ordinary citizens feel the pinch most acutely.
Why does this matter? An interest rate decision is on the horizon.
The Bank of Japan is set to meet in December, with proceedings concluding on the 18th. The market anticipates that the bank will raise interest rates from 1.25% to 1.50%.
This latest data has bolstered that expectation. Having noted last month that inflation had reached its 2% target, the bank now faces an even stronger case for a rate hike. The question for the bank is no longer whether inflation exists, but rather how quickly it should act.
Is this solely a Japanese issue?
No. For many years, Japan grappled with deflation—a persistent decline in prices. Now, prices are rising, which, for Japan, represents a return to normalcy.
Yet, it is also a matter of global significance. If Japan raises interest rates, those who have borrowed in cheap yen to invest in other assets will face difficulties—a strategy known as the "carry trade." As interest rates rise, this strategy becomes more costly, prompting some investors to close their positions. This could trigger volatility across the US dollar, stock markets, and cryptocurrencies.
While the figure may be 2.2%, its impact is far greater, as energy and food are expenses everyone incurs daily. If the cost of groceries rises while wages remain stagnant, purchasing power inevitably declines.
This is why wage growth in Japan is being closely monitored. If wages do not keep pace with rising prices, the public’s disposable income shrinks; conversely, if wages rise, inflation could become entrenched. The central bank is focused precisely on this balance.
In practical terms, mark your calendar for December: Japan’s interest rate decision on December 18th will be significant—not just for the yen, but for global liquidity as well.
This data point alone is not a definitive reason to buy or sell, but it does signal a shift in direction. Japan is moving away from being a low-interest-rate economy. This transition is gradual yet permanent; the market will not price it in overnight, but rather over the coming months. Therefore, this development should be viewed not as a one-day data point, but as a turning point.
This content is for informational purposes only and does not constitute investment advice.
$USDJPY $EURJPY $Japan Tobacco $Toyota Motor $Kioxia Holdings

repost-content-media
BTC-0.67%
GT-2.41%
ETH-1.26%
XAU+0.38%
NAS100-0.30%
  • 2
Load More

Join 40 M users in our growing community

⚡️ Join 40 M users in the crypto craze discussion

💬 Engage with your favorite top creators

👍 See what interests you

Trending Topics

GateLeadsRWAPerpExpansion

458.3K Views3.7K Discussing

Glassnode’s latest The Week On-chain report shows that Gate expanded its RWA perpetual listings from around 20 at the start of the year to 490 today, moving from 5th to 2nd by listing count — the biggest climb among tracked exchanges this year. Gate’s RWA perp open interest has also grown to around $2.1B, more than 20x its January level, ranking third globally behind Binance and Hyperliquid. From stocks and ETFs to indices, commodities and FX, RWA perpetuals are bringing more traditional assets into crypto trading. Which traditional assets would you most like to see Gate list next? [👉 Full Report](https://research.glassnode.com/the-week-onchain-week-46-2026/)

FedMayNeedA50bpRateHike

403.6K Views2.7K Discussing

ThreeLaunchpoolProjectsNowLive

989.1K Views35.4K Discussing

View More