Share your thoughts
placeholder
Article
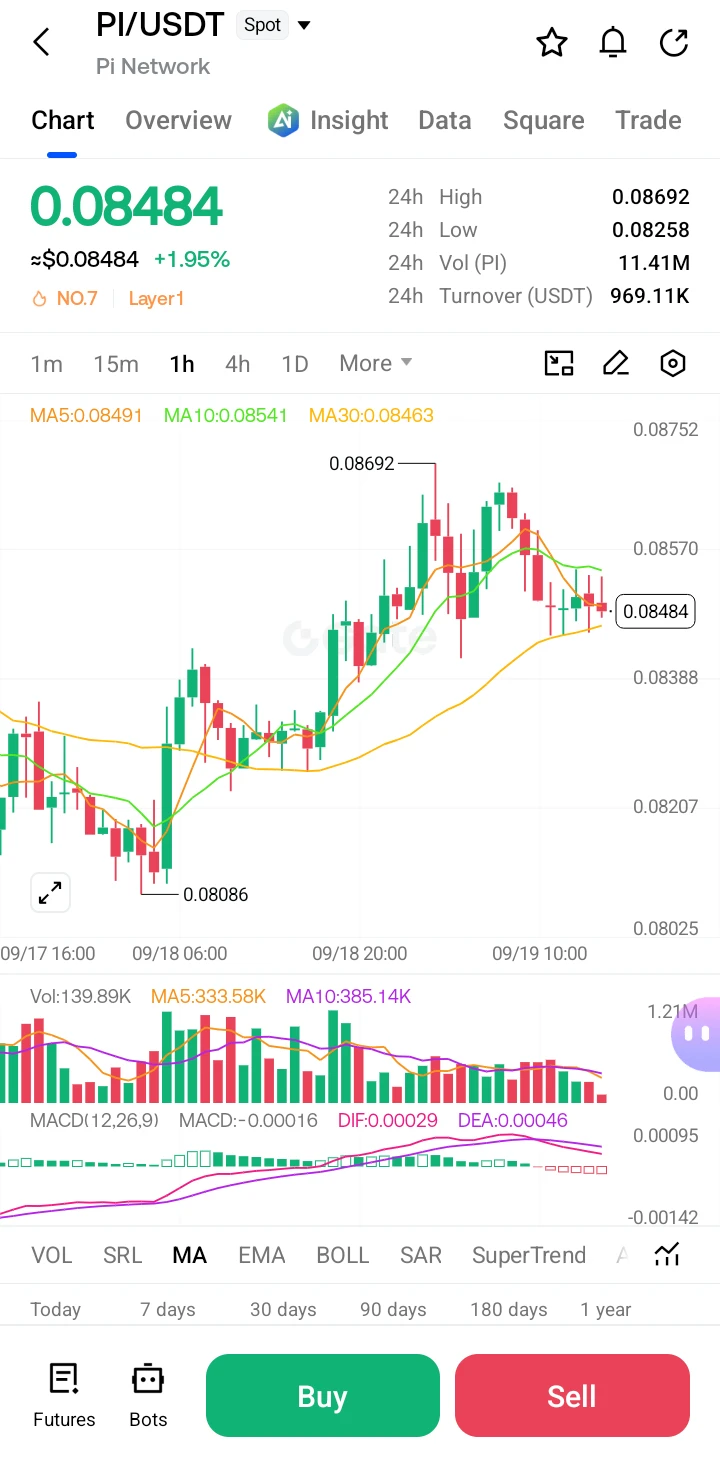
The #Pi in your hands is by no means a simple string of numbers; it is the key to a future digital kingdom and an entirely new ecological city. In the grand blueprint of #PiNetwork , every Pi is a cornerstone for building the digital civilization of the future.
Looking ahead, Pi Network is accelerating its transformation from “mining for everyone” into an “inclusive Web3 financial ecosystem.” On the technical front, the protocol will continue to upgrade, fully enabling smart contracts, cross-chain interoperability, and quantum-resistant encryption to build efficient and secure underlying bloc
post-image
PI-1.63%
  • 7
$ZEC Signal】Go long · Enter long on a pullback to the 1H Bollinger middle band
$ZEC The 1H surged before pulling back, with the current price at 1201.44, just above the 1H Bollinger middle band at 1193.50. The latest 1H MACD histogram is -2.77, with red bars expanding; the 4H MACD histogram is +14.79, with bullish momentum contracting. RSI is 60.74 on the 1H and 75.92 on the 4H. The order book depth Bid/Ask Ratio is 3.57, with thick bids below. The latest candlestick's active buy/sell ratio is 0.43. The funding rate is 0.0037%, and the OI trend is stable. The current price is near the upper b
post-image
ZEC+10.71%
BTC-0.12%
ETH-0.14%
SOL+1.10%
The final nail in the coffin for the bears is coming.
The weekly Supertrend just flipped bullish.
This is something that only ever happens within HTF trend changes.
It's never printed a false signal.
Every time it has flipped bullish after a bear cycle, the bottom has been in and Bitcoin has gone to enter, at minimum, months of upwards price action.
This doesn't mean we won't get a retrace at this point, i do believe we will chop around the 50SMA, which is yet to be taken.
But this is a massive signal to market participants that the Bitcoin trend has changed.
post-image
BTC-0.12%
I wasn’t even expecting to break even, but it directly put me in profit—the service is seriously on point. 🙌 While everyone was still watching from the sidelines, $LITE had already been repeatedly testing the bottom around 857.84. The key level held, and buying pressure was visibly strengthening. I knew this move was going to offer an opportunity. I decisively opened a long position and followed the rhythm without panicking. Now it has surged to 883.34, with +72.94% in the bag. I can finally treat myself to a good meal—the market is picking up the tab. 🍜 Don’t be greedy when trading: take pr
post-image
LITE+0.37%
SOL+1.10%
BNB-2.46%
btc upeate
live-cover
LIVE1,037
Today is Monday, September 7, 2026. ETH remains in a wide-ranging consolidation this week, currently in the 2350–2550 range. For now, focus mainly on shorting: place short orders around 2550 and take profit around 2450.
post-image
ETH-0.15%
BREAKING: Solana hype rally surges as ZCAT and STONK spike to fresh highs—ZCAT flirting with $170M cap, STONK up ~239% in 24h, now ~$145M. Watch for sentiment-driven moves and potential pullbacks in meme plays. $ZCAT $STONK
post-image
SOL+1.10%
MEME-3.20%
#晒出我的持仓收益 Short BTC and ETH at current prices; watch around 778 and 2435, with second targets of 755 and 2395.
post-image
BTC-0.11%
ETH-0.15%
Strong recovery vibes surround $XYO after its powerful rebound from recent lows. Buyers are returning with confidence, momentum is rebuilding quickly, and the gaming narrative is gaining serious energy. Strength led by $IMX could provide the fuel needed to keep this recovery moving.
post-image
XYO+0.25%
IMX-1.01%
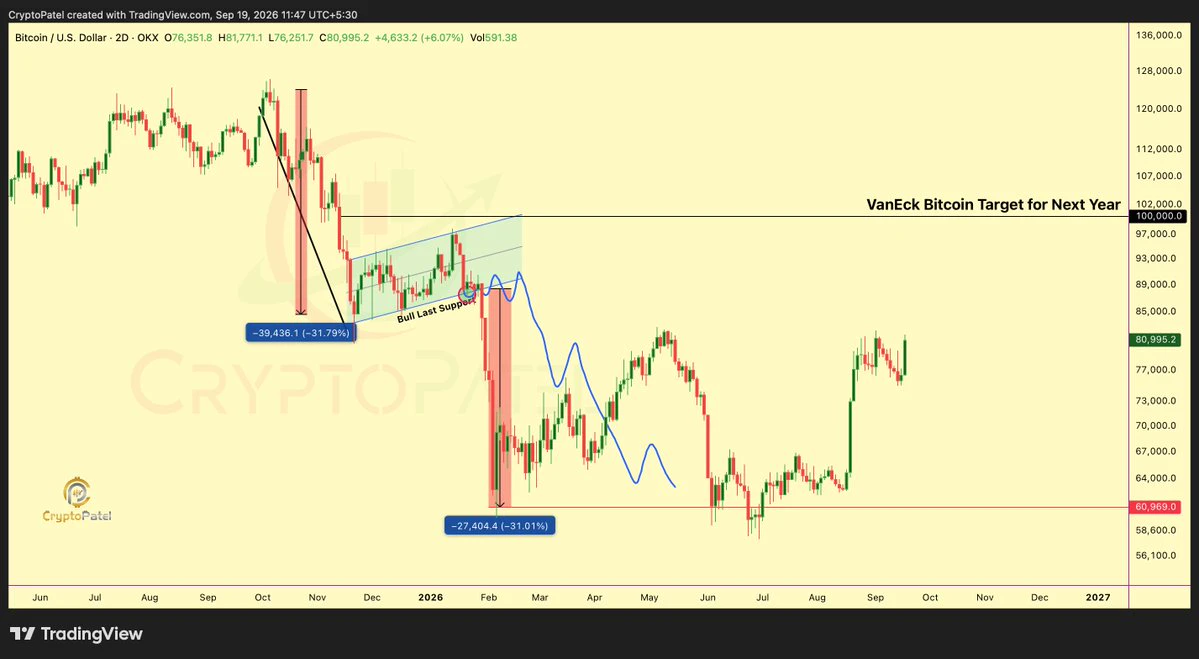
#BTCReclaims80K
Bitcoin is back above $80,000, and this move is about more than a simple number on the chart.
After facing heavy selling pressure and spending time below the psychological $80K level, BTC has once again shown why it remains the leading asset in the crypto market.
The recovery above $80,000 has brought fresh attention from traders, investors, institutions, and the wider crypto community. Recent market data also showed strong U.S. spot Bitcoin ETF inflows, with roughly $730.9 million entering the products in a single day, the strongest daily inflow since January.
But the most im
BTC-0.12%
ETH-0.14%
9.7 ETH long around 2480, defense at 2460, targets 2560/2620
ETH has continued to hold above 2500 after a 1H pullback, with the current price at 2500.
Short-term moving averages are providing support, and the bullish structure remains intact. However, 2500-2550 is a previous area of concentrated resistance, so buying after a confirmed pullback is more stable than chasing the price higher.
On the news front, this week’s PPI, CPI, and FOMC meetings are approaching. The long-term US Treasury yield reaching a high of 5.25% has put the market on high alert.
However, funds continue to flow i
JUST IN: Moore Threads (A-shares) drops 20% to new post-listing low as market cap falls below 200B yuan. No crypto tie-in here; factor into risk sentiment for tech equities and broader liquidity cues. $MOORE
post-image
#SNDK just gave the market a reminder of why this stock cannot be treated like a normal semiconductor name.
It jumped roughly 11.9% in the latest session to $1,740, while trading volume reached about 16.56M shares, comfortably above its reported average of roughly 11.83M.
The move is impressive.
But after a rally this large, the next question isn't whether buyers are strong.
It's whether they can defend the breakout.
The Move Behind the Move
SanDisk has been riding two powerful themes at the same time: a tightening NAND market and rapidly increasing storage demand from AI infrastructure.
The f
SNDK+11.88%
  • 6
  • 3
Layout for Bitcoin, Ethereum, and Dogecoin
live-cover
LIVE3,822
  • 1
#晒出我的持仓收益 Short at the current price, first look around 1080, 1020, 960, 840, and 670.
post-image
9.7 Su Wan Gold Morning Outlook
Overall, last week saw high-level choppy consolidation after a sharp rise, with rallies followed by pullbacks and repeated back-and-forth moves, without establishing a clear one-way trend. This morning, the market continued its mild corrective pace, with the overall pattern remaining high-level consolidation and repair.
The market is relatively subdued overall at present, with no major unexpected news. Gold prices are mainly tracking fluctuations in the U.S. dollar and U.S. Treasuries in the short term. There is pressure for a pullback above, but support below r
post-image
XAUT-0.33%
$ETH Signal】1H momentum strengthening + Bollinger Band opening upward Long trade setup
$ETH Hourly buying pressure has actively lifted prices three consecutive times, with the price holding above 2515 and order book depth imbalance at 11.29; bullish limit orders completely overwhelm the sell side. The 4-hour Bollinger upper band is at 2528, while the MACD histogram continues to expand, indicating that momentum still has room to run. After dipping to 2459 late last night, the price quickly recovered, and the buying support structure remains intact. The current risk-reward ratio is acceptable,
post-image
ETH-0.15%
BTC-0.12%
SOL+1.10%
I had just switched the software to the background when it suddenly plunged on its own, leaving me a bit on the back foot—given this move, maybe I should switch back and watch it perform.

A few days ago, when it was repeatedly oscillating intraday, $LUNC fell just short every time it tried to push higher. Volume failed to keep up, overhead resistance was obvious, and it looked unmistakably like the whales were luring longs in. I went straight in with a short order at 0.00008503, leaving the rest to time—no guessing the top, just taking profits I could understand.

When I opened the chart th
post-image
LUNC-2.90%
SOL+1.10%
XRP-0.97%
Last week’s spot ETFs for Bitcoin and Ethereum attracted a combined $1.2 billion. BTC saw about $987 million, while ETH saw about $216 million. The money was clearly skewed toward the leading assets.
The pace was chaotic at first, then synchronized. BTC saw $217 million in inflows on Monday; on Tuesday, it shed $237 million, the only net outflow of the week. On Wednesday, BTC saw $101 million in inflows, while ETH ended its 12-day winning streak with $48 million in outflows. Thursday brought a reversal—BTC posted $731 million in a single day, its largest inflow since mid-January; ETH simultane
ETH-0.14%
BTC-0.12%
Everyone’s fading USELESS at 0.218—but the 4h tape says you’re early, not wrong.

$USELESS /USDT - LONG

Trade Plan:
Entry: 0.21461 – 0.22129
SL: 0.18591
TP1: 0.24198
TP2: 0.25800
TP3: 0.28203

Why this setup?
Why now?
- 95% confidence on a LONG setup while 1D trend prints bullish—higher timeframe is your tailwind.
- RSI 15m at 49.79: neutral fuel, not overheated—room to run before TP1 at 0.24198.
- ATR 1h (0.01335) shows volatility is compressed; break above 0.22129 triggers the squeeze.
- Entry zone 0.21461–0.22129 is the “cheap re-load” before the 0.25800–0.28203 magnet.
- Inva
USELESS-16.92%
Load More

Join 40 M users in our growing community

⚡️ Join 40 M users in the crypto craze discussion

💬 Engage with your favorite top creators

👍 See what interests you

View More