
Share your thoughts
placeholder
Article
Gold surged to 4443 in early trading yesterday before coming under pressure and retreating. It fluctuated and shook out positions throughout the day, then dipped further to 4345 overnight, closing bearish on the daily chart.
There is downward-testing momentum in the market, but reversals and recoveries can occur at any time in a ranging market. Beware of chasing shorts directly at low levels!
Focus on two levels today: 4380 and 4405. 4405 is the 0.618 Fibonacci retracement level and an important resistance area. 4380 is a top-to-bottom conversion level and the intraday bull-bear dividing line.
post-image
XAUUSD+0.61%
GT-2.19%
The fastest way to become a billionaire is to become the son-in-law of the most powerful man
In 2025, Trump’s son-in-law earned $107 million
post-image
  • 1
While I was away using the restroom, the candlestick chart had already wiped out my losses for me.

During the repeated intraday swings, $BR kept grinding along the bottom without breaking down. After pulling back to around 0.21096, the key level remained solid, and funds were quietly flowing in, so I added to my position as planned. When I checked again just now, the price had already reached 0.27432, delivering a +589.75% return on this small move. It was truly sluggish at first, but the breakout feels just as good.

I’ve taken 80% in profit and moved the stop loss on the remaining 20% up
post-image
BR+1.46%
SNDK-2.23%
SOL+0.33%
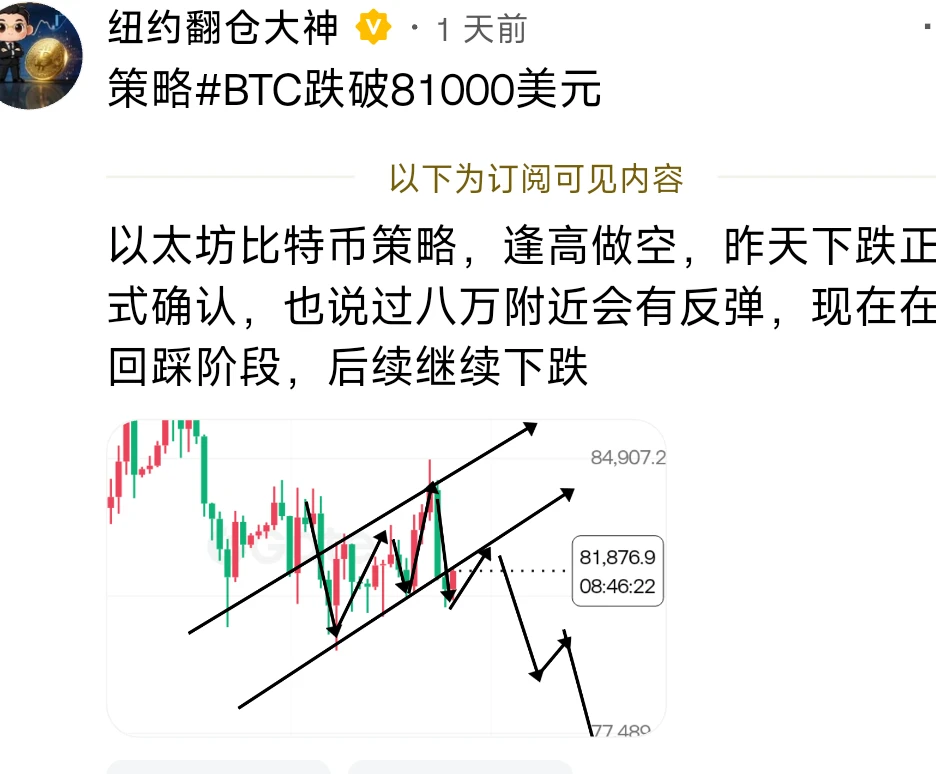
Reviewing last night’s market action, BTC moved within our expectations. 79200 had previously turned from support into resistance, and if the rebound failed to break above 790-792, the market remained dominated by bears. After dipping to a low of 77600 last night, it began a rebound recovery. Following last night’s bearish strategy, shorting directly near 78700 could have netted you 78230, offering around 500 points of profit.
The four-hour descending channel is still intact. The temporary top at 82282 is unlikely to be broken again, and it will not be broken in the next one to two weeks. The
BTC-0.23%
ETH+0.41%
This was purely the market being in a good mood and casually tossing out some gold—it just happened to hit me on the head.
When I checked the charts right after lunch, $BZ was still alarmingly red, but something felt off in the order book: the sell orders kept getting eaten up, while the buy orders were lined up neatly. Repeated choppiness is when it’s easiest to shake people out, but I refused to leave and went straight long, telling the brothers following along not to panic. The longer the buildup, the cleaner the move when it finally breaks out.
You all saw what happened next: entering aro
post-image
BZ+1.23%
ZEC+4.63%
BNB+1.68%
I’d better do some coursework, or my advisor will think I’ve been slacking off.
@Showy005 @conso_zh I’m here to cause trouble.
Gold, publicly flagged across the internet, rose as expected this morning at the anticipated level, reaching a high of 4369, with 28🔪$XAU during the period.
XAU-0.88%
No vision, can't hold on, the profit on this move is paper-thin, but I love it.

I said during the intraday bottoming process that blindly chasing longs was the easiest way to end up busy for nothing. $XAU surged toward the highs several times in a row but never managed to hold, while volume got lower each time and the buying support was visibly weaker. It was clearly a bull-trap setup, but some people insisted on calling it the prelude to a launch. I couldn't be bothered to argue and directly placed a short order at 4510.00. I just took a glance, and the price has already dropped to 4379, w
post-image
XAU-0.88%
BTC-0.23%
SNDK-2.23%
Yang Guang bit | September 9 $ETH rebounds against the trend after a plunge, with a tug-of-war around 2,500 ahead of CPI
【Today’s Strategy】
Entry timing: Set up short positions on a rebound in the 2,510–2,520 range
Stop-loss: Above 2,535
Staggered take-profit:
- First target: 2,470–2,480
- Second target: 2,440–2,450
Core conclusion
Geopolitically, Iran carried out retaliatory strikes on a U.S. military base in Jordan; oil prices broke above $94, approaching a six-week high, but as a high-beta risk asset, ETH has weaker safe-haven attributes. Geopolitical conflict suppressing risk appetite con
post-image
ETH+0.36%
You can tell we are getting closer and closer to the midterm elections. This is all coming at an interesting time. Yes, from the Degen original pump success, the Trump side did win. That was massive.
And now it looks like the $LAPTOP is getting involved with the Trump bag holders. So on September 9, on the base network, $LAPTOP is planning to airdrop some tokens to all the wallets that lost funds during the $TRUMP memecoin.
This is heating up because the $TRUMP memecoin rallied to about $ 15 billion at its peak and then completely fell and collapsed by more than 96 percent. This left thousands
post-image
DEGEN-1.00%
TRUMP-2.57%
【3,400 BTC Returned—Does the Liquid Incident Now Count as a “White Hat Story”?】
On September 8, it was reported that approximately 4,000 BTC was taken from Liquid’s Federation wallet. Subsequently, approximately 3,400 BTC was returned, while roughly 598.5 BTC remains unreturned.
Returning most of the funds is, of course, good news. But what I want to know more is this: how exactly should the nearly 600 BTC that was kept be explained?
If both sides have already reached an agreement on a bug bounty, they should publicly explain the amount and the basis for its handling; if they have not reached
post-image
BTC-0.27%
Hit the Targets, Share USDT and XAUT Prize Pool https://www.gate.com/campaigns/6182?ch=7196&ref=VLARBF1YAG&ref_type=132
post-image
CryptoChampion
Hit the Targets, Share USDT and XAUT Prize Pool https://www.gate.com/campaigns/6182?ch=7196&ref=VLARBF1YAG&ref_type=132
repost-content-media
XAUT-0.87%
An analysis of BTC's short-term trend from Dow Theory, Chan Theory, Elliott Wave Theory, volume-price relationships, order flow, and price action (strategy recommendations)
Comprehensive assessment
Dow Theory confirms that the primary trend remains strongly bullish, but the consecutive decline from September 7 to 9 completely broke the bullish structure in place since September 3, with successive breaks below the 79,000 and 78,000 round-number levels. The short-term trend has fully turned bearish.
Chan Theory shows that the downward stroke from 82,262 had extremely strong momentum (-6,014), wh
BTC-0.27%
$NVDA BREAKING:🚨
$SUI 🇺🇸 Former U.S president Joe Biden son is launching a memecoin 👀
Hunter Biden, son of former U.S. President Joe Biden, plans to launch the $LAPTOP meme coin on Base on Sept. 9. $ASTER
Here we go guys 🤏
ASTERUSDT
Perp
0.7553
-2.61%
NVDA-2.00%
  • 1
Everyone is missing the real setup hiding inside SYMBOL right now.

$HYPE /USDT - LONG

Trade Plan:
Entry: 85.642 – 86.010
SL: 84.060
TP1: 87.151
TP2: 88.034
TP3: 89.358

Why this setup?
Why now? The daily trend is bullish and the 1h price is holding at 85.826, giving us a precise entry zone between 85.642 and 86.010. The 1h ATR of 0.735853 tells us volatility is expanding, so moves toward TP1 at 87.151 and TP2 at 88.034 are structurally likely. Meanwhile, the 15m RSI at 65.51 shows momentum is healthy but not overextended, leaving room for a clean run. The line in the sand is 83.576, becau
HYPE+1.85%
The overall full-year curve has continued to trend downward. At the beginning of the year, the market had relatively high expectations for approval, but those expectations continued to decline; after entering the second half, they fell further and are currently stable in a low range, while bullish confidence continues to weaken.
post-image
Gold is currently at 4380
First observe the pressure at 4390 in the morning; enter after it is held back
If the 4390 level can hold, head south directly at 4385, with the downside target at 4300$XAU
post-image
XAU-0.88%
Layout for Bitcoin, Ethereum, and Dogecoin
live-cover
LIVE1,613
9.9 BTC Analysis
The BTC hourly chart has completed a technical rebound after probing lower, with price action in a corrective structure within a downtrend. RSI has risen into a neutral-to-strong range, MACD has formed a golden cross at low levels, and volume has shown a pulse-like recovery, but the bearish tone on the larger time frame has not been reversed. 78931 above is a dense selling-pressure zone, where the rebound is likely to encounter resistance from trapped holders; 78108 below is short-term support, while 77602 is the bull-bear dividing line. If price cannot effectively hold above
post-image
BTC-0.27%
Load More

Join 40 M users in our growing community

⚡️ Join 40 M users in the crypto craze discussion

💬 Engage with your favorite top creators

👍 See what interests you

View More