

Share your thoughts
placeholder
Article
$NACHO Sigh, I couldn't sleep all night.
post-image
NACHO+78.31%
Most traders are about to get blindsided by SYMBOL right now.

$ETH /USDT - LONG

Trade Plan:
Entry: 2483.69 – 2490.73
SL: 2453.39
TP1: 2512.57
TP2: 2529.48
TP3: 2554.84

Why this setup?
Why now? The daily trend is bullish, and the 4h setup is armed with a 95 percent confidence score, so the odds favor continuation. The 1h ATR of 14.090609 shows the average true range, which tells us how aggressively price is moving right now. The 15m RSI at 51.25 means momentum is neutral, not overbought, leaving room for upside. The entry zone around 2487.21 aligns with the current 1h price, while TP1 at
ETH-1.19%
Gate brings “Gold-Digging Dog” into the mainstream—Is Meme trading entering the social era?
This time, what I think is worth noting about Gate launching Gold-Digging Dog goes beyond 0 Gas.
Its official positioning is clear: Gold-Digging Dog focuses on a social trading ecosystem for Memes, and will support features such as Callout rankings, KOL rankings, and active account displays.
This means it is not merely a simple on-chain trading gateway, but is trying to bring “discovering trends” and “trading trends” into the same setting.
Previously, when we discovered a Meme coin, we might see someone
MEME-0.24%
  • 16
9.8 Jince Gold Morning Review: Gold in wide-range consolidation with repeated tug-of-war; intraday bull-bear dividing line about to be confirmed

Intraday spot gold formed a wide-range consolidation on the 15-minute chart. After rising to around 4435 in the early session, prices came under pressure and pulled back, then fluctuated lower to hit a stage low of 4381. Buying subsequently entered and drove a rebound, with prices recovering to around 4414 at the high before encountering resistance again and falling back to around 4407. Short-term bulls and bears are engaged in repeated battles, wit
post-image
GLDX-0.07%
PAXG+0.08%
I didn’t chase when the price broke above the previous high, waiting instead to go long after it stabilized around 2394.32 on the pullback. A true breakout won’t be completed in one move; positions built after a confirmed pullback are often more solid.
The price then moved upward in small steps, continuously forming higher lows at key levels. The fake bearish candle in the middle shook out quite a few short-term traders, but the bulls did not break down and continued at their own pace.
After the unrealized profit reached +698.1%, I reduced the position by 70% and moved the protection level for
post-image
SNDK+1.42%
BTC-1.46%
Everyone is missing the short setup forming right under SYMBOL

$SKYAI /USDT - SHORT

Trade Plan:
Entry: 0.05666 – 0.05704
SL: 0.05863
TP1: 0.05551
TP2: 0.05462
TP3: 0.05329

Why this setup?
Why now? The daily trend is bearish, the 1h price is 0.05685, the 15m RSI is 61.48 and the 1h ATR is 0.000742, which together define an entry zone between 0.05666 and 0.05704. The 1h ATR of 0.000742 sets realistic expectations for volatility, meaning the TP1 target of 0.05551 and TP2 target of 0.05462 are within one ATR move from the entry. The invalidation level at 0.05861 is the line in the sand that
SKYAI-5.52%
I was just about to curse it out, but then I looked at my account and thought, never mind. Let it fall however it wants—I’ll keep quiet.

During the intraday plunge, it weakly bounced to around 0.06198. The trading volume looked half-asleep, bids were weak, and it was obvious it couldn’t go any higher. I placed a short order, and sure enough, it later ground all the way down to 0.05601, +236.19%. That profit felt great.

The operation wasn’t complicated: lock in 80% first, and set breakeven protection for the remaining 30%. Even if it bounces, it won’t touch my profits. With a coin you’re no
post-image
SNDK+1.42%
SOL-2.50%
I didn’t do anything—just went to the restroom, and when I came back, the K-line had already done the work for me. I opened the chart in the morning: $ETH was bottoming out without breaking down, while volume was starting to recover. I saw that the incoming capital looked substantial, so I went long. When I came back, it had moved from 2473.40 to 2485.34, +82.61%. Feels great, brothers. This bite of profit was satisfying—those on board should have woken up laughing. In terms of execution: put the bulk into your pocket first, take 80% off the table, and move the stop-loss on the remaining 20% c
post-image
ETH-1.19%
LAB-2.64%
SOL-2.50%
Market Alert

$UAI /USDT - LONG

Trade Plan:
Entry: 0.6987 – 0.7175
SL: 0.6176
TP1: 0.7760
TP2: 0.8213
TP3: 0.8892

Why this setup?
Technical setup found.

Debate:
Thoughts?

⚠️ Personal market analysis only. NFA — manage risk and DYOR.
Educational content, not investment advice or a recommendation to buy, sell, deposit, or withdraw any asset. No paid promotion or referral/affiliate links.
post-image
UAI+19.59%
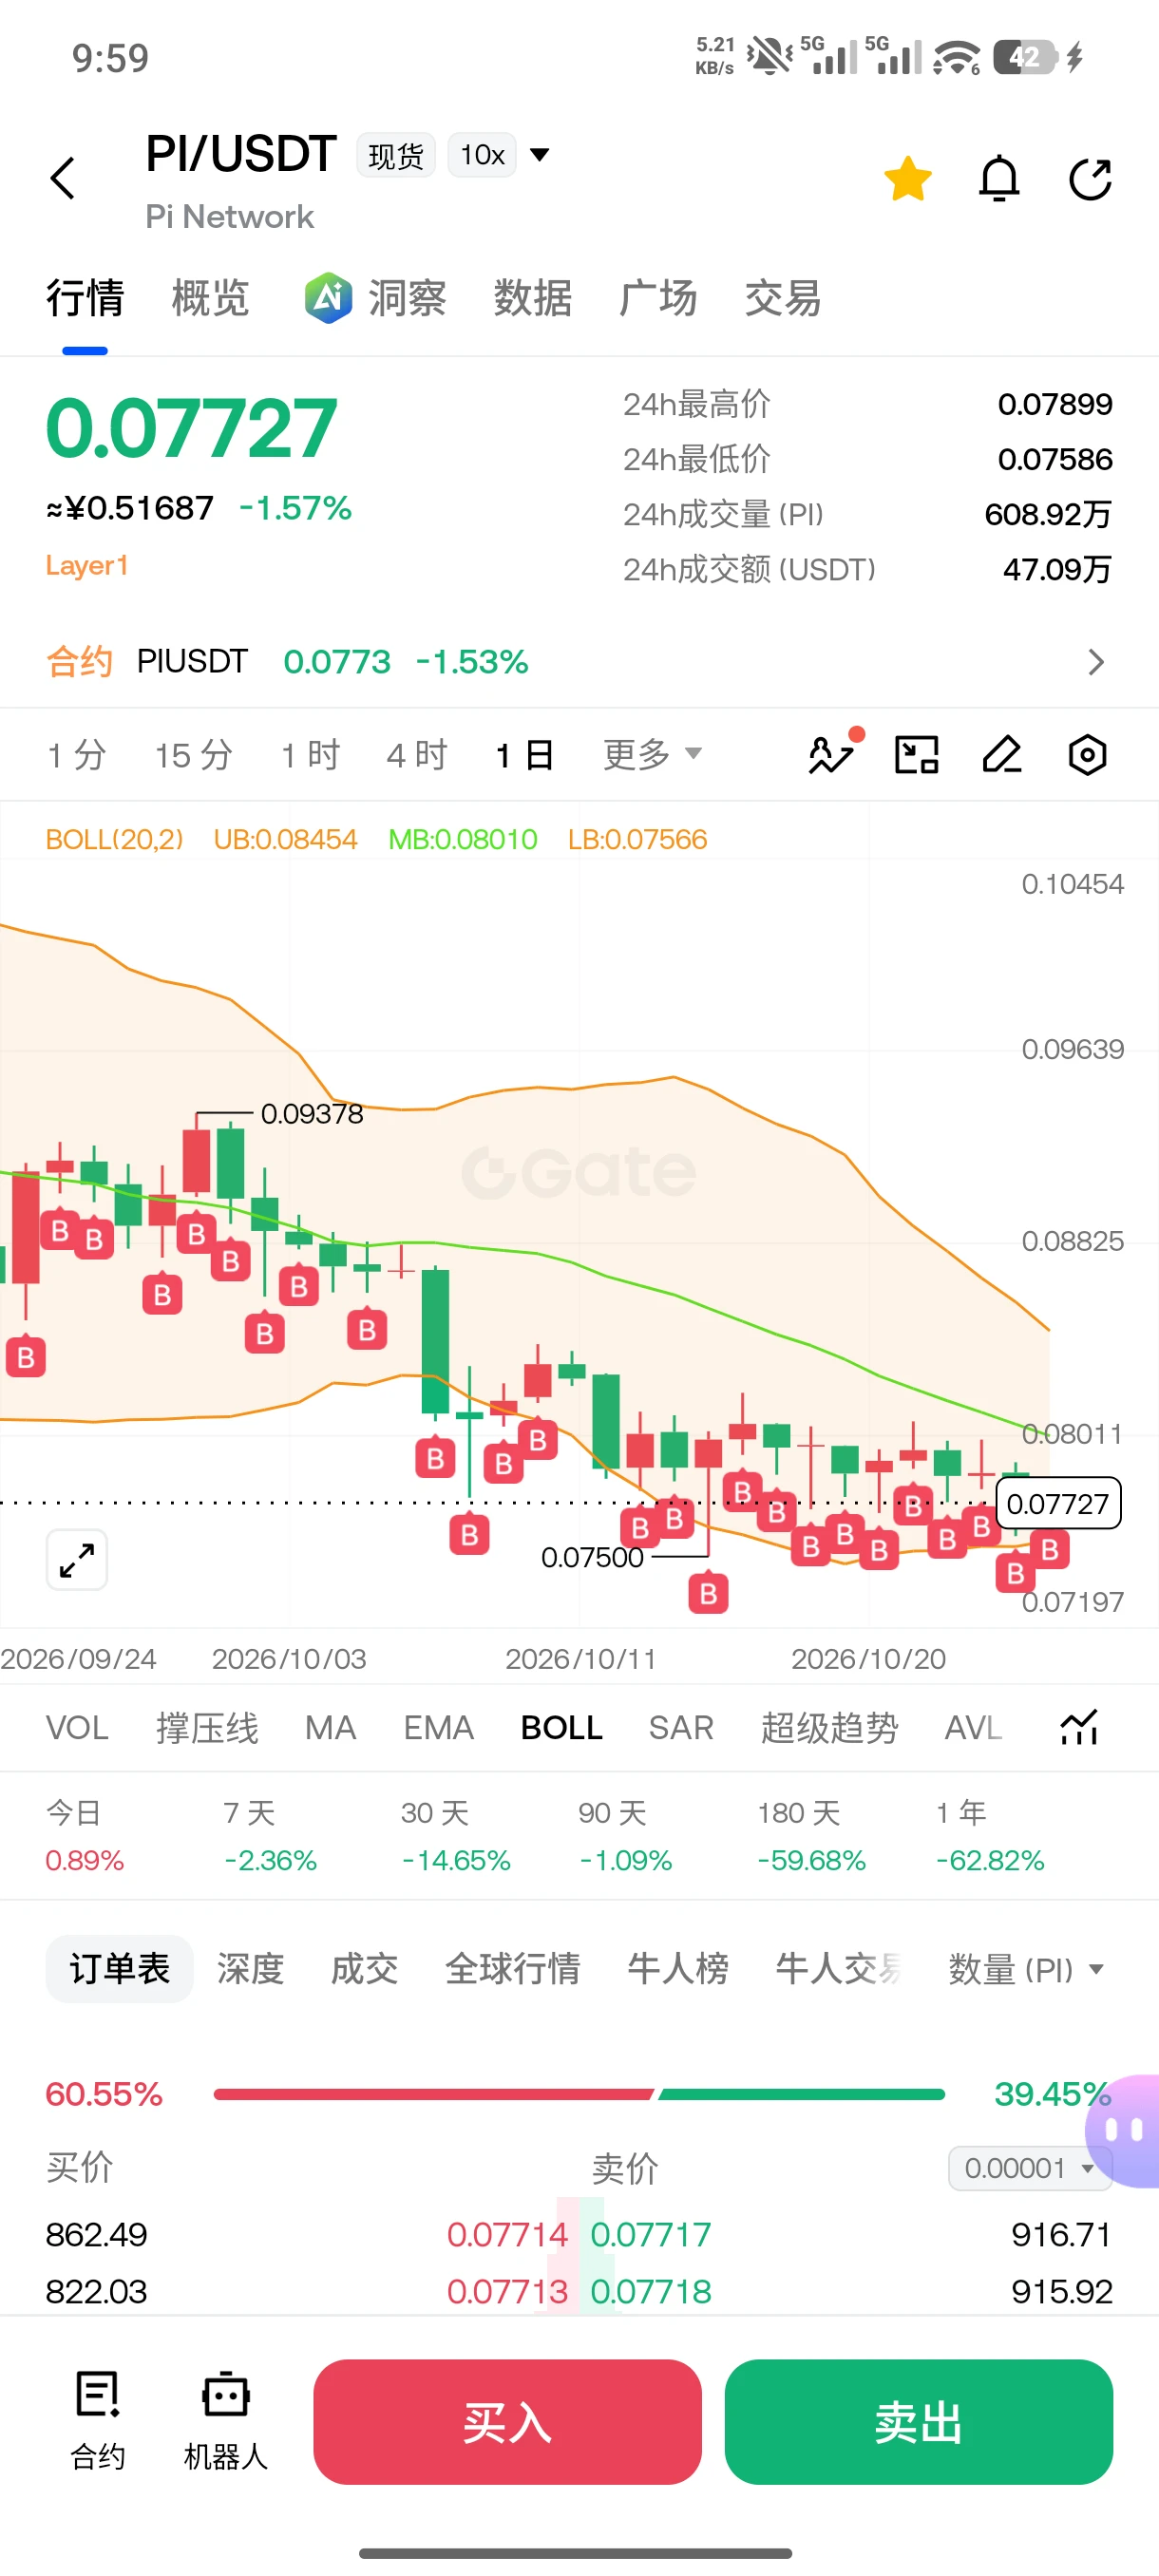
Pi coin is priced at approximately $0.094 today, down slightly by 0.4% over 24 hours and rebounding modestly by around 4% over the past 7 days, but it has fallen more than 72% year to date and is down 97% from its all-time high ($2.98). Technically, the price is at the end of a triangular consolidation, with $0.097 as key resistance and $0.084 as support. The RSI is neutral and relatively stable, while momentum is mild. Trading strategy: Holders should watch whether $0.097 can be broken with increased volume; a breakout could support holding for a target of $0.117, while a break below $0.084 w
PI-0.91%
  • 2
0 Gas is just the beginning! Gate’s “Gold Dog” may be aiming for full-chain trading
If you only see the “limited-time gas fee waiver,” you may underestimate the significance of Gate launching Gold Dog this time.
Official data shows that Gold Dog currently supports multiple public chains, including Robinhood, SOL, ETH, Gate Layer, BSC, Base, SUI, ARB, AVAX, and Polygon, and plans to continue expanding its network coverage.
The logic behind this is actually simple: Meme hype will not exist on just one chain.
Robinhood Chain may be hot today, a new trend may emerge on SOL tomorrow, and a dark hor
SOL-2.53%
ETH-1.25%
SUI+0.47%
ARB-10.17%
  • 32
a-meme-coin:native wow 😮
0x385f4f8ae47651ce5f58f5265395a669f8281e18
post-image
MEME-0.24%
Do you stand with Israel or the UK after the UK has announced sanctions due to Jewish settler terrorism ?
post-image
I was just about to go to the forum and start cursing, but then I saw my balance—never mind, the market is always right. 😤

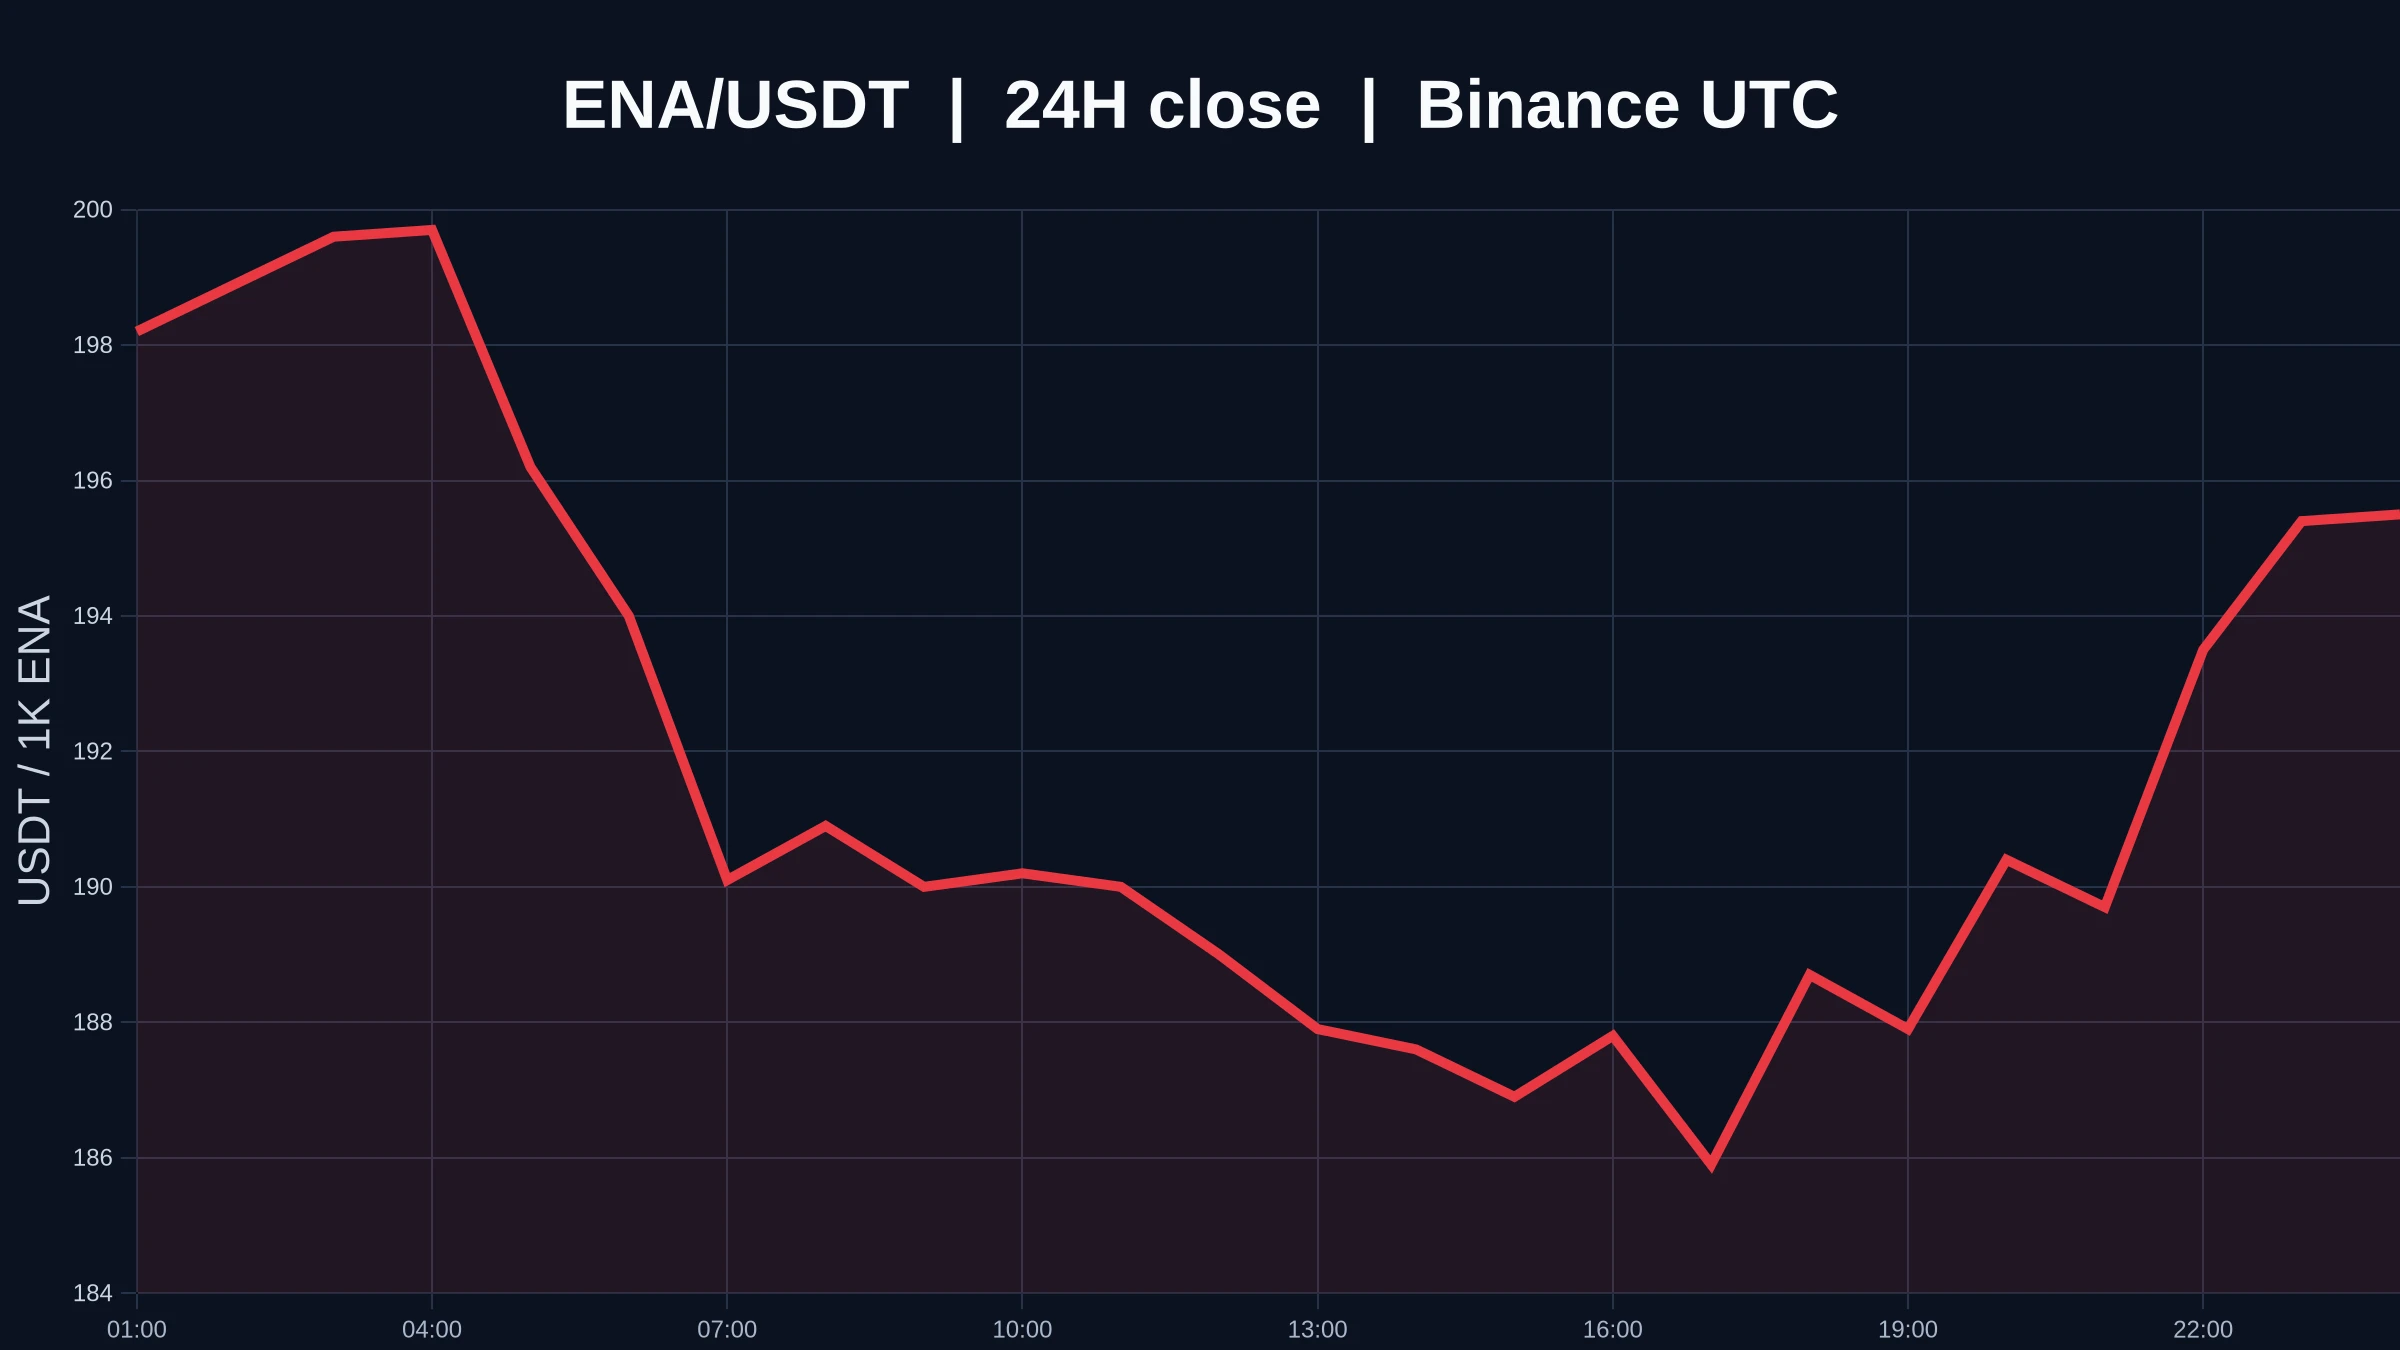
With the whole screen glowing green, $SAMSUNG kept grinding along the bottom down to 186.14, and I knew something was off: the level that should have broken didn’t, while funds were quietly moving in. Was someone getting in ahead of me? Then I followed and went long—get on the train first and worry about the rest later.

I just checked my holdings, and the current price has already climbed to 200.5, with a return of +545.11%%. Looks like this ride is secure. Everyone o
post-image
SAMSUNG+2.66%
DOGE-0.18%
SNDK+1.42%
This was purely the market being in a good mood and casually scattering a few gold coins, which happened to land right on my head.

Right after lunch, when I checked the chart, $SUI was still alarmingly red, but something felt off in the order book: the sell orders were getting thinner the more they were absorbed, while the buy orders were lined up neatly. Repeated choppiness is when it’s easiest to scare people out, but I refused to leave and went straight with a long idea, telling the brothers following along not to panic. The longer this kind of buildup lasts, the cleaner the move up will
post-image
SUI+0.55%
SNDK+1.42%
LAB-2.64%
I just casually hit refresh, and it went up on its own, leaving me in a very passive position😅
When I checked the chart after lunch, $PENDLE had pulled back to around 1.540. Buying support was clearly stronger than in the morning, and the market didn’t look like it was about to dump either. The key level held, which was reason enough, so I followed the move and added another long position.
Who would’ve thought that when I checked again in the evening, the price had already reached 2.225, and this position was showing +3158.38% in floating profit. This was a very satisfying bite of the meat💪
post-image
PENDLE+7.29%
SNDK+1.42%
ADA-1.79%
$1000 to $100,000 Crypto Trade Challenge Today
live-cover
LIVE1,598
9.8 Su Wan’s Morning Market Analysis and Trading Strategy
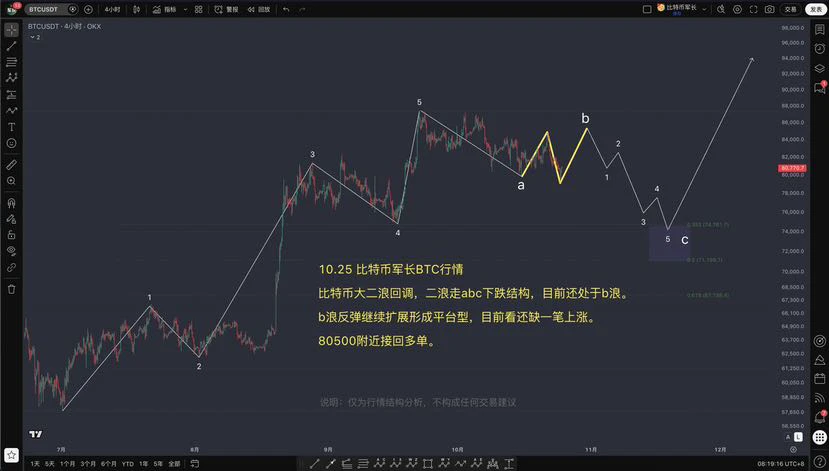
BTC and ETH are still fluctuating broadly within a sideways range. On the hourly chart, the low touched support near 785 before rebounding. The hourly chart has seen two consecutive bullish candles, with the KDJ golden cross moving upward.
BTC: Buy near 78,500–78,000, with a target near 80,000–81,000.
ETH: Buy near 2,460–2,440, with a target near 2,500–2,540. $BTC $ETH #Gate上线打金狗限时免Gas费
post-image
BTC-1.50%
ETH-1.25%
Load More

Join 40 M users in our growing community

⚡️ Join 40 M users in the crypto craze discussion

💬 Engage with your favorite top creators

👍 See what interests you

View More