Square
Following
Hot
News
Profile
Share your thoughts
placeholder
Article
Live trading - Analysis new crypto coin
live-cover
LIVE35
Broke $5K in profits today! ✅️
Looking at a $500 prize! 🎊
Copy Trading Available Soon!
Come trade with me on AlphaX!
NFA, DYOR ⚠️
#Crypto #Trading #ETH #AlphaX
post-image
ETH+1.62%
LayerZero built Akita, a post-quantum proof scheme, with researchers from a16z crypto, Carnegie Mellon and USC. Its first deployment will be in Jolt, the prover behind the Zero blockchain, with proofs 2x to 3x faster.
@LayerZero_Core
ZRO+9.32%
If I could leave only one note for $KORUB today, it would be: don’t let -8.42% make the decision for you.
What is really worth discussing is that $KORUB moved first on the 1-hour chart, while the 4-hour chart still hasn’t acknowledged it. $KORUB is currently at 11.96, down -8.42% over 24 hours. The 1-hour support is 10.07, resistance is 12.99, and current volume is 0.18 times the average volume of the past 20 candles.
The 1-hour trend is relatively strong, with RSI at 79; the 4-hour trend is relatively weak, with RSI at 36. This combination makes me temporarily accept the following interpreta
post-image
Buy $QNT before its too late.
Day 1069.
post-image
QNT-0.11%
🚀 GT/USDT Technical Insights: Is GateToken Preparing for a Bullish Reversal at $10.00 Support?
Pair: GT/USDT (Spot)
Current Price: ~$10.42
24h Range: $10.00 – $10.45
24h Volume: ~67.70K GT (~$691.81K turnover)
📊 1. Key Technical Breakdown Across Timeframes
1-Hour Chart (Short-Term Recovery):
GT tested strong psychological support around $10.00 before staging a clean V-shaped rebound back above $10.40.
Short-term EMAs (EMA5 at 10.38 and EMA10 at 10.33) are sloping upward, crossing above the short-term Moving Averages, signaling early bullish momentum in micro-timeframes.
MACD has fli
GT-0.09%
  • 3
1016 $DOGE Recent entry position for DOGE—just look at the daily chart. Every time the broader market makes any move, DOGE starts falling in advance.
I've bought at 0.06888 many times before and played the August range quite a bit. The last time, I held DOGE until it started moving at 0.083 and then exited. I haven't really watched DOGE since, because I think DOGE can sometimes be difficult to trade short-term.
We'll continue placing long orders around 0.06888 and 0.07, with a stop loss at the bear-market low of 0.067. Keep the stop-loss range slightly wider. Leave this long-term lottery orde
post-image
DOGE-0.63%
$ETH Long Catches a Fresh Flush Partial Bounce, No Momentum Confirmation
Pair: $ETH /USDT
Direction: LONG
Entry Zone: 2364.29
Take Profit:
- TP1: 2423.13 +2.5%
- TP2: 2462.36 +4.1%
- TP3: 2521.20 +6.6%
Stop Loss: 2285.83
Chart Structure:
- ETH declined steadily from ~2480 through MA7, MA25, and MA99, then printed a sharp flush candle down to ~2285-2300 before bouncing to current price
- Price remains well below all three moving averages this is a bounce attempt within an intact downtrend, not a reclaim
- RSI(14) dropped to ~25 at the flush low and has only partially recovered to the high-
ETH+1.40%
  • 2
before you ask me
were you invit...
Short-Selling Analysis of the Biggest Decliners: Real wealth is hidden in the red candlesEveryone is mesmerized by green candlesticks. Chasing pumps, chasing hot trends. But where is the real opportunity? It is right in front of you—in the red candles. Most people are too afraid to touch them. These four coins are weakening sharply. The market structure has already broken down. Sellers are fully in control. This is not a pullback, but a trend. Smart money positioned itself long ago. I have carefully examined every chart. No hype, just letting the charts speak. $TRUT
Risk level: HighEntry price
post-image
The answer is always hidden in the process that time brings. I’ve already made it extremely clear—the hints have been laid out plainly. Since June, it has felt exactly like hitting whatever I aim at and winning every battle; there’s only one word for it: “awesome”!
$BTC #美国9月CPI超预期
BTC+0.59%
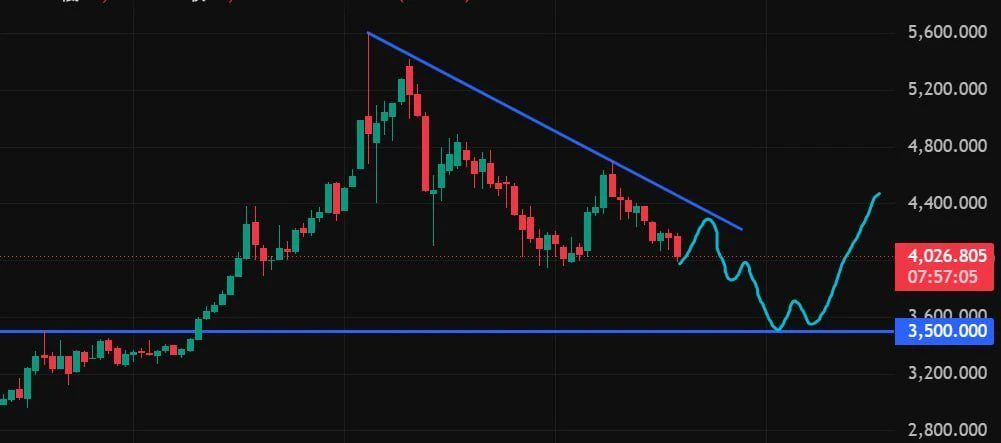
$ETH Are You Ready For This?
NFA, DYOR ⚠️
#Crypto #Trading #ETH
post-image
In 2006, I went online for the first time and casually bought 1,000 Bitcoin.
Back then, Bitcoin was worthless, so I just treated it like in-game currency.
post-image
BTC+0.60%
✨ US equity futures traded mixed on October 15 as technology and AI-related stocks faced renewed pressure.
🔹 Futures tied to the tech-heavy Nasdaq 100 fell about 1.2%, while S&P 500 futures slipped 0.3%. Dow Jones Industrial Average futures held relatively firm, trading slightly positive. The divergence reflects a selective risk rotation rather than a uniform selloff.
📊 The data behind the market's sharp reaction:
🔹 Inflation pressures are broadening
▪️ US September PPI rose 1.3% month-over-month and 6.3% year-over-year, far exceeding the 5.3% forecast and marking the largest annual increas
NAS100+0.08%
SPX500+0.23%
US30+1.36%
GAS-5.77%
MU+1.93%
  • 3
  • 2
“Sausage Index”: Why Is PPI More Important Than It Seems?
The gist: Explain a complex term simply. “PPI is factory-gate inflation. If it costs a meat plant more to buy raw materials and make sausages, those sausages will cost more in stores for you a month later (that’s CPI). So PPI is like a spoiler for future prices. Factories are sounding the alarm now, so the Fed is reaching for its belt.”
#USCPISoon #ShareWeekly
first day calling on @Pumpfun
bullish tek!
post-image
10.16 Gold $XAU Recent Strategy Gold has been moving sideways within this range since falling at the end of September, with 4220 on the upside and 4110 on the downside. We have gradually sold high and bought low several times here.
Here is what we are doing now: 1. Short-term strategy: go long at 4100, exit around 4200, with a hard stop-loss at 4020. 2. After playing a few short-term rounds, switch to a long-term position (you can choose PXAG due to the high weekend fees). The unchanged point for both long-term and short-term trades is going long at 4100 with a stop-loss at 4020; the only dif
post-image
XAU+1.66%
Does a bullish moving-average alignment always mean you should chase long positions?
Not necessarily. The key is whether the price’s position relative to the moving averages is synchronized with momentum. Take $ZEC as an example: the current price is 1235.97, with MA5=1225.24 above MA20=1138.62, forming a standard bullish alignment and indicating a healthy trend direction; however, RSI has reached 70.2, nearing overbought territory, while the price is hugging the Bollinger upper band at 1248.36, making the risk-reward of chasing short-term highs unattractive. A reusable approach is: use movin
post-image
ZEC+7.81%
XPL+8.96%
INJ+11.40%
[New Streamer] Whales Moves in Sync!
live-cover
LIVE1,007
#GateWCTCS9全球交易赛
🔥 Gate WCTC S9 Global Trading Competition Is Coming!
The Gate WCTC S9 (World Crypto Trading Competition Season 9) offers a high-yield opportunity for traders across multiple asset classes. Maximizing your total prize allocation requires a strategic approach to trading weight multipliers, track selection, and team management.
8,000,000 USDT Prize Pool! The ultimate trading showdown across crypto, stocks, and CFDs officially kicks off on October 26!
Choose Your Battlefield:
Team Competition: Join forces and climb the leaderboard through your team's accumulated converted tradi
post-image
Load More

Join 40 M users in our growing community

⚡️ Join 40 M users in the crypto craze discussion

💬 Engage with your favorite top creators

👍 See what interests you

Trending Topics

USSeptemberPPIBeatsExpectations

91.35k Views1.87k Discussing

US September PPI came in at 6.3% YoY, well above the 5.3% market expectation, pointing to renewed producer-side inflation pressure. Weekly jobless claims were 199K, broadly in line with forecasts. Could hotter inflation further reduce room for rate cuts, and what does it mean for $BTC, US stocks, and gold?

DrLinHanSpeaksAtOxfordUnion

135.63k Views1.86k Discussing

JapanAndKoreaStocksPlunge

47.27k Views1.76k Discussing

View More