Square
Following
Hot
News
Notifications
Profile
Share your thoughts
placeholder
Article
$SOXL ‌
The chart framework maps out a clear macro-downtrend transitioning into a volatile consolidation phase. The 1D timeframe establishes the primary structure, originating from a high of 169.83 and descending into a structural base around the 38.82 to 54.87 range.

The 1H and 15M charts zoom in on the current micro-structure, detailing a recent localized push from a 52.45 support level up to a 55.77 local resistance, followed by a current retracement. The moving averages (MA5 and MA10) on all timeframes are tightly clustered, indicating a period of compressed volatility and market indec
SOXL-1.16%
  • 1
I'm currently holding a position. Let's chat in the livestream, everyone; there are too many comments, so I'll reply to them all there
post-image
  • 1
Trenches
mihao
m
bade
b
mihao
4Cxj...pump
Market Cap
$.
Change
.
24h Vol
$.
Holders
.
Snoopy
S
bade
b
Snoopy
7mEh...47Cn
Market Cap
$.
Change
.
24h Vol
$.
Holders
.
AGT
A
bade
b
AGT
0x5d...e274
Market Cap
$.
Change
.
24h Vol
$.
Holders
.
PIEVERSE
P
bade
b
PIEVERSE
0x0e...25a9
Market Cap
$.
Change
.
24h Vol
$.
Holders
.
IDOL
I
bade
b
IDOL
0x3b...ab07
Market Cap
$.
Change
.
24h Vol
$.
Holders
.
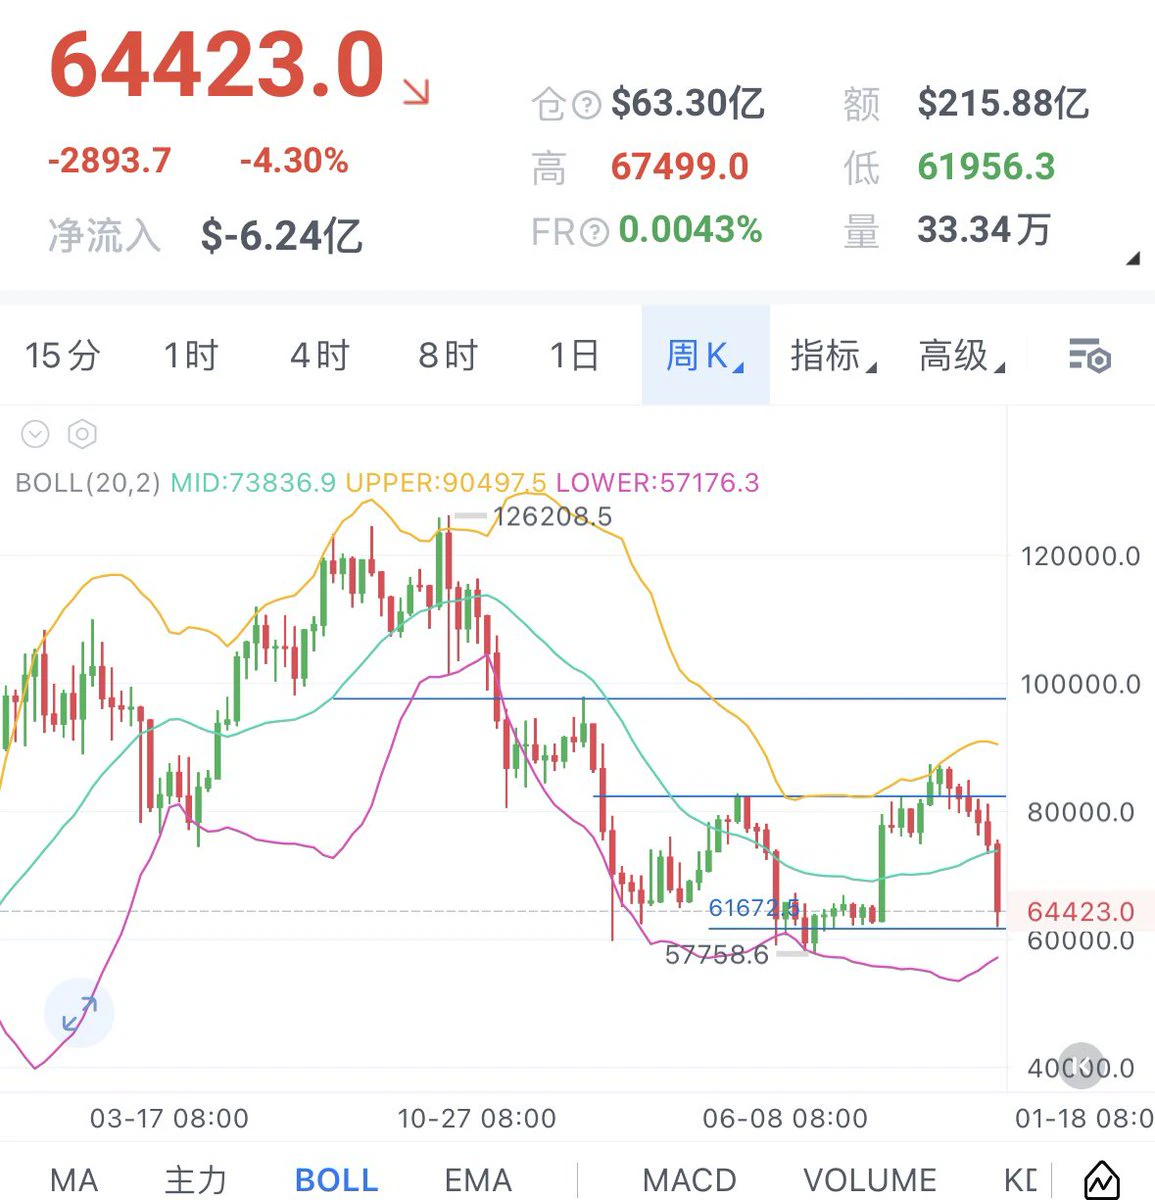
From a weekly-chart perspective, six consecutive down weeks are relatively rare. This week has seen a sustained decline on rising volume, with price losing key support at 68,000 (the starting point of the previous rally) and briefly falling to around 62,000, near the price level of the previous trading range. The weekly MACD has formed a bearish crossover. The market will either bottom out and rebound or continue to decline. The 60,000 psychological level is extremely important. The market is already oversold, but for the long term, it’s still best to wait until the weekly candle closes tomorr
post-image
Why does it feel like my bot is getting slower and less and less intelligent 😅
post-image
US stocks are closed, and crypto is selling off first on its own. $BTC hit a low of 63,400, a three-month low, down 15.6% for the week. There are still no signs of a bottom at this level.
$ETH fell 21.2% for the week, while $SOL $XRP both fell 22%. ETFs have seen net outflows for 7 consecutive days, with another 185 million flowing out on Friday; capital is still pulling out.
Liquidations totaled 1.47 billion over 24 hours, including 1.31 billion in long positions. The Fear & Greed Index is at 13. Next week brings Nvidia earnings and the Fed minutes; the probability of a December rate hike
BTC-0.67%
ETH-1.26%
SOL-0.77%
XRP-1.15%
NVDA-1.92%
No wonder Jensen Huang got fired—he’s wearing a red scarf. In the Democrats’ eyes, that means he’s already joined the party. That’s evidence to them.
post-image
Macro Nexus: Unraveling the Invisible Threads Connecting the AI Boom, Nvidia Drama, CPI, and Crypto Liquidity

Markets do not move in isolation. When retail traders stare at a red crypto liquidation candle or a sudden Bitcoin dump, they often look only at exchange order books. But capital flows like water through a vast, interconnected plumbing system.

Let's connect the dots across Anthropic's IPO roadshow, Nvidia executive governance turmoil, the looming "AI Bubble" narrative, U.S. CPI inflation prints, and the resulting crypto market shockwaves.

1. The Epicenter: The AI Infrastructure Mach
BTC-0.65%
NVDA-1.92%
NAS100+0.00%
  • 4
  • 1
In the world of female-oriented fiction, NVIDIA is probably going bankrupt this time…
post-image
NVDA-1.92%
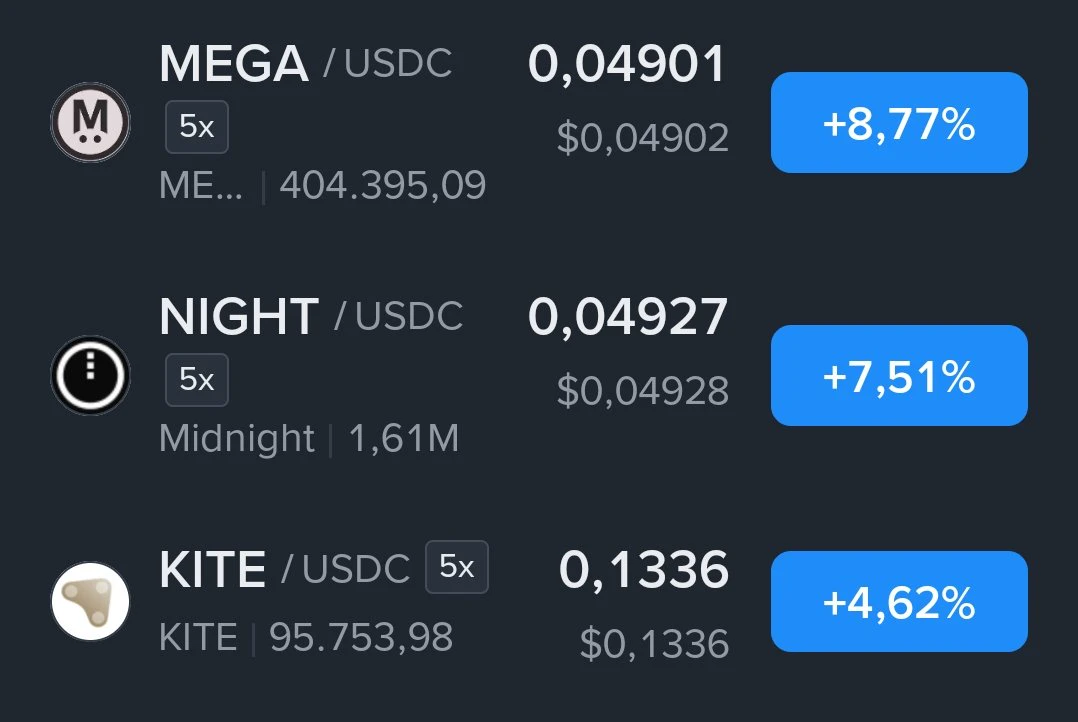
#mega $pump $night $kite
#에이티즈 #Jake_leave_a_birthday_congratulatory_message
post-image
MEGA+0.26%
PUMP+1.62%
NIGHT-3.10%
KITE-0.15%
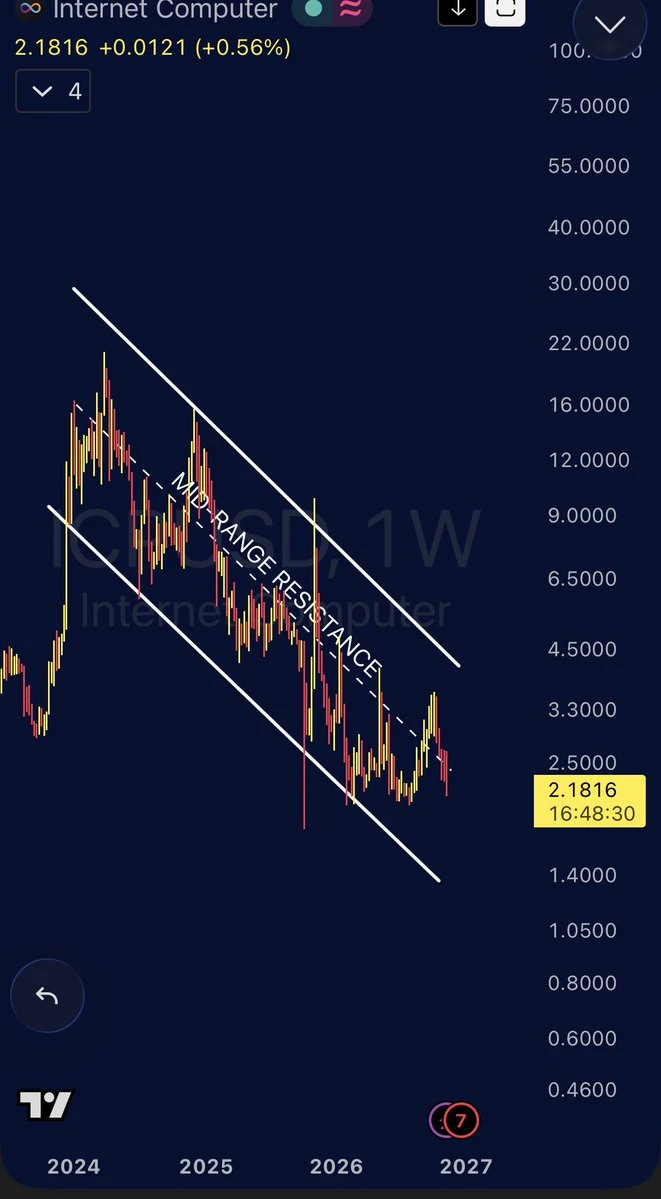
$ICP can’t seem to get out of the resistance channel ,
Hopefully the horizontal support will save us
post-image
ICP-1.14%
Crypto future market update
live-cover
LIVE969
$BTC Will it finally bounce? Looking at the Bitcoin chart, we see a real waterfall. It shows that the price has been falling continuously for about a month. So, will we finally see a green candle here? Could the price bounce from here? This support zone seems to be the only place that could hold here. A second pullback will happen here. If the price can stay slightly above this level afterward, we could see an uptrend. If it breaks below this level, the new target price is 50k.
post-image
BTC-0.67%
One bad trade can wipe out all your hard-earned profits!
This whale won 10 straight trades, making $6.32M in profit, but closed his $ETH long 8 hours ago for a $10.5M loss.
Just one losing trade wiped out all his profits and left him down $4.17M overall!
But he's not giving up. He just opened a 10x long on 383,265 $SOL ($26.97M)!
ETH-1.23%
SOL-0.74%
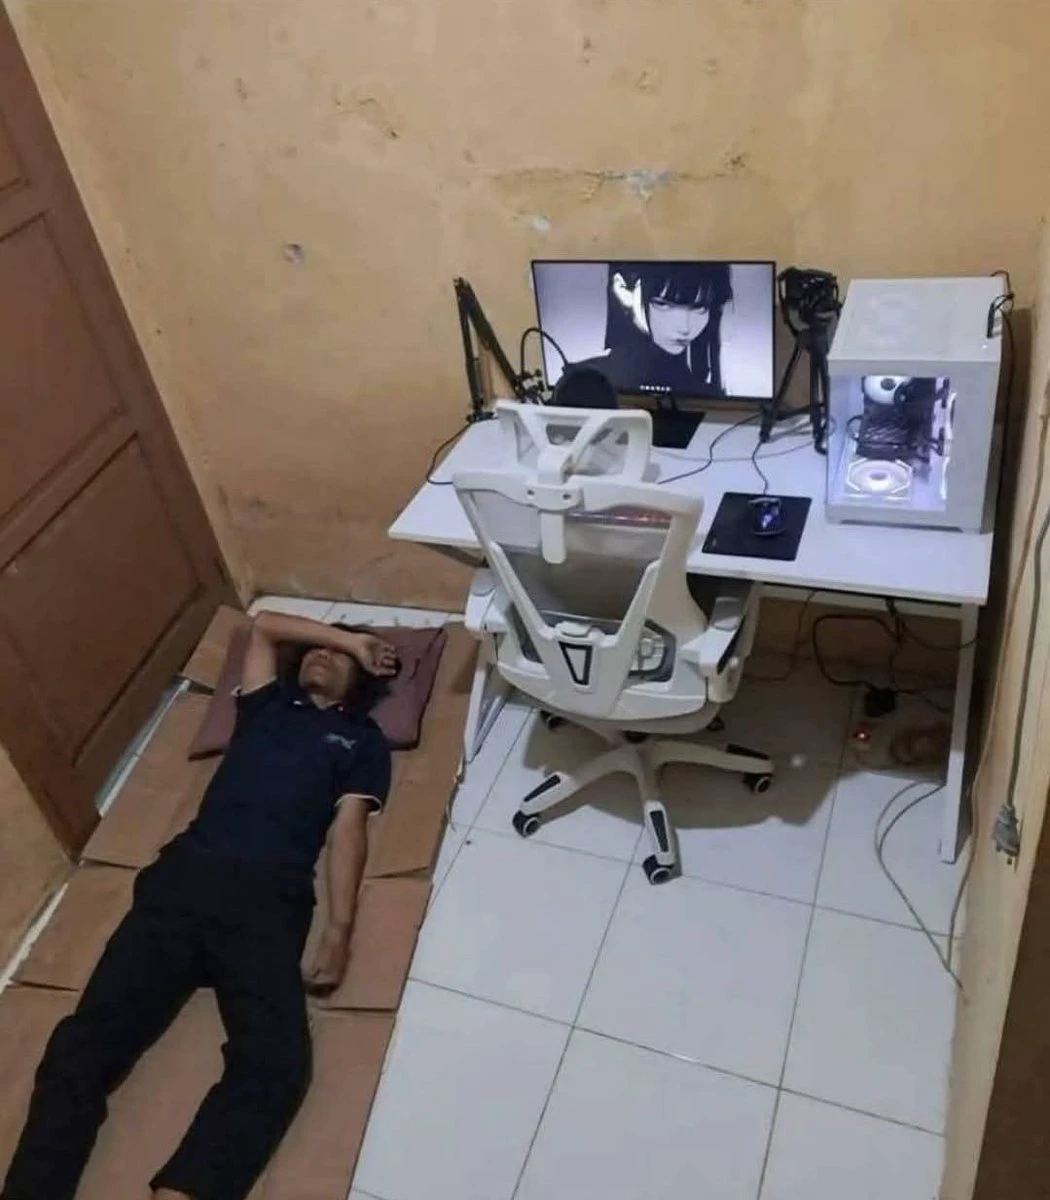
Just got a $4500 airdrop and spent $4400 on my new setup
post-image
AIRDROP+0.00%
Accurate Forecast: Bitcoin Enters a Consolidation Phase, What Key Levels to Watch in the Short Term?
live-cover
LIVE1,614
$SNDK INSANE CRASH:$600 BILLION wiped from crypto and over $1 TRILLION from US tech stocks since the US midterms.$SNDK KavaSaysAbnormalActivityLimitedToKavaLend
post-image
SNDK-0.18%
🤡 @ethereumfndn sold 7,500 $ETH | $14.52M in 4 days
ETH-1.26%
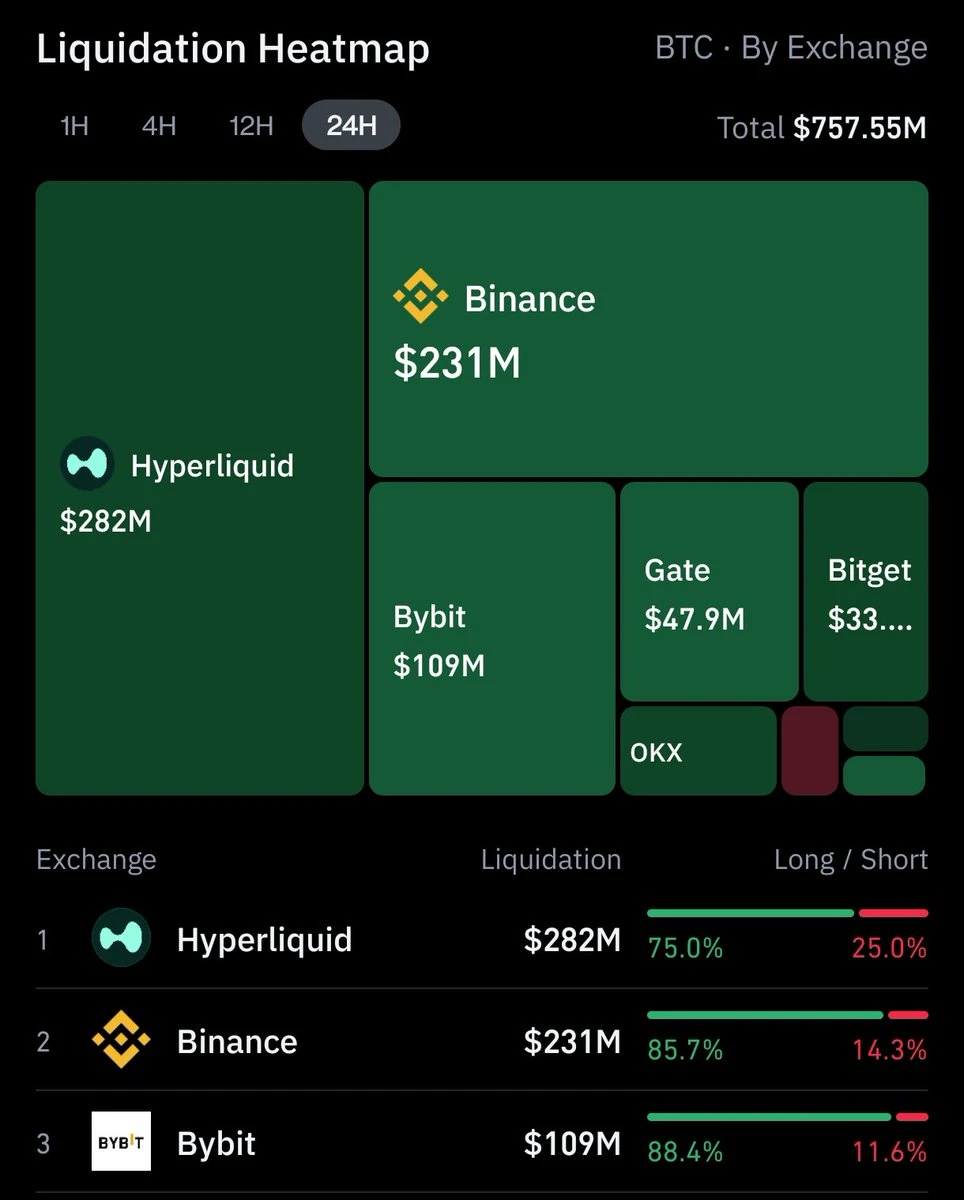
Hyperliquid is actually leading in liquidations
#BTC
post-image
HYPE+0.33%
BTC-0.65%
You don't look like you were scared, kid. You did that on purpose, didn't you?
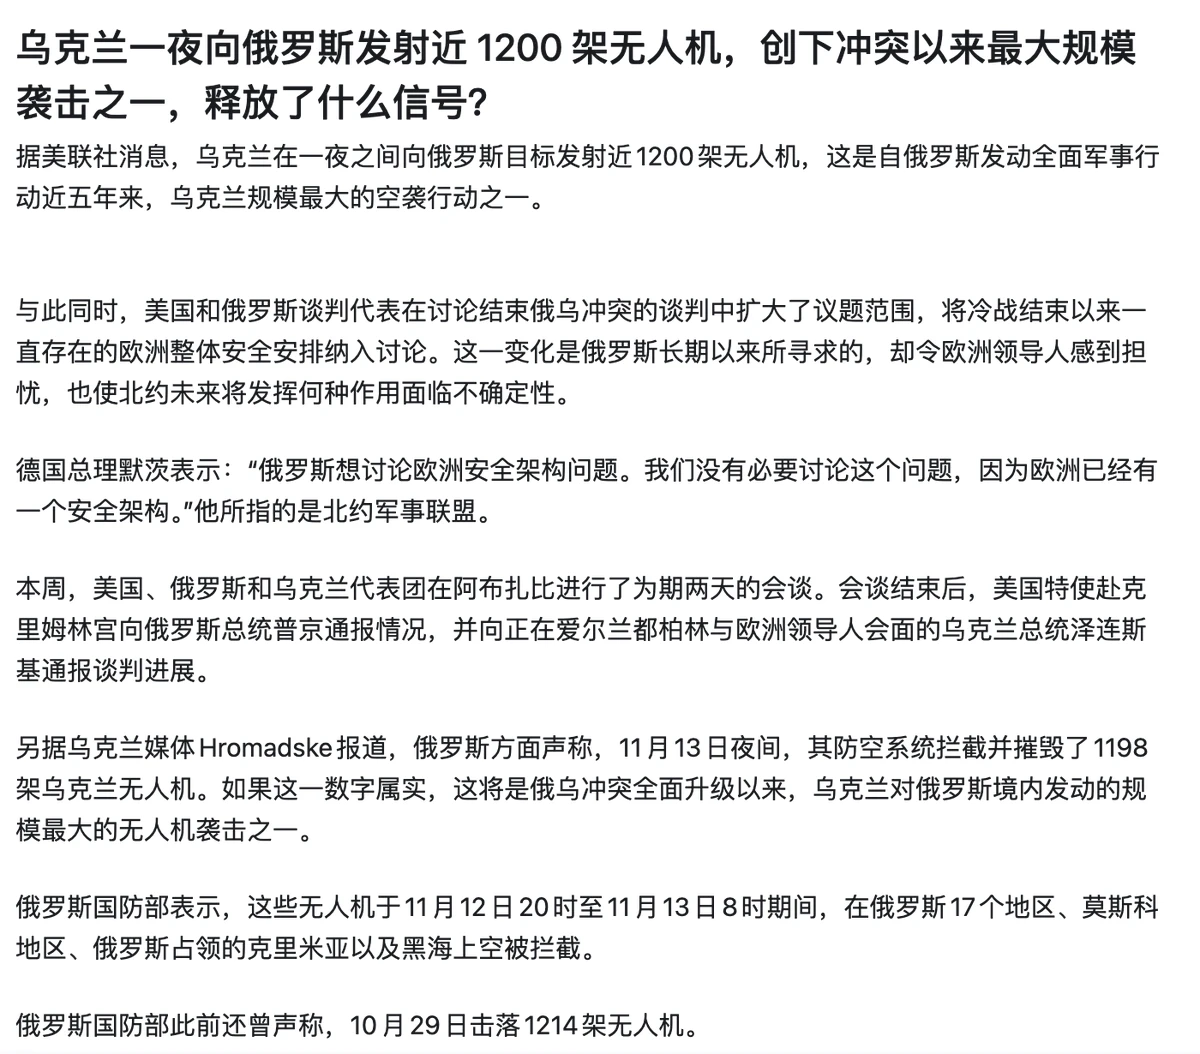
How much longer is this war going to last?
Didn't we hear just a few days ago that they were willing to cede territory to end it?
This whole thing is really dragging on.
post-image
Load More

Join 40 M users in our growing community

⚡️ Join 40 M users in the crypto craze discussion

💬 Engage with your favorite top creators

👍 See what interests you

Trending Topics

GateIPOAccessAnthropic

345.1K Views2.7K Discussing

Gate IPO Access Phase 3 features Anthropic (ANT), with USDT subscription interest starting from 100 USDT. Successful allocations will be delivered as real shares to Gate Stock Accounts. Indicative price: $70–$78/share Subscription: Nov 12–17 (UTC+8) Allocation is not guaranteed. Please manage risk accordingly.

Dr.HanOxfordUnionSpeech

151K Views510 Discussing

USOctoberPPIBelowExpectations

479.7K Views1.4K Discussing

View More