Square
Following
Hot
News
Notifications
Profile
Share your thoughts
placeholder
Article
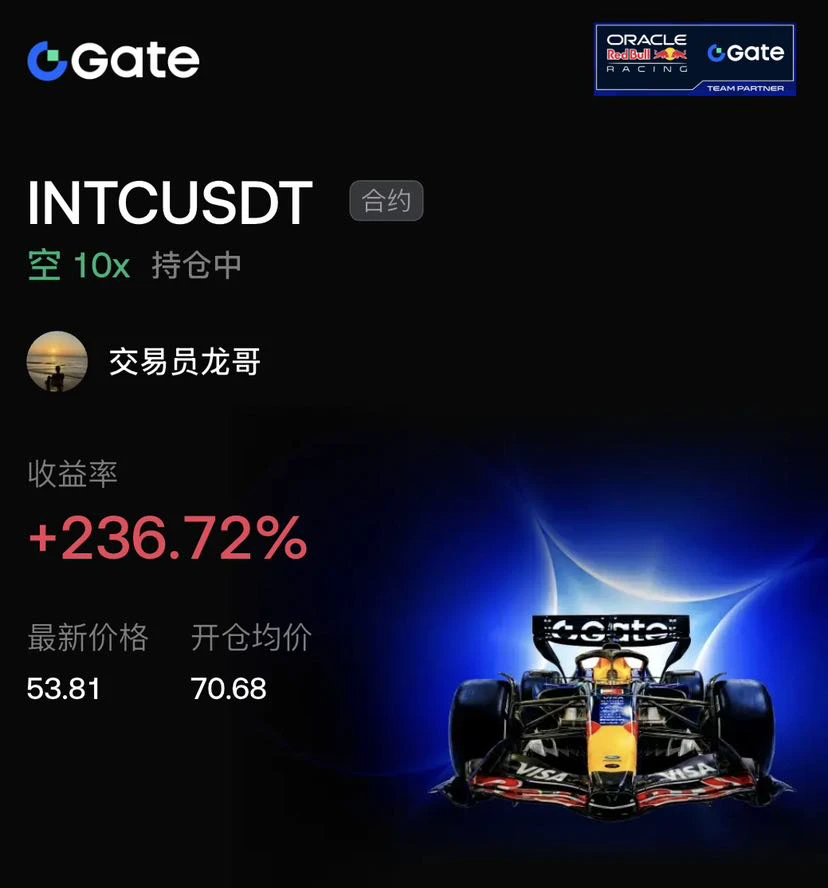
$INTC The logic behind this sharp drop from the highs is actually very clear.

There was severe bearish divergence near 70.68, with volume shrinking, so I went straight into a 10x short. The price dropped smoothly to 53.81, locking in a 236% gain. Once the downtrend was confirmed, riding it was faster than anything else.

With 10x leverage, there were also rebound wicks along the way. Fortunately, I stuck to strict discipline, moved the stop-loss up to breakeven, and held the position throughout. In the end, trading comes down to mindset and rules.

Shorts in profit at these lows could dump th
post-image
INTC+0.05%
BTC-0.65%
ETH-1.23%
#ETH
Fibonacci extensions
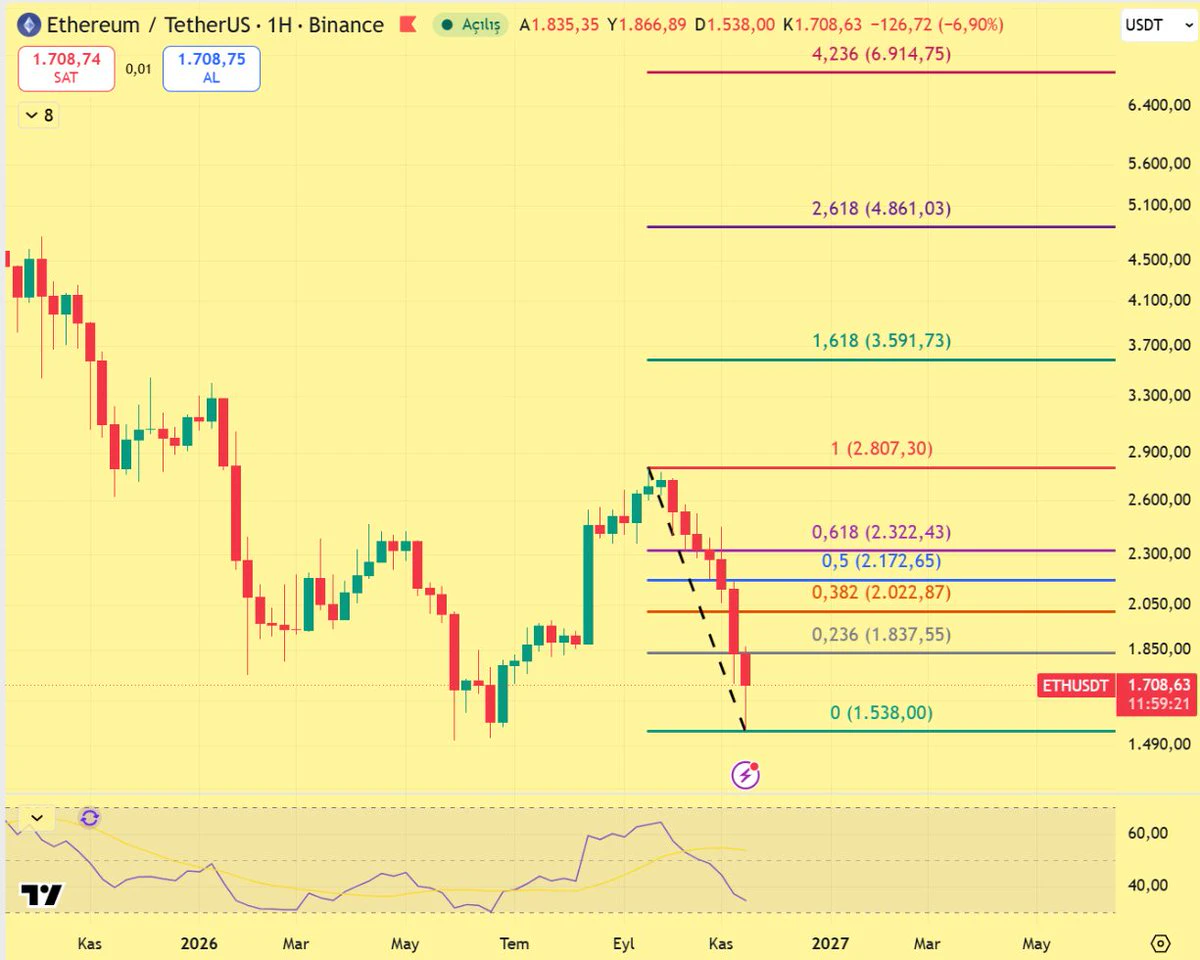
Friends, in today's weekly Fibonacci analysis for Ethereum $ETH , the levels ended at the September high. I extended the same Fibonacci levels upward. Low 1,538, high 2,807.
The extensions above the high are as follows:
1.618 level: 3,592
2.618 level: 4,861
4.236 level: 6,915
The highest Fibonacci level is 4.236. These are not near-term targets, but a roadmap. The extensions only come into play if the 2,807 high is broken.
First, the low needs to hold. If it does, the 0.236 level I marked on the chart will be the target at 1,838.
I don't think the 1,538 low will be br
post-image
ETH-1.26%
Trenches
IDOL
I
bade
b
IDOL
0x3b...ab07
Market Cap
$.
Change
.
24h Vol
$.
Holders
.
PIEVERSE
P
bade
b
PIEVERSE
0x0e...25a9
Market Cap
$.
Change
.
24h Vol
$.
Holders
.
JAGENT
J
bade
b
JAGENT
0x8e...ae15
Market Cap
$.
Change
.
24h Vol
$.
Holders
.
Singularity
S
bade
b
Singularity
7R4M...pump
Market Cap
$.
Change
.
24h Vol
$.
Holders
.
CLAUDIA
C
bade
b
CLAUDIA
2j5S...W2ZM
Market Cap
$.
Change
.
24h Vol
$.
Holders
.
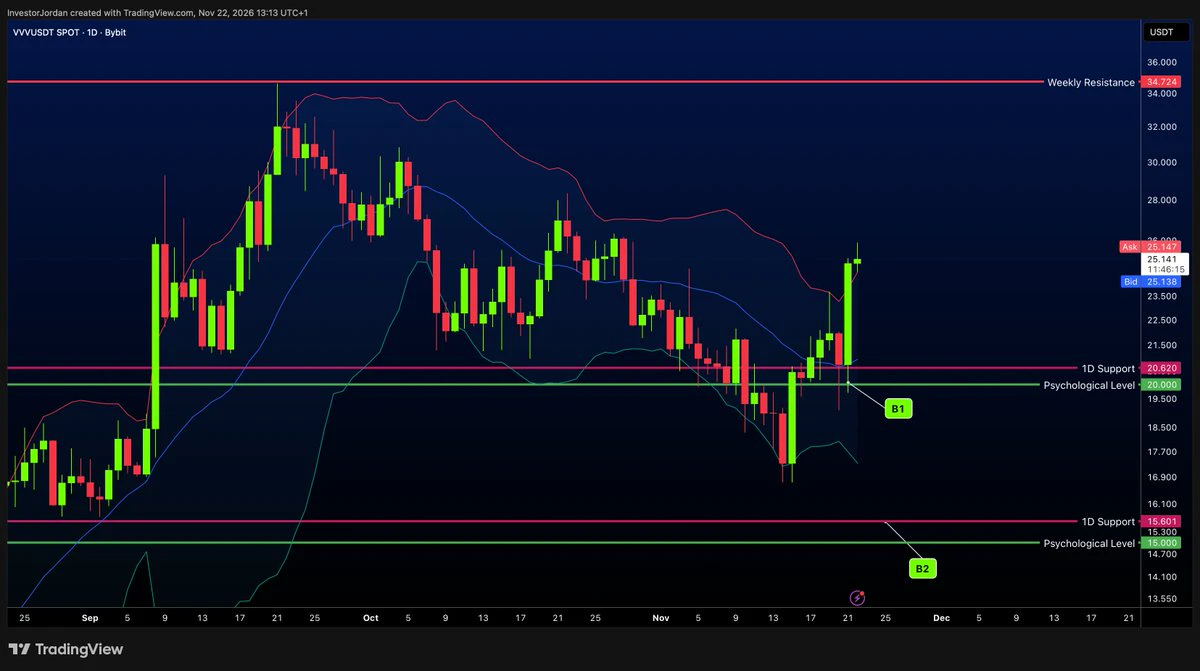
Can we take a moment to appreciate the INSANE strength in $VVV?
While the rest of the market has been selling off, VVV has bounced almost perfectly from our Buy Zone and is already up 27% in just 2 days.
Absolute strength.
post-image
VVV-1.61%
Analysis hot crypto coin
live-cover
LIVE2,292
ETH-1.26%
BTC-0.67%
GT-2.41%
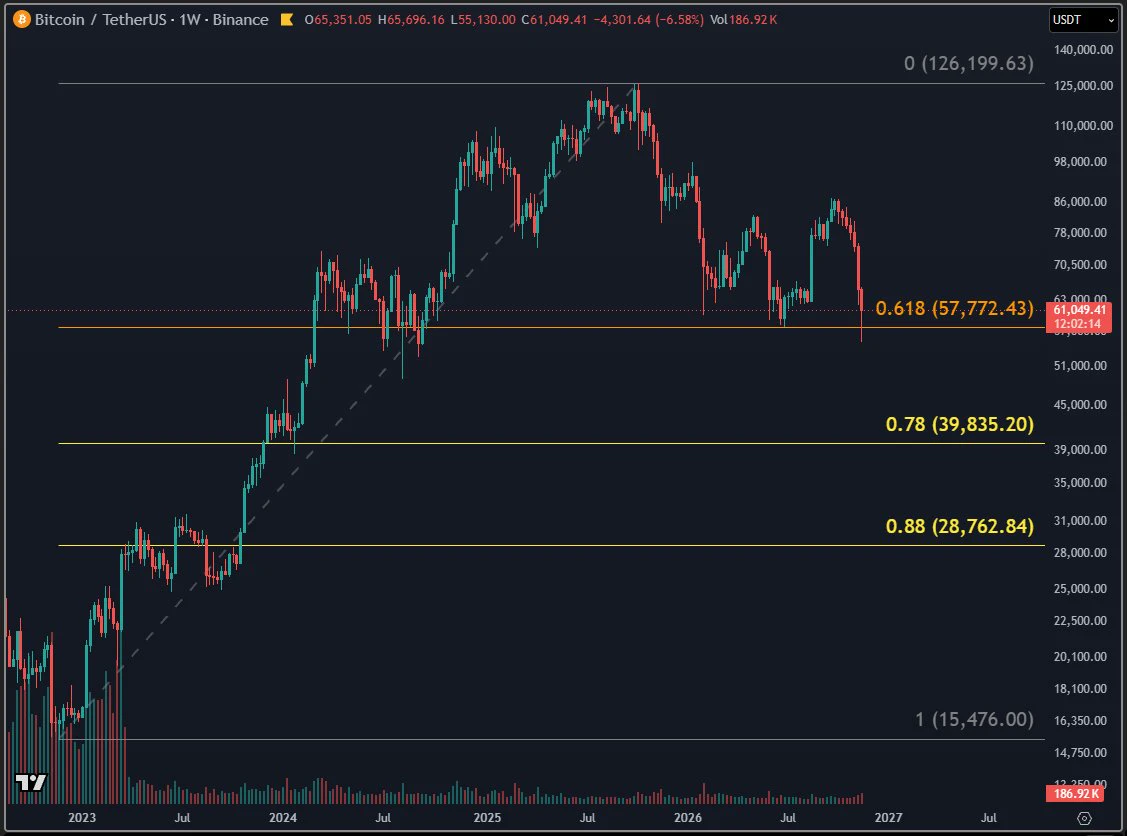
An answer to the many questions about Bitcoin’s bottom.. $BTC
Most people talking about the bottom and drawing squares and lines are making it all up
They hide the fact that they’re using Fibonacci so you won’t know why they chose that number
Bitcoin tested the golden Fibonacci level at $57777 .. 0.618 🧡
The bottoms they’re talking about are nothing but Fibonacci levels
The $39800 price is Fibonacci 0.78 💛
They believe it could extend to $28700, Fib 0.88 💛
Meaning their numbers aren’t based on trading experience or even a technical price pattern .. just free Fibonacci measurements from the
post-image
BTC-0.67%
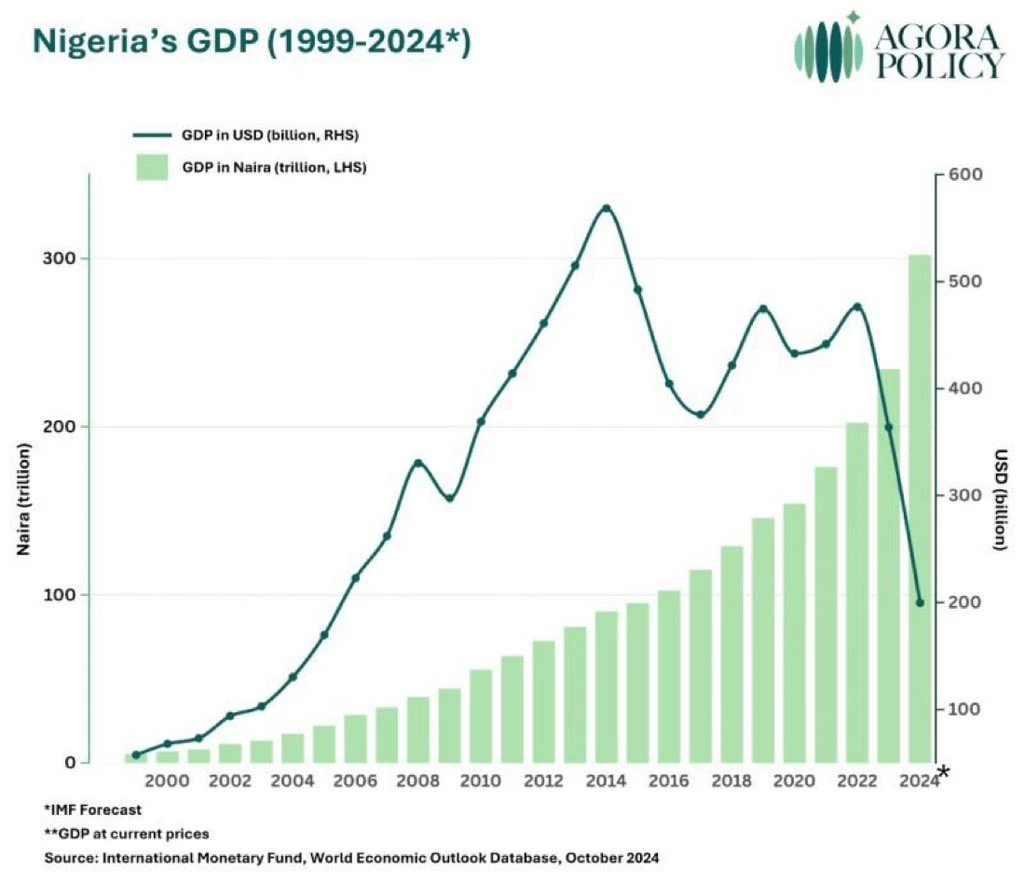
As an Trader/Analyst seeing this I’ll tell you first hand that NIGERIA is doomed if APC rules us again in 2027 🤧.
See as chart Dey do break of structure to the downside Dey go 😭
post-image
BTC Fall below 60k
live-cover
LIVE3,219
BTC-0.67%
$PI There are lots of things with an M in the Pi ecosystem now. Does having an M mean it’s been approved? I feel like it’s going to skyrocket and reach 30 USDT in a very short time
PI-0.60%
  • 3
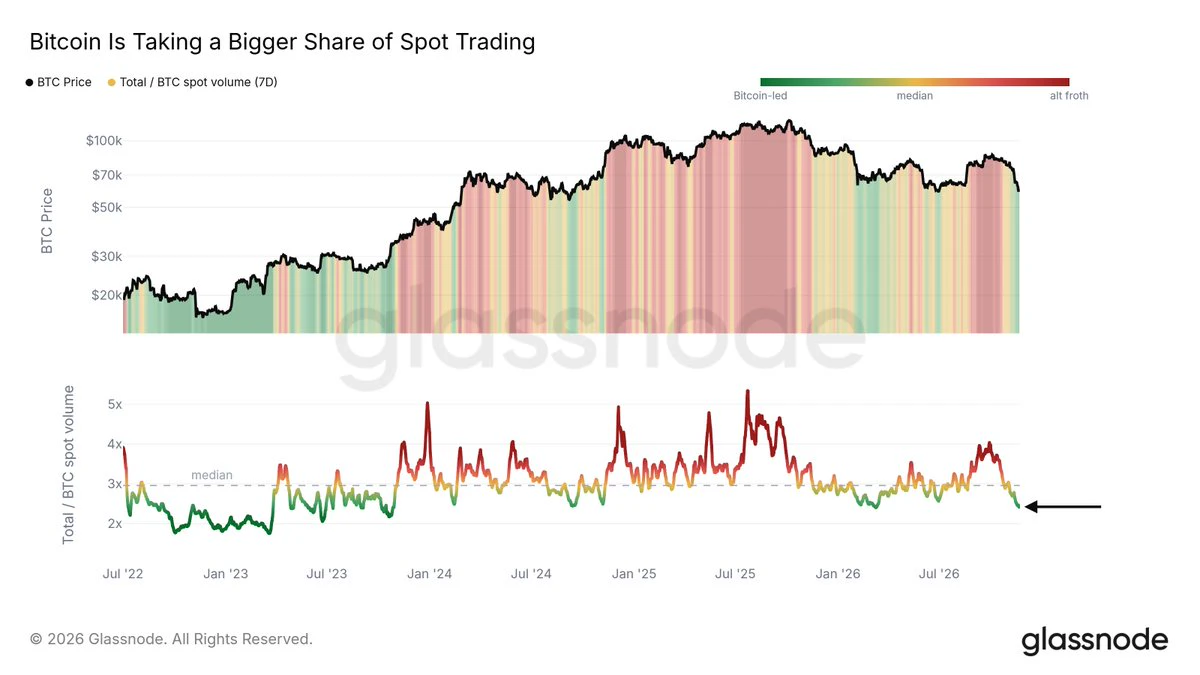
The altcoin froth is gone.
In late September, total spot volume was 4x Bitcoin's. Today that ratio is below the summer lows.
In risk-off markets, capital tends to consolidate into bitcoin:native.
In risk-on markets, this capital moves back into riskier assets.
post-image
BTC-0.67%
  • 2
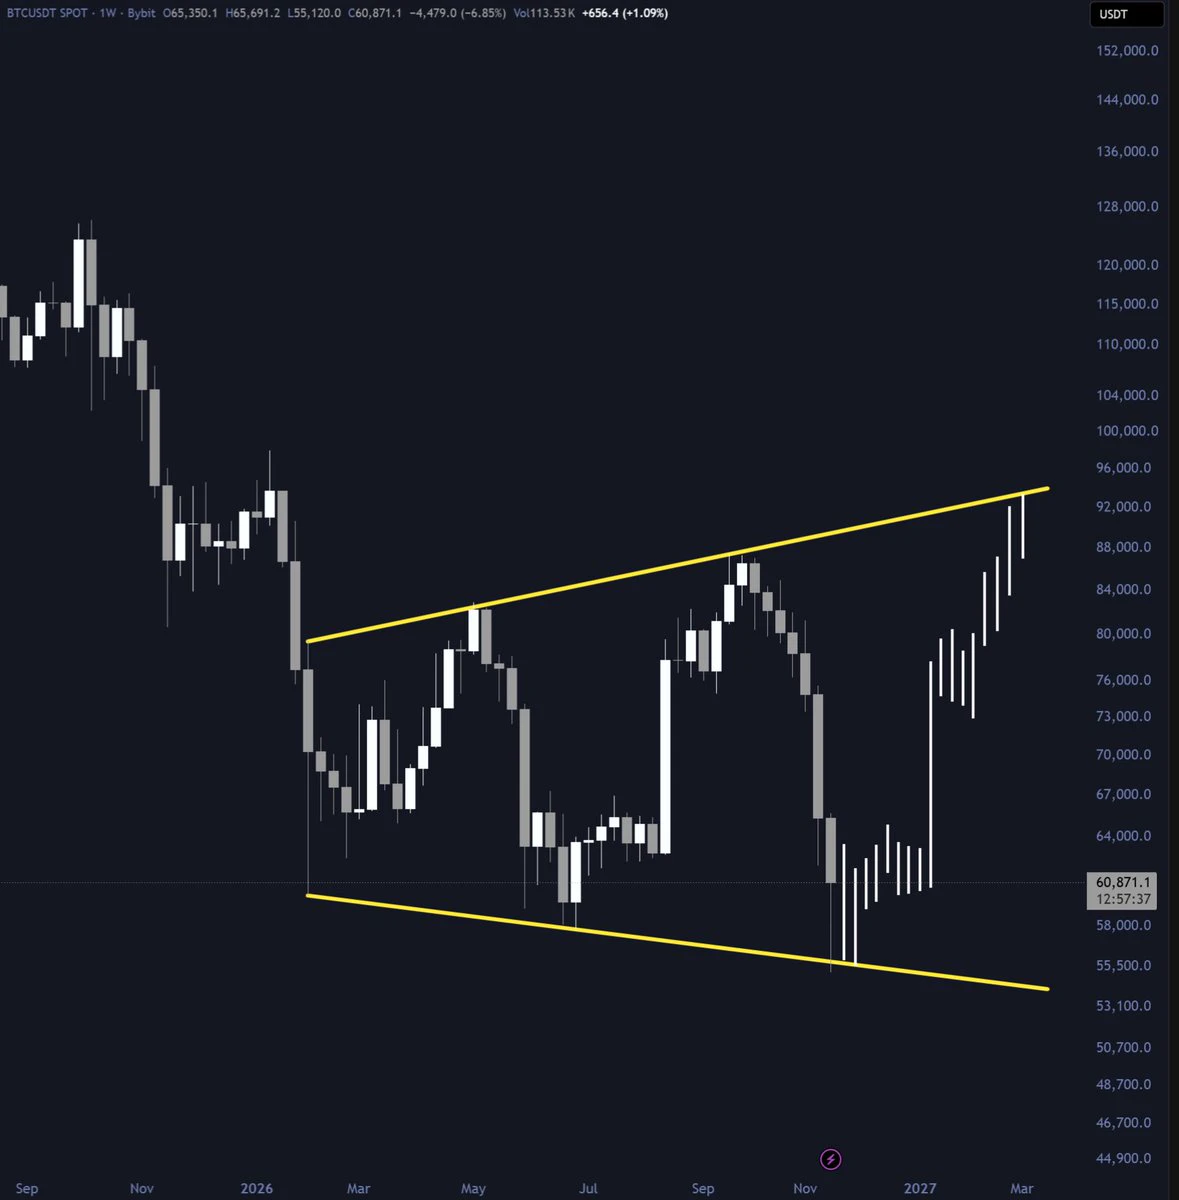
$BTC has tapped the lower channel
Last 2 times this happened, Bitcoin rallied 35% or more
Will history repeat again?
post-image
BTC-0.67%
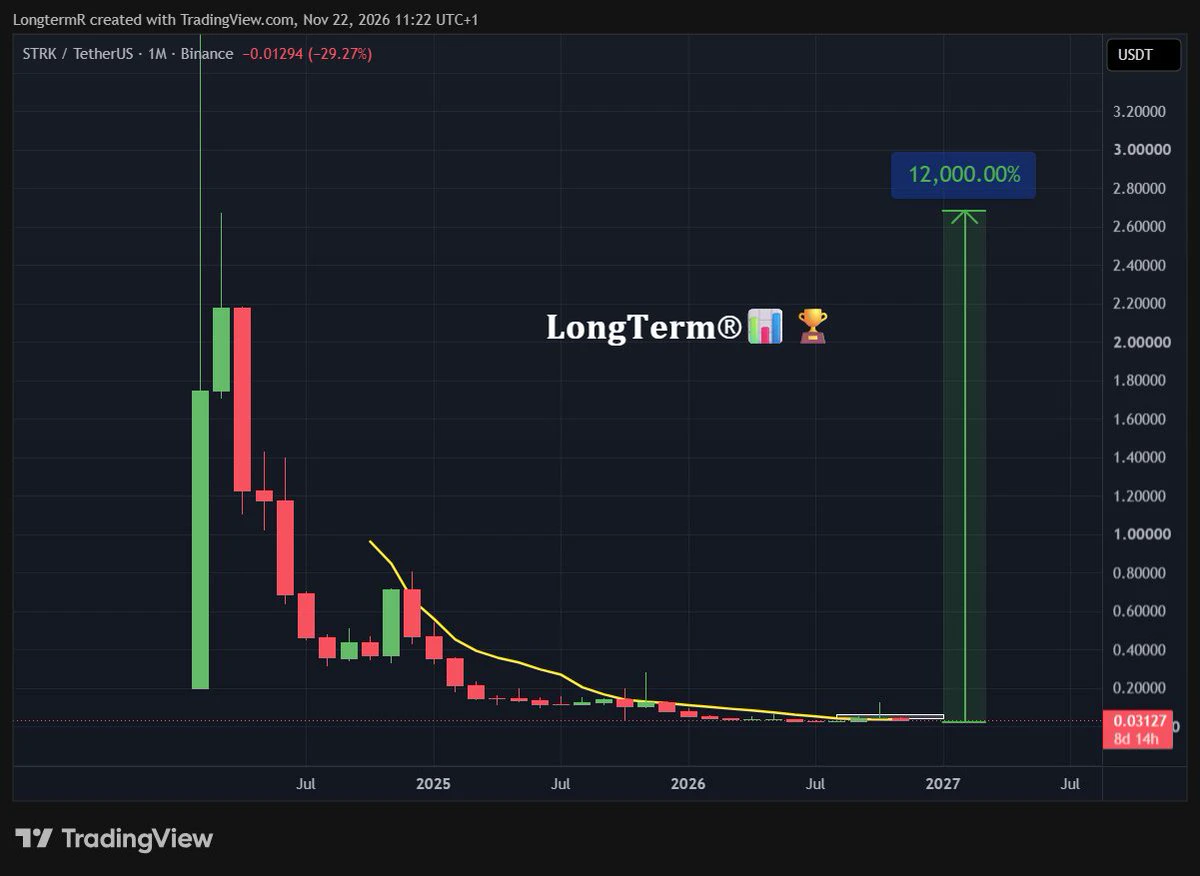
$STRK shipped its v0.14.4 mainnet upgrade in October, with room for much bigger proofs.
StarkWare also cut the cost of verifying post-quantum signatures in half this month.
Price has been building a base for almost a year now. Quiet, but holding.
post-image
STRK-3.55%
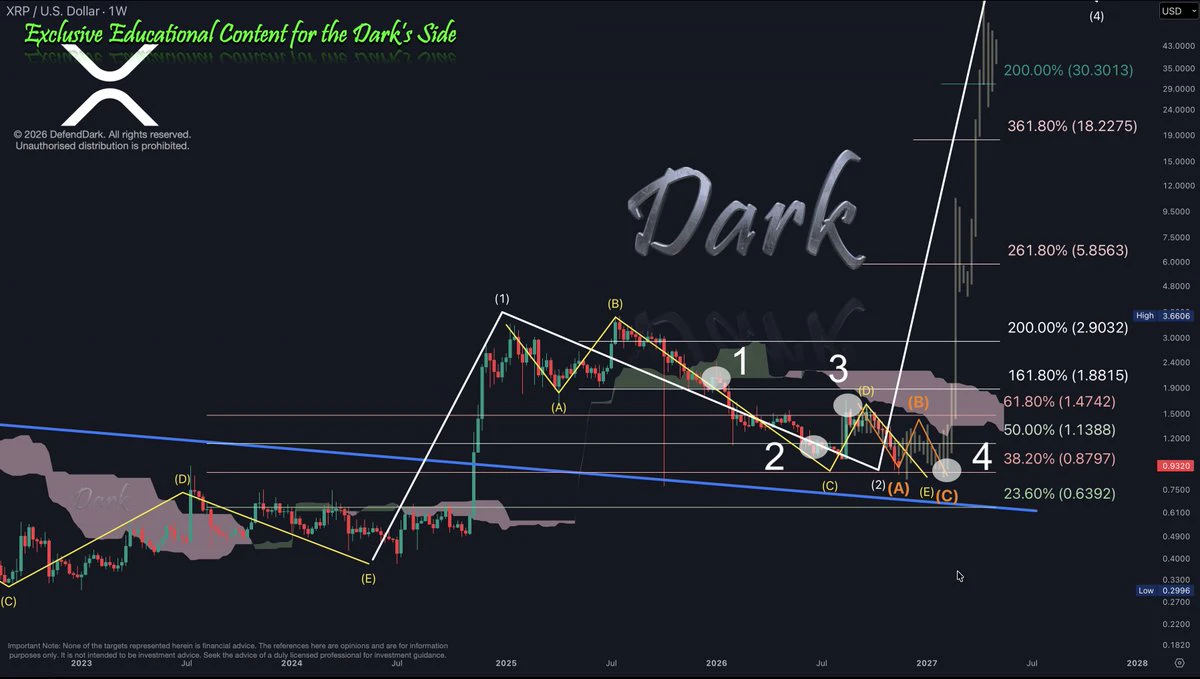
$XRP Weekly – the hardest correction, in four points
1. The flat was complete. ABC Wave from the Wave 1 top, done by the book.
2. The Wave C expanded. The regular flat became an expanded flat, down to $0.9852. Same three letters, a longer last leg.
3. The run to $1.6992. We called it a new wave, on one condition: the pullback had to keep $1.
4. $1 broke. So that run told us ABC wanted to further expand technically. We named our Wave 1 as Wave D when $1 can't hold, and we are now in Wave E.
ABCDE instead of ABC. Two moments that looked like the end, before the real one arrives.
What didn't chan
post-image
XRP-1.15%
$HUMA Short. Entry price 0.00839, exit price 0.00798, stop-loss price 0.00862. That's it. 🔴 Short entry: 0.008353–0.008395Take profit: 0.008225 / 0.008125 / 0.007976Stop-loss: 0.008623Analysis: - Price at 0.00837 is below the 4-hour EMA50 (0.00870)· Current momentum favors sellers- Stop-loss distance is 3.0%, and the third take-profit target is 4.8% away; if fully reached, the risk/reward ratio is about 1.6RNot investment advice. You are responsible for your own risk.
post-image
HUMA-1.99%
Why Has Making Money in Crypto Become So Difficult?
[Plain-Language Introduction] The crypto market once resembled a no-holds-barred casino, but now that the house has taken full control of the rules, the era of easy money is well and truly over.
This article takes an in-depth look at four ways insiders fleece the market: insider trading, derivatives market manipulation, sky-high fake valuations, and shitcoin rug pulls—and reveals how funds are being drained from the market by a small group of people.
As blind mania fades and the false boom collapses, only businesses that solve real problems w
post-image
$PIEVERSE When it directly reaches the trendline like this, you can go long.
post-image
PIEVERSE+0.58%
  • 1
Weekend news:
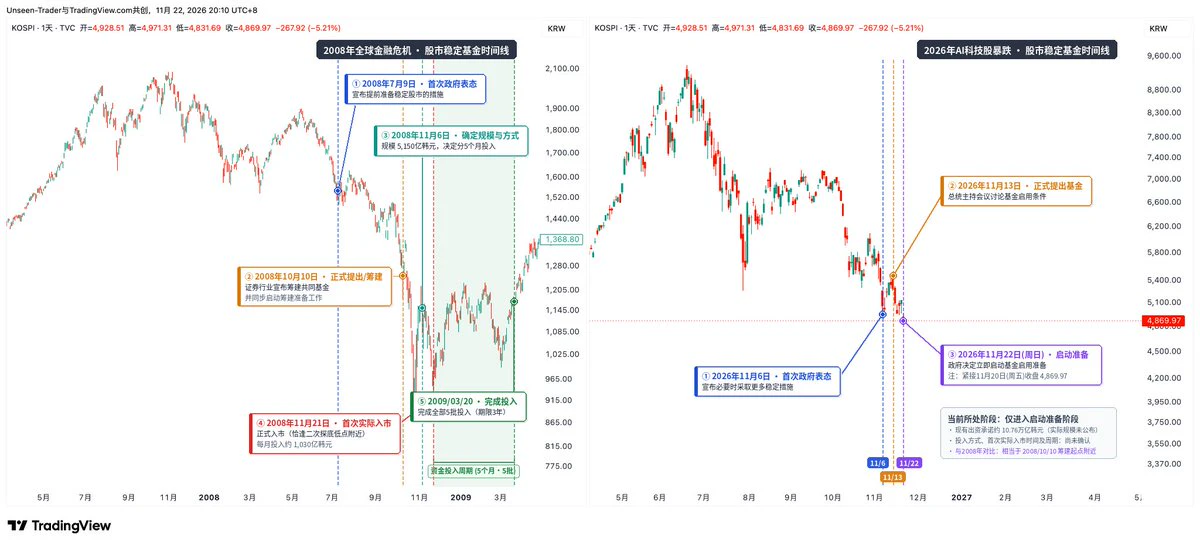
The South Korean government has decided to begin preparations for a stock market stabilization fund.
The last time South Korea deployed a stock market stabilization fund was November 21, 2008.
A comparison of the 2008 timeline with this time is listed; the K-line chart offers a clearer view.
Looking at 2008, the government’s signal that it was preparing to stabilize the market and its announcement that it would establish a stock market stabilization fund briefly boosted the market.
Ultimately, the market bottomed between the first tranche of funds entering the market on November
post-image
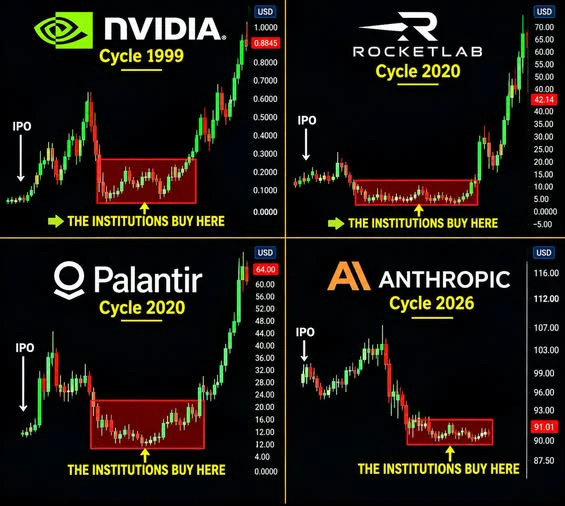
🚨 The biggest opportunities often look like the worst times to buy!
Look at NVIDIA (1999), Palantir (2020), Rocket Lab (2020): different industries, same pattern: long consolidation, painful correction, powerful rally.
Are these smart money accumulation zones, or are we just connecting dots after the rally?
👇 Pick a side: SMART MONEY ACCUMULATION or MARKET HINDSIGHT? Show your evidence.
Historical comparisons are not guarantees. Scenario analysis only, not financial advice.
post-image
NVDA-13.84%
PLTR-6.45%
RKLB-10.82%
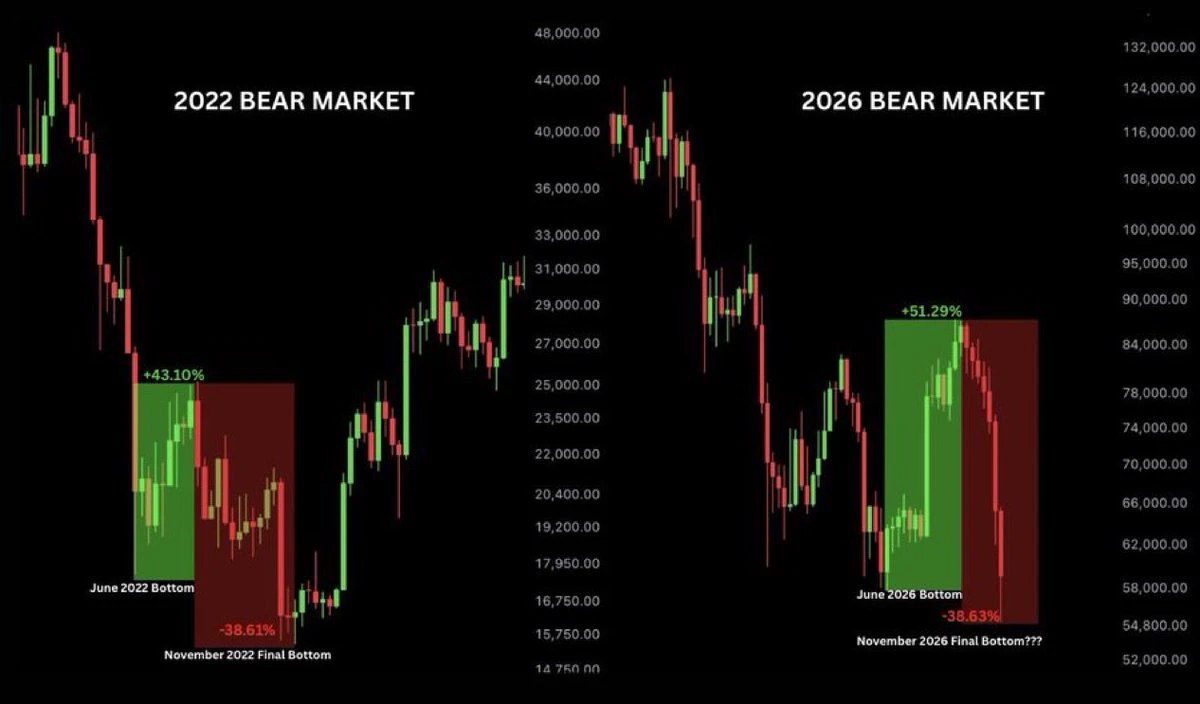
bitcoin:native 2022 pattern is repeating ?
In 2022:
• June bottom → +43.10% rally
• Then a -38.61% correction
• Final bottom came in November.
In 2026:
• June bottom → +51.29% rally
• Now down -38.63%.
Could November 2026 mark the final bottom again?
History doesn’t always repeat, but the similarities are worth watching.
post-image
BTC-0.67%
I changed my mind. $BLESS A 24.70% bullish candle like this is treated by many as a textbook example of a “high-volume breakout,” with 236.2M in trading volume seen as ironclad proof that money is flowing in. I used to see it that way too, but after reviewing several similar tokens, I realized that argument doesn’t hold up.
High trading volume doesn’t mean big money is buying. It only means a lot of turnover, with both buyers and sellers pushing hard. Genuine buying shows up as the price holding firm and not breaking down on a pullback, not as a one-day jump from 0.0107 to 0.0148 followed by
BLESS-2.00%
  • 1
  • 1
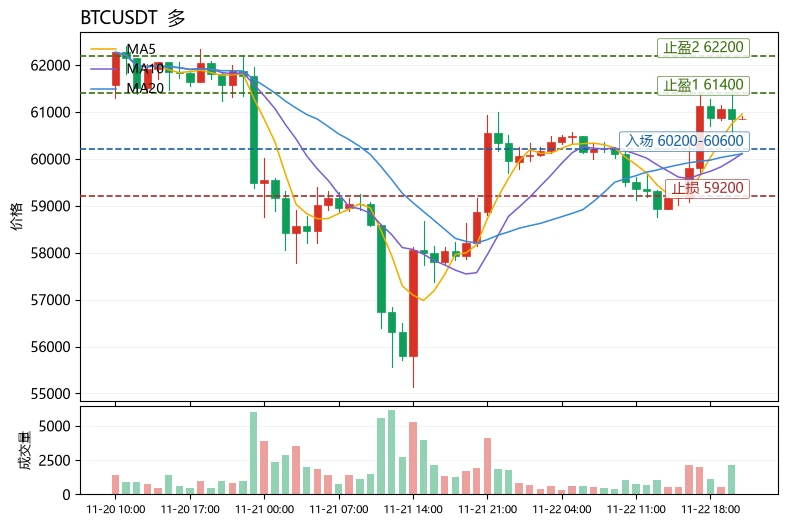
The Fear & Greed Index is only 11, yet prices are rising. Can this rebound be chased? Yes, but only with a small position in the direction of the trend—not a heavy bet.
$BTC Current price: 60864.1, up 3.47% over 24h. MA5=60953.4 has crossed above MA20=60107.5, the MACD histogram at +139.7 remains bullish, and RSI=60.4 still has room to rise. The key contradiction lies in the flows: the funding rate is +0.0031%, with longs paying a small fee to hold positions, indicating leveraged longs are actively taking sides. But extreme fear means the short squeeze may not be over, and the probability of
post-image
BTC-0.67%
RARE-0.89%
ADA-1.48%
Load More

Join 40 M users in our growing community

⚡️ Join 40 M users in the crypto craze discussion

💬 Engage with your favorite top creators

👍 See what interests you

Trending Topics

BTCReboundFaces60KTest

2.1M Views30.1K Discussing

BTC rebounded from around $55,300 on November 21, briefly reclaiming $60,000 before pulling back to around $59,300. The $60K level is back in focus as traders assess whether the recovery can last. Is this rebound a sign of stabilization or a short-lived recovery? Would reclaiming and holding $60K be enough, or do you need confirmation from trading volume and fund flows?

PCEAndGDPDataNextWeek

259.5K Views2.6K Discussing

GateDirectIPOPhase3ANTAllocates92100Shares

837.2K Views5K Discussing

View More