Square
Following
Hot
News
Notifications
Profile
Share your thoughts
placeholder
Article
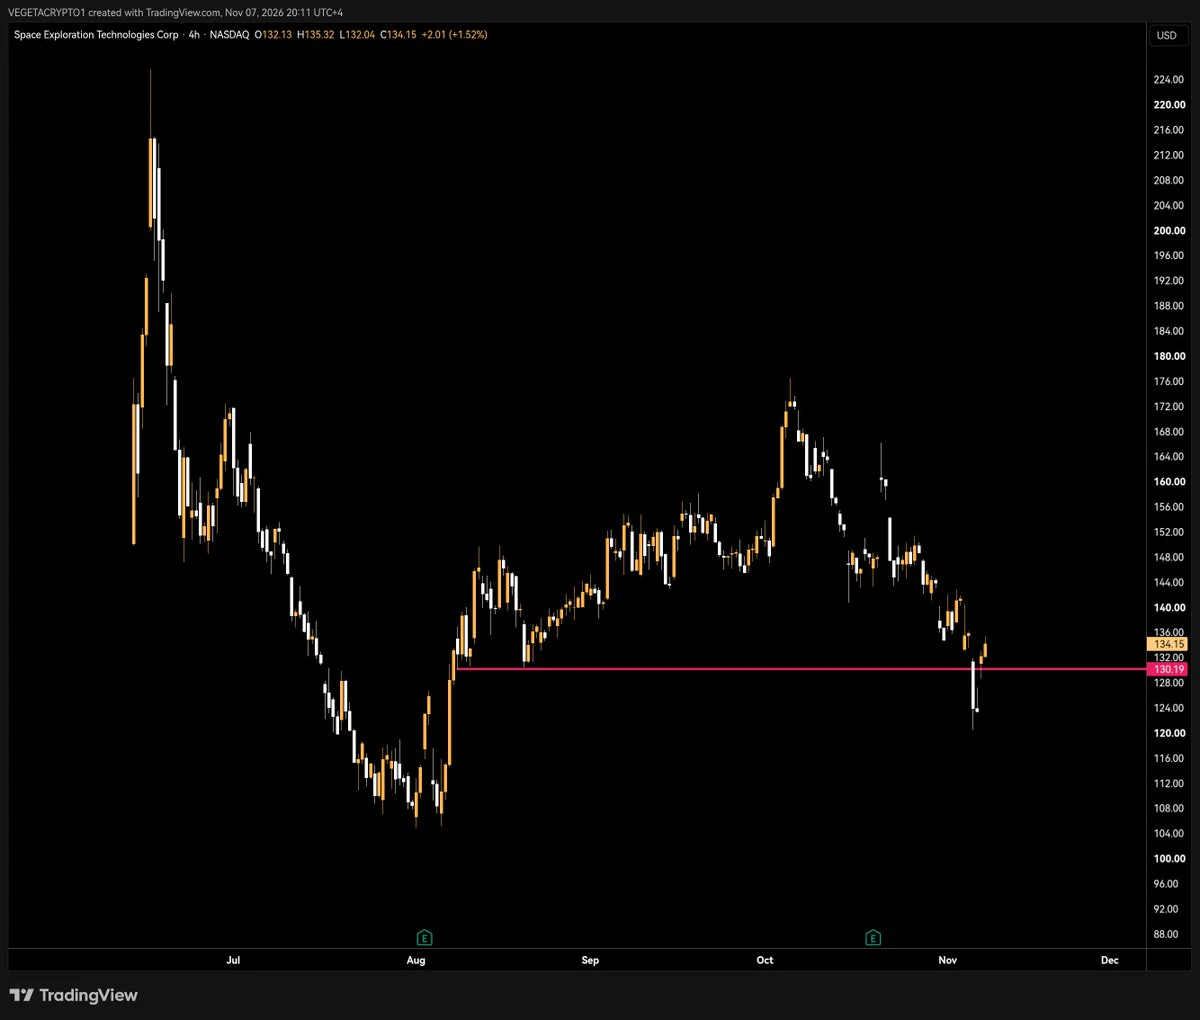
$PUMP & $STONK
Both approaching critical support levels. This is a defining moment for both charts.
If you're looking to buy these levels, that's perfectly fine, but risk management is essential. Be prepared to cut the position quickly if support fails.
A loss of support on $PUMP could expose price to another 25% downside before reaching any meaningful support. $STONK is potentially even more vulnerable, with significant market inefficiencies below current price that could leave the door open to a further 50% downside.
These are high-risk levels. The potential upside is there, but protecting y
PUMP+6.67%
STONK+11.55%
  • 1
#USAIStocksHitHard
ETH/USDT Technical Analysis

Ethereum is currently trading around 2,232 on the daily chart. The overall trend remains bearish, as the price is below MA5 2,280, MA10 2,268, and MA30 2,368.

The first support zone is 2,218, followed by 2,173. If these levels break, further downside pressure may develop.

On the upside, 2,253 is the first resistance. A breakout could push ETH toward 2,268–2,281, with 2,410 as a stronger resistance.

For now, ETH remains in a weak consolidation phase. A confirmed breakout is needed before expecting a stronger recovery. Volatility remains high,
ETH-1.26%
  • 6
  • 2
Trenches
ZIG
Z
bade
b
ZIG
0x8c...1145
Market Cap
$.
Change
.
24h Vol
$.
Holders
.
BTC
B
bade
b
BTC
C5xp...pump
Market Cap
$.
Change
.
24h Vol
$.
Holders
.
IDOL
I
bade
b
IDOL
0x3b...ab07
Market Cap
$.
Change
.
24h Vol
$.
Holders
.
scamsem
s
bade
b
scamsem
41Wp...pump
Market Cap
$
Change
.
24h Vol
$.
Holders
.
DOGE
D
bade
b
DOGE
DoGE...fm7R
Market Cap
$.
Change
.
24h Vol
$.
Holders
.
“Every Penny You Earn Is Another Person’s Loss”
A lot of people don’t like hearing this, but it’s the nature of futures trading.
Futures are a negative-sum game
Futures themselves create no value; they only transfer money from one person to another.
And every time money changes hands, the exchange takes a fee, while longs and shorts also pay funding fees to each other.
So the total amount of money on the table keeps shrinking.
There’s only one reason you can make money: someone else loses more than you do.
Let’s do the math: a 0.1% fee for opening and closing a position, 5 trades a day, and 1,
post-image
BTC-0.65%
ETH-1.23%
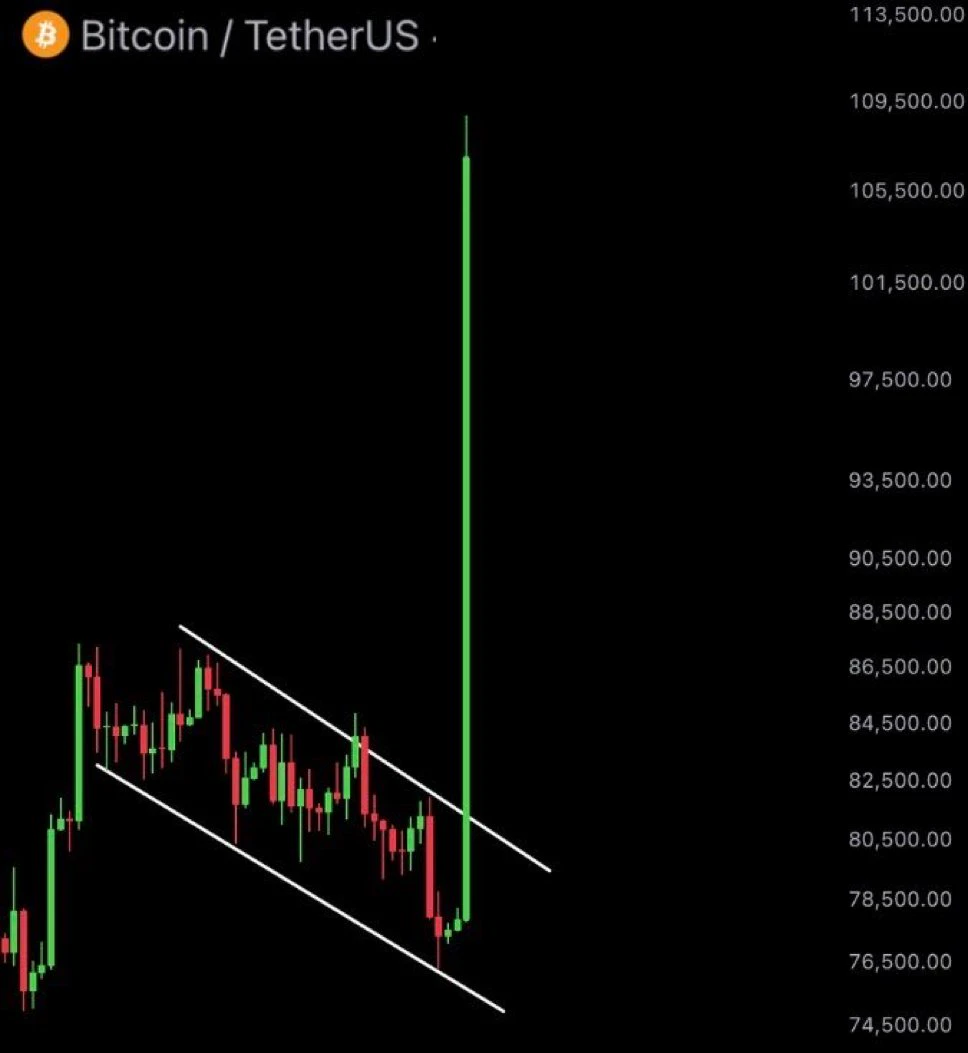
When bitcoin hits $120K in the next 12 months.
you’ll wish you had bought more today at $75K.
post-image
$COTI broke strongly to the upside after a prolonged decline, with a strong 1-hour green candle reclaiming the $0.0100 level. Market momentum is shifting toward buyers, and if the price holds above $0.01021, it could rise further. Key level: $0.01021. Before entering, watch to see whether the price can successfully hold the breakout zone. Avoid chasing the initial spike. Buy and trade $TRUMP SNDK
post-image
COTI-2.75%
TRUMP-0.95%
Since the start of 2026, approximately 139,000 $BTC
have been added to the on-chain supply, but the price has not followed the supply curve—it is down 13.44% year to date, sliding from around $87,000 to the $75,000 level. The funding side is more worth watching: Bitcoin ETFs have recorded net outflows of $850 million year to date, including $411.9 million in single-day net outflows on November 6. Outflows of this scale in a single day are uncommon in ETF history. Meanwhile, the number of holding addresses has climbed to 57,226,850, up about 3.66% from the start of the year, indicating that re
post-image
BTC-0.67%
OpenAI Keeps Long-Term Infrastructure Spending Intact Amid Political Uncertainty
live-cover
LIVE568
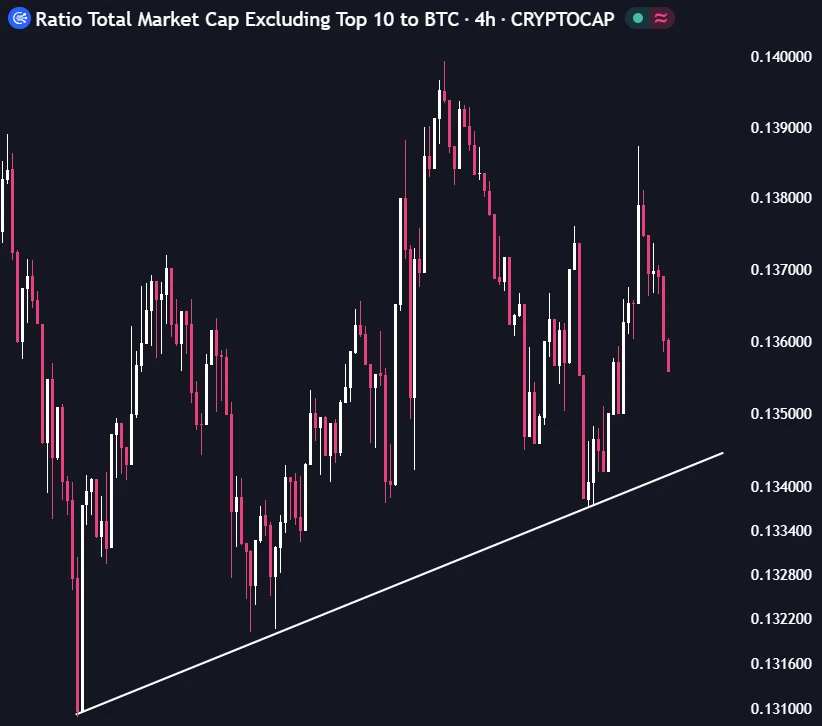
Altcoins vs. BTC look very different from the rest of the markets
When BTC goes down during a global selloff, you expect alts to drop more
But right now, the exact opposite is happening
It looks like altcoins have reached the sellers exhaustion zone
post-image
BTC-0.67%
Today Market Trend
live-cover
LIVE1,657
my weakly screen time report just came in.
X: 69 hours.
sleep: 4.20 hours, all of them during a video about sleep.
coffee: the tumbler was refilled 6.9 times. on twosday.
post-image
That's why I work
Theses simple moments
No rolex, no cars. Peace and Freedom
post-image
It's late; let's take another look at the market.
The latest quotes are in, and prices have slipped a bit further. Our current long positions are temporarily underwater. Don't panic—keep your emotions in check and do the math:
$ET: Average entry price 2247.05, current price 2232.41, unrealized loss of -12.95U (ROI -12.95%). Ethereum has slipped along with the broader market. The pullback is still within an acceptable range, the margin ratio is 970%, and there's still a substantial buffer above the liquidation price of 2144.

$DOG: Average entry price 0.0724272, current price 0.0721356, unreali
post-image
ETH-1.23%
DOGE-0.18%
SOL-0.74%
#AITechSelloffPutsCryptoUnderPressure
The recent sharp fluctuations across global financial markets highlight a coordinated phase of technical deleveraging and structural capital reallocation. A significant single-day sell-off, heavily concentrated in high-beta technology sectors and digital assets, was quickly met by a technical recovery driven by retail capital and the stabilization of passive rebalancing flows.
Rather than indicating a systemic collapse, institutional metrics reveal a calculated risk-management cycle. Many prominent hedge funds had actively reduced their net exposure to ov
NVDA+2.80%
AMD+11.55%
WDC-1.36%
BTC-0.67%
ETH-1.26%
  • 1
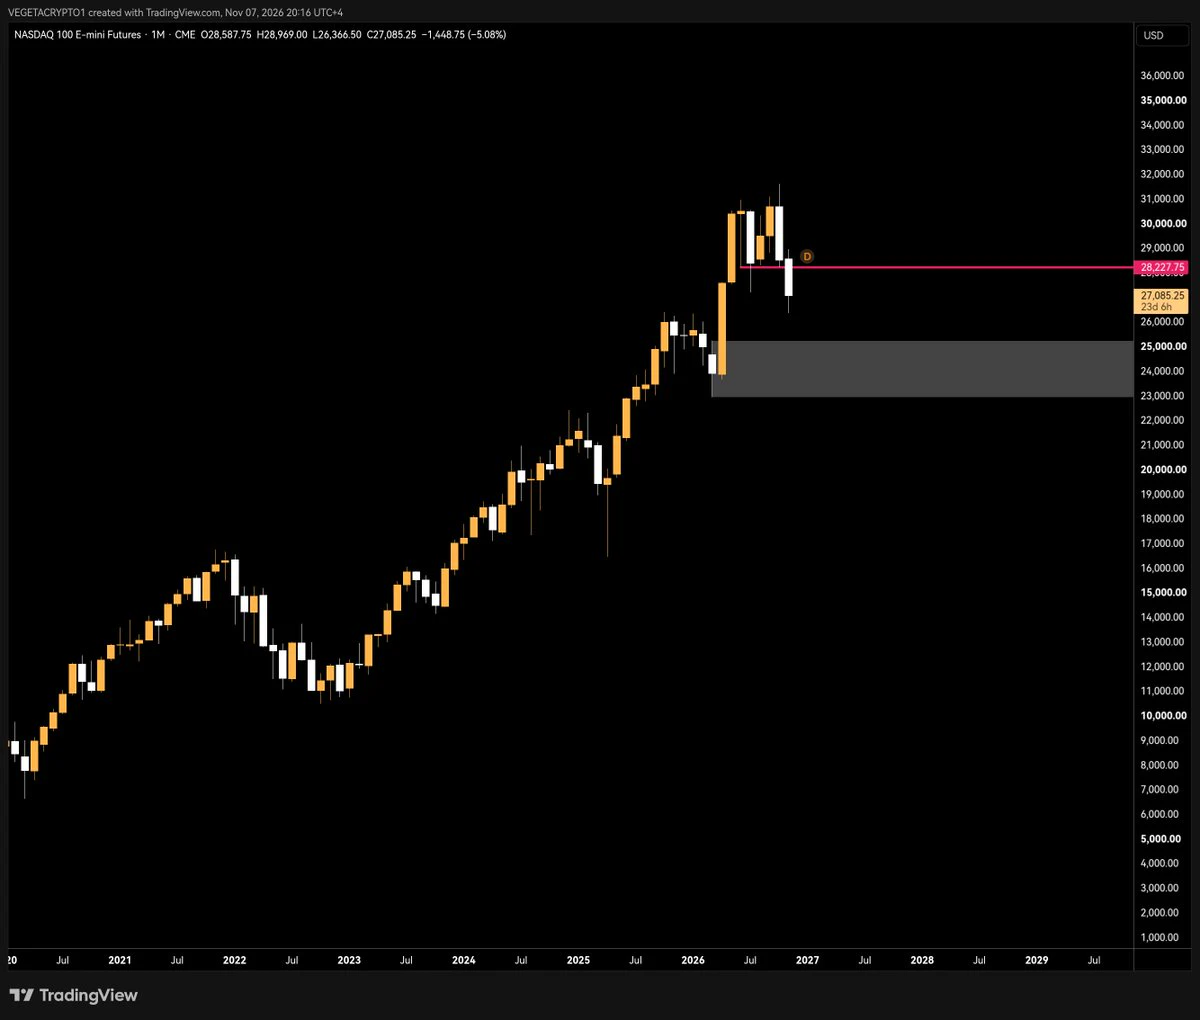
$nq monthly ms break in progress, too early in the month, but keep an eye by EOM.
post-image
#BTCETFOutflowsContinue 🔎

Outflows from Bitcoin ETFs have raised the question: is institutional capital losing confidence in Bitcoin? U.S. spot Bitcoin ETFs saw a net outflow of approximately $870 million over the course of the week, as weak institutional demand and macroeconomic uncertainty intensified selling pressure.

This development is particularly noteworthy because spot Bitcoin ETFs have become one of the primary channels through which traditional financial institutions, asset managers, and professional investors gain exposure to Bitcoin. However, a crucial distinction must be made:
BTC-0.67%
ETH-1.26%
  • 13
  • 5
$SWARMS Market cap of 6 million; volume is picking up at the bottom, so it's definitely about to rise. A 10x gain is worth positioning for—go long!!!
post-image
SWARMS-3.61%
Gold Weekend OTC Trading + Next Week Analysis
(November 7 evening; prices and levels are subject to the latest market data)
I. Weekend OTC Gold Status
Mainstream spot and COMEX futures markets are closed.
Current quote range for tradable weekend OTC gold: 4065–4075, consolidating narrowly around 4070, with extremely light trading, wider spreads, and almost no directional movement.
Friday closing price: 4070–4072 (spot around 4071, futures around 4075).
After nonfarm payrolls exceeded expectations (+165k), gold retreated from its highs but held the key 4000 level; no further breakdown occurred
XAUUSD-0.45%
  • 1
Some charts deserve a little extra attention, and $ZIG is one of them.
The bigger picture is getting interesting, but I'm more focused on how the market reacts at these levels than making predictions too early.
If momentum starts building, we could see some serious excitement around $ZIG in the next bull phase.
No chasing, no rushing. Just watching how the story unfolds.
Could be an interesting one to follow.
ZIG-8.79%
  • 1
$SPCX good sweep if it can hold against the market.
post-image
SPCX+0.78%
#AI科技股大跌加密市场承压 #WCTCS9 #BTC行情分析 Bitcoin fell to $74,888, an 11-week low: Why 67% of traders are still long is the real problem

At 8 a.m. today, Bitcoin hit a low of $74,888. That was its lowest level since August, a new 11-week low.
But at the same time, if you look at the price change, you’ll find a puzzling number: it was down just 0.3% over the past 24 hours. It hit a new low, but didn’t fall much further. That contrast is the most noteworthy thing today.

1. First, let’s look at the numbers across three time frames
Looking at just one day can be misleading; we need to consider three time
post-image
BTC-0.65%
Load More

Join 40 M users in our growing community

⚡️ Join 40 M users in the crypto craze discussion

💬 Engage with your favorite top creators

👍 See what interests you

Trending Topics

USAIStocksHitHard

20.03k Views3.67k Discussing

U.S. stocks sold off sharply on Thursday, November 5 (UTC). The Nasdaq closed down around 5.5%, entering correction territory, while the Philadelphia Semiconductor Index plunged roughly 12%, with chip stocks including $NVDA and $AMD posting steep losses. Beyond profit-taking, investors are growing concerned about the pace of AI data center construction, capital spending, and future returns on investment. The key question now is whether the AI sector’s lofty growth expectations need to be repriced. Where do you think the next opportunities will emerge: chip stocks, tech giants, or other sectors?

USNonfarmPayrolls

31.86k Views4.33k Discussing

StakeOnLaunchpoolToShare450KVLX

8.28k Views822 Discussing

View More