





Share your thoughts
placeholder
Article
Gate New Listing: $STONKBROKER
🔹 Trading pair: $STONKBROKER / $USDT
🔹 Trading time: September 7, 19:00 (UTC+8)
🔹 0-fee swap start time: September 7, 20:00 (UTC+8)
Go to trading: https://gate.com/zh/trade/STONKBROKER_USDT
Go to swap: https://www.gate.com/zh/convert/USDT/STONKBROKER
Learn more: https://www.gate.com/zh/announcements/article/101592
post-image
🚨 JUST IN: OpenAI chief scientist Jakub Pachocki calls for “extreme caution” as AI capabilities rapidly advance.
My hand trembled slightly when I set the stop loss a few days ago; this morning, I realized that filial devotion had been unnecessary. 😂
The last thing I saw before bed, $TOSHI was still ranging around 0.0001169. It hadn’t broken above the key level, but I saw that the key level had never been broken. Before the market had fully started moving, my judgment was: hold as long as the pullback doesn’t break the level; it wouldn’t be too late to exit if it did. That dip a few days ago was pretty scary, and I nearly got shaken out, but the logic hadn’t changed. When I opened the chart this morning
post-image
TOSHI-0.71%
SNDK+0.32%
BTC-0.55%
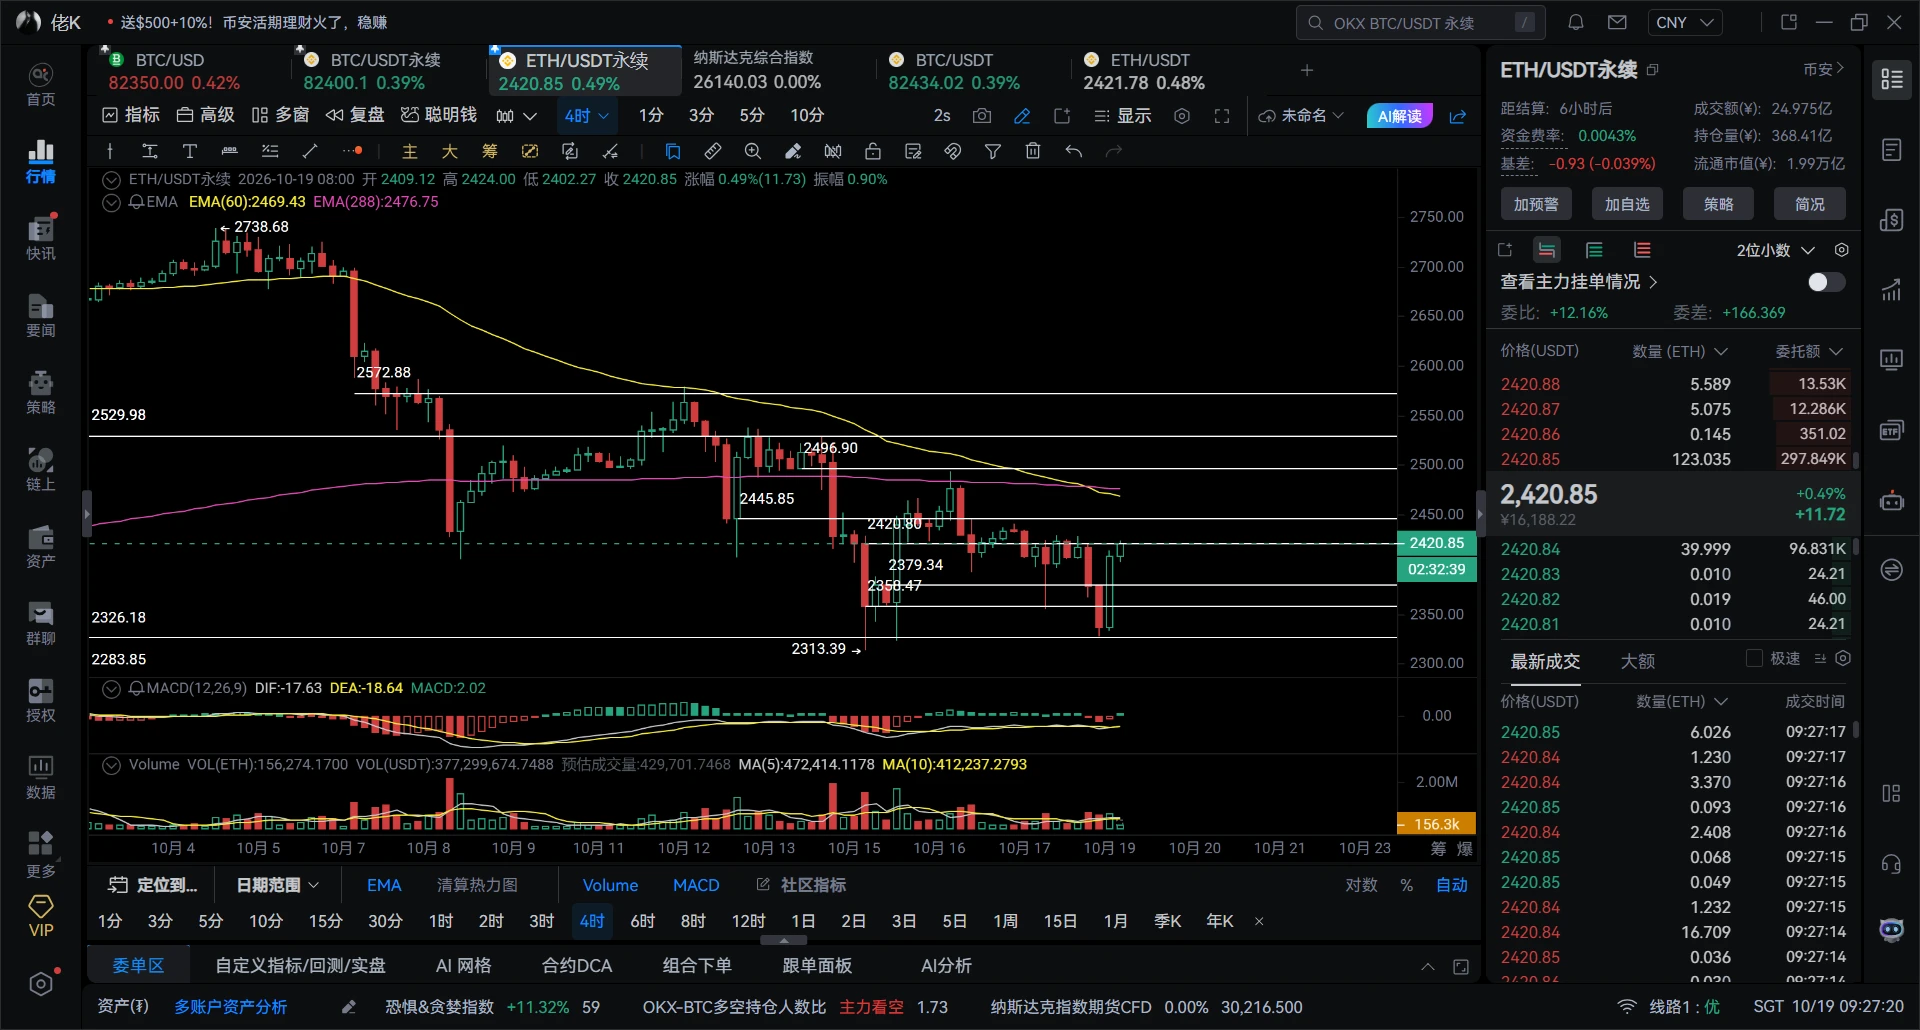
Early morning on 9.8 $BTC analysis
Yesterday morning, I was bearish from 80500 down to 78700, then turned bullish again in the evening. Bollinger Bands: The price retested the lower Bollinger Band, while the Bollinger channel has not fully converged downward. The lower band is the key short-term defense for bulls. The middle band at 79622 has turned into overhead resistance.
MACD: DIF is running below DEA, and the bearish histogram continues to expand, indicating that short-term bearish momentum is being released, which is normal during a pullback. Once the support below holds, the bearish hi
BTC-0.53%
I did nothing—just went to the restroom, and when I came back, the candlestick chart had already done the work for me. During the intraday bottoming phase, $HYPE hovered around 83.949 for most of the day. It ranged sideways at the bottom without breaking down, so I judged that this wasn’t distribution but accumulation. I told myself then: hold this level and wait for it to show its hand. Bottoming is the biggest test of patience, but as long as the structure remained intact, I chose to believe. 🤣

I opened a long position and then went to take care of other things. When I opened the chart ag
post-image
HYPE-2.21%
ETH+0.24%
BTC-0.55%
Insiders are quietly stacking shorts on SYMBOL while the 1d trend stays flat.

$PONS /USDT - SHORT

Trade Plan:
Entry: N/A – N/A
SL: N/A
TP1: N/A
TP2: N/A
TP3: N/A

Why this setup?
Why now? The 4h bias says SHORT with moderate conviction, so we lean into the sell side. The 15m RSI sits at 41.62, which means momentum is leaning bearish but has not collapsed into oversold yet. The 1h ATR is absent, so we rely on the 4h structure to size risk. The entry reference of 0.7241 gives us a precise level to initiate the short. The daily trend being range-bound means we expect the price to revisit the
PONS-13.00%
Crypto Market and Trading Insights
live-cover
LIVE337
New Gate futures listings: $STONK , $BEN , $ZCAT , $BREW
🔹 Trading pairs: $STONK / $USDT, $BEN / $USDT, $ZCAT / $USDT, $BREW / $USDT
🔹 Trading hours: Now open
🔹 Supports 1 - 10x leverage, trading bots, and copy trading
From STONK and BREW’s multi-asset launchpad, to BEN’s stock rewards mechanism, to ZCAT’s anonymous cat and ZEC rewards, four hot projects bring together MemeFi, stock, and privacy narratives
Trade $STONK: https://www.gate.com/zh/futures/USDT/STONK_USDT
Trade $BEN: https://www.gate.com/zh/futures/USDT/BEN_USDT
Trade $ZCAT: https://www.gate.com/zh/futures/USDT/ZCAT_USDT
Trade
post-image
STONK-2.41%
BEN-52.55%
ZCAT-27.23%
BREW-57.74%
ZEC-4.37%
$SOPH I lost 110k U last week because I chased the AI narrative without setting a stop-loss. I’ve recovered now because I’ve learned to let the data speak. SOPH is currently at 0.0052, up 25% in 24 hours, with a high of 0.0055 and a trading volume of 78 million U. This kind of volume can’t be generated by retail traders alone.
Key point: It has already risen 30% from 0.0041, but without massive volume, which indicates that the chips are still in the hands of the main players. My plan: don’t chase at the current price; buy on a pullback to 0.0048–0.0050, set a stop-loss at 0.0045, and target 0.
SOPH+28.70%
WLD+12.07%
A few days ago I was still calculating whether I had enough money for instant noodles this month; this morning I was already wondering whether to add sausage. 😂
As the market repeatedly swung back and forth, I kept my eyes on $XAUT . Each rebound was weaker than the last, with volume getting smaller and smaller. This rhythm clearly showed the bulls losing their nerve first; there was no real buying support, and any move up was simply handing short sellers an entry point.
So I placed a short at 4486.7 and took profit at 4407, bringing the account a +165.12% gain. It was truly tedious at first,
post-image
XAUT-0.22%
LAB-2.60%
ADA+1.05%
#USAugustNFPBeatsExpectations
US August Payrolls Beat Forecast And Lift Mood
US job data for August came in stronger than forecast, giving a fresh boost to confidence about the labor backdrop. Hiring held firm, jobless claims stayed low and wage gains showed steady progress. The upside surprise eased fears of a sharp slowdown and put focus back on resilient consumer demand heading into the final stretch of the year.
① Broad Hiring Across Core Sectors
Gains were broad, not tied to one niche. Services led the rise, with health care, leisure and business support adding new roles. Goods producer
NVDA+0.87%
SNDK+11.88%
AAPL-2.51%
GT+2.41%
BTC-0.53%
With this trend, I don’t even need to think—the account is dancing on its own. A few nights ago, I took a look at $BEAT before bed. The rebound stalled at 0.1345, a textbook weak rebound, with the price-volume divergence plain as day. I casually placed a short order and treated it as a little bedtime assignment. 😎
I woke up completely stunned: 0.1307, with +55.62% credited. It felt amazing. This move was purely the market being in a good mood and casually sprinkling some gold coins, which happened to land right on my head. The money you make is the monetization of your knowledge; the money yo
post-image
BEAT+5.02%
XRP-0.51%
BTC-0.55%
Everyone winning on my timeline except me.
Send Epp
post-image
I originally just wanted to freeload a breakfast, but the market ended up serving me dumplings for half a year. 🔥
A few days ago in the early hours, $AKE pulled back to around 0.0088431. The key level held, with clear buying support below. After grinding sideways for half a day without breaking down, I went straight long and entered without hesitation. 💪
When I opened the chart this morning, the price had shot up to 0.0159464, handing me +1970.24%. This long trade delivered the answer. It was truly sluggish beforehand, but the breakout feels absolutely great. 😎
In terms of execution, I fir
post-image
AKE+9.46%
ETH+0.24%
BTC-0.55%
$XLM /USDT is range-bound, but the 1h setup hints at a short squeeze nobody is talking about.

$XLM /USDT - SHORT

Trade Plan:
Entry: 0.19221 – 0.19365
SL: 0.19983
TP1: 0.18775
TP2: 0.18430
TP3: 0.17913

Why this setup?
Why now? The daily trend is range, yet the 1h ATR of 0.002876 shows volatility is compressing, which often precedes a directional burst. The 15m RSI at 58.47 is neither overbought nor oversold, meaning the next impulse can run hard without a warning divergence. The entry zone at 0.19293 aligns perfectly with the 1h price, giving a clean trigger for a short bias. TP1 at 0.187
post-image
XLM+5.28%
Insiders are quietly leaning short on SYMBOL while the daily trend stays range-bound.

$BNB /USDT - SHORT

Trade Plan:
Entry: 739.35 – 741.55
SL: 750.98
TP1: 732.55
TP2: 727.29
TP3: 719.39

Why this setup?
Why now? The 4h bias is SHORT with 55% confidence, and the 1h price is sitting at 740.45, exactly at the entry_ref. The 15m RSI at 46.37 shows bearish lean without being oversold, and the 1h ATR of 4.386493 tells us the average candle range is wide enough to reach TP1 at 732.55 and TP2 at 727.29 from the entry zone between 739.35 and 741.55. The invalidation level sits at 728.68, which is
BNB-0.95%
$ZEC /USDT is sitting on a bullish daily trend but nobody is talking about the 15m RSI reading of 47.46.

$ZEC /USDT - LONG

Trade Plan:
Entry: 1162.81 – 1175.23
SL: 1109.45
TP1: 1213.70
TP2: 1243.48
TP3: 1288.16

Why this setup?
Why now? The 4h structure confirms a LONG bias with 95% confidence while the 1h price sits at 1169.02 inside the entry zone between 1162.81 and 1175.23. The 1h ATR of 24.820874 shows enough volatility to reach TP1 at 1213.70 and then extend to TP2 at 1243.48 without a wick rejection. The daily trend is bullish, which means the 15m RSI at 47.46 is not oversold but b
ZEC-4.37%
SKL pump pump bigpump ath go
post-image
SKL+1.55%
BIGPUMP+2.36%
I was just about to go to the forum and rant, but then I saw my balance and thought, never mind—the market is always right.
When I opened the charts this morning, while the whole screen was still flashing green, $PEPE had already stopped falling. Being unable to drop further is the best signal. It kept grinding at the bottom, but every sell-off was absorbed. I made it clear at the time: at this level, stop scaring yourself. Wait for it to stabilize before making a move.
Looking back now, I’m really glad I took a second look. From 0.000003539 to the current 0.000003611, this long position has
post-image
PEPE+1.08%
SOL-1.07%
ETH+0.24%
hot Topics updates
live-cover
LIVE24
Load More

Join 40 M users in our growing community

⚡️ Join 40 M users in the crypto craze discussion

💬 Engage with your favorite top creators

👍 See what interests you

View More