Share your thoughts
placeholder
Article
My hand trembled slightly when I set the stop-loss a few days ago, and this morning I realized that act of filial devotion had been unnecessary. I opened the chart this morning, and $ZORA shot straight up without giving any room for a breather.
Fortunately, this move wasn’t impulsive. I had my eye on it during those days of bottom consolidation, with buying pressure growing stronger each time and buyers stepping in on every pullback. So the entry level was clear: 0.00793. The price is now at 0.00825, for a return of +99.02%. If this isn’t taking off, what is? Those who held are blessed—the wai
post-image
ZORA-3.02%
SOL+2.14%
SNDK+1.18%
For this $WLD trade, I took profit near the target and did not get greedy for the final acceleration. Volume has clearly contracted, lowering the probability of another push higher; the biggest concern is watching unrealized gains go through another roller coaster ride.
Looking back at the entry logic: the price pulled back to the platform around 0.3736, and the four-hour candle closed with a long lower wick, making the shift between bulls and bears fairly clear. I tested with a 30% position and held throughout once it stabilized.
During the rally, I originally planned to sell 70% first, but t
post-image
WLD+6.52%
ADA+0.50%
ETH+0.73%
Privacy leader #ZEC pumped again 🥲 The good news is that it’s up 6x since we entered ✌️ The bad news is that the short grid entered at 10XX is at an unrealized loss 🥲 You really can’t short it even a little! Market maker, are you still pumping because you want to surpass Bitcoin? $ZEC
post-image
ZEC+22.69%
  • 1
$1000 to $100,000 Crypto Trade Challenge Today
live-cover
LIVE1,616
$BNB I’m bearish. Down 2.44%, yet the retail long/short ratio surged from 1.7465 to 2.1566—the further it falls, the more they add to longs, catching the falling knife; whales only moved from 1.7239 to 1.8524, showing restraint, with the two sides diverging in strength. The funding rate fell from 0.0051% to 0.0031%; longs are not paying a premium, and the support is coming not from new leverage but from retail traders holding the line. Open interest of $490 million versus $500 million in trading volume means the position turnover is once per day, with no incremental inflows. Bullish reversal
post-image
BNB-2.57%
No moves, no analysis, just pure luck—this performance is embarrassing to even talk about. When the market plunged intraday, everyone was running, but I kept my eyes on $PONS ’s chart and noticed that someone stepped in every time it dipped, with key levels never breaking. Be greedy when others are fearful—directly signaled to open a long at 0.4775. And now, 0.8614, +1584.6%. It feels great when you get the rhythm right. It was truly sluggish at first, but the result is truly satisfying. Take profit on 80% first, and set a breakeven stop to protect the remaining 20%. Staying out of the market
post-image
PONS-7.88%
BTC+0.05%
SNDK+1.18%
Gave my @X subscribers $TAO bounce at $196 and now we are at the breakout at $263
Don't fade my red lines
TAO+13.49%
Everyone’s staring at the 4H chart, but the 15m RSI just whispered a secret about HYPE that most will ignore.

$HYPE /USDT - LONG

Trade Plan:
Entry: 87.013 – 87.451
SL: 85.127
TP1: 88.810
TP2: 89.863
TP3: 91.441

Why this setup?
- Why now? The 1D trend is bullish, yet the 15m RSI (36.85) shows a local washout—this is the classic "shakeout before markup" pattern.
- Entry zone is tight: 87.013–87.451. ATR (0.877) suggests low volatility compression, which typically precedes an expansion move.
- With TP1 at 88.810 and TP3 at 91.441, the risk/reward from 87.232 is over 4:1 if the long trig
HYPE+2.66%
With this trend, I don’t even need to think—the account is dancing on its own. When the market kept fluctuating intraday, everyone thought there was no chance. I watched the chart grind along a bottom without breaking down, and I knew what was up: if it holds steady, the gains will come. $ZEC is now at 1229.93 from 857.01, up +3090.33%. The beginning was truly sluggish, but the result is truly sweet. The market is waited out, and profits are held onto. Have a strategy before the market opens, discipline during trading, and reflection after the close. I’ll take 75% off the table for now, and p
post-image
ZEC+22.69%
BTC+0.05%
LAB-4.68%
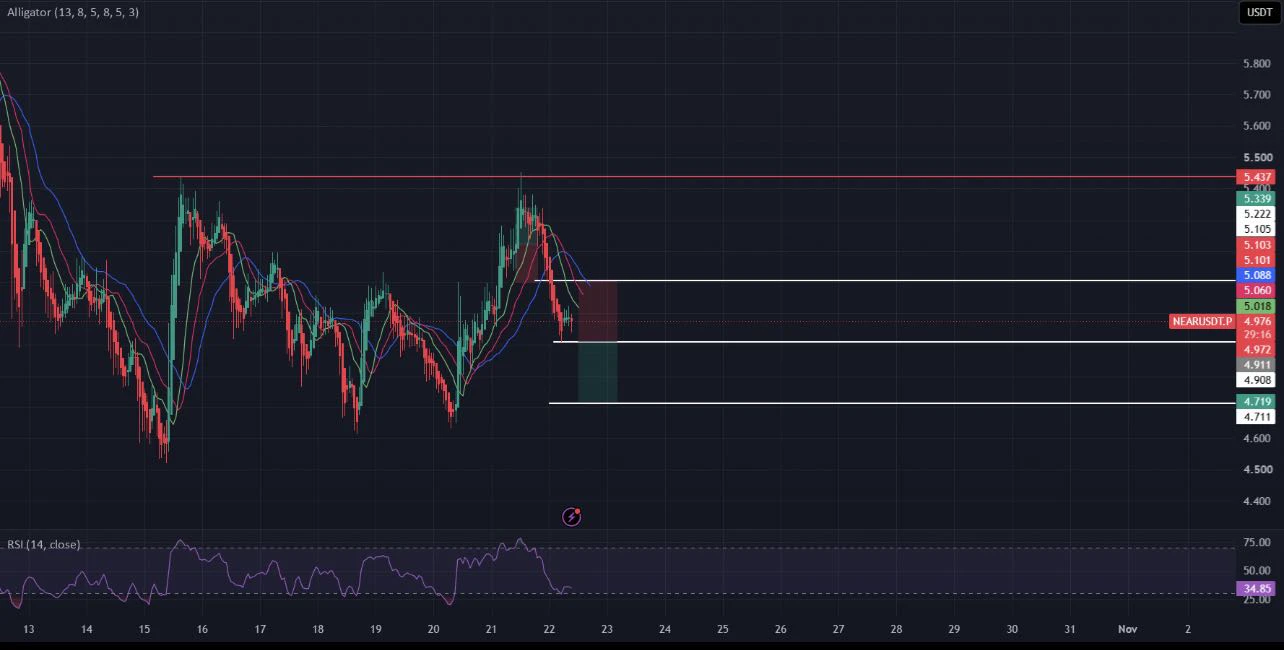
Most traders missed NEAR's 84% short signal because the 1D trend screamed bullish.

$NEAR /USDT - SHORT

Trade Plan:
Entry: 2.4312 – 2.4610
SL: 2.6323
TP1: 2.3065
TP2: 2.2134
TP3: 2.0737

Why this setup?
- The 4h timeframe is flipping bearish against the daily uptrend—this is the classic “bull trap” setup.
- RSI 15m at 55 shows weak momentum, not enough fuel to break 2.4610 resistance.
- Entry zone 2.4461 with TP1 at 2.3065 gives a 5.7% move before the daily trend reasserts.
- ATR 1h (0.0597) means volatility is compressed—breakouts are violent. Why now? Price is stalling under supply
NEAR+13.68%
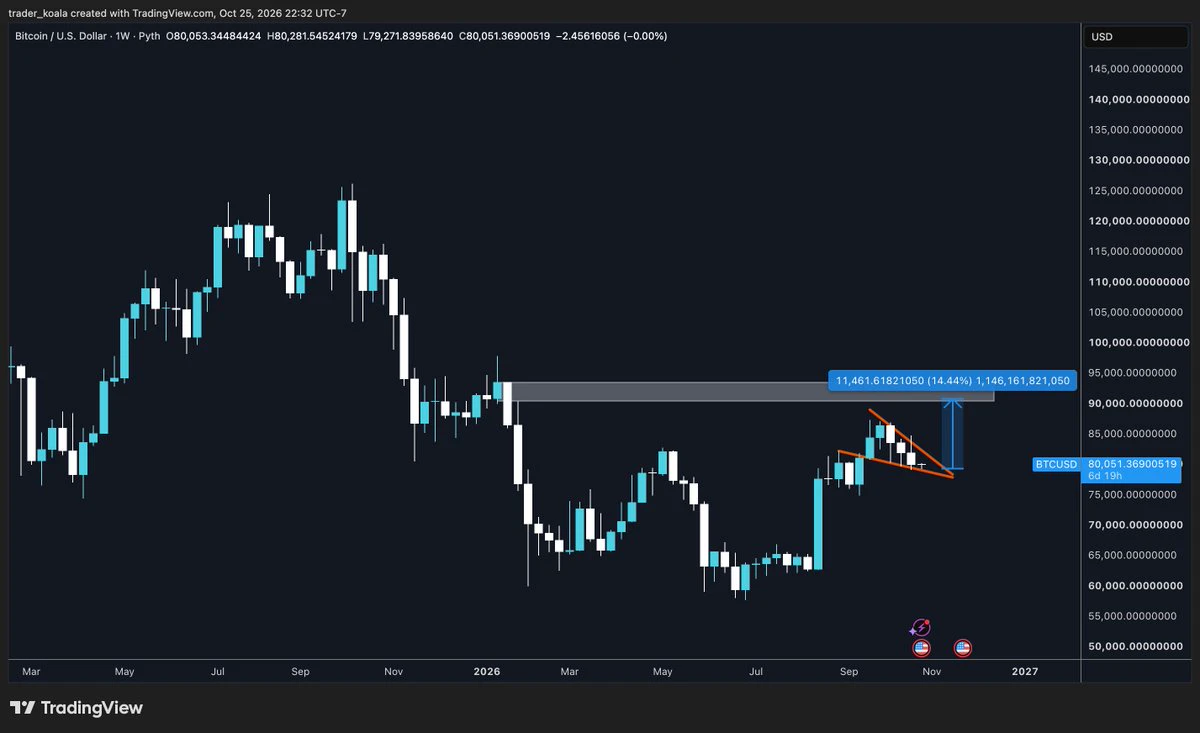
#Gate事件合约晒单挑战 Bitcoin four-hour price movement forecast, personal opinion, betting bullish, with the following analysis:
BTC traded sideways within the 79.55k–80.20k range over the past 24 hours, with buying support emerging each time it retested the 79.5k area, indicating solid short-term support.
Four-hour technical signals are bullish: SAR is below the price, bullish momentum is stronger than bearish momentum, and RSI at 56 is neutral to slightly strong, with no signs of overbought conditions. In terms of fund flows, the low futures funding rate suggests that long positions are not overcro
post-image
BTC+0.01%
ETH+0.67%
After $FARTCOIN rallied, I didn’t exit my entire position. I took 80% in profits first and moved the protective stop on the remaining position above breakeven. Just now, a quick pullback took out the remaining position, locking in the profits smoothly.

The entry reason was simple: on the hourly timeframe, price pulled back to the previous high without continuing lower, and instead reclaimed the area above the moving average on rising volume. This was a textbook pullback confirmation. After going long, I kept my stop loss below the lower boundary of the small range.

After the pullback took
post-image
FARTCOIN+3.15%
SNDK+1.18%
ZEC+22.69%
[New Streamer] Market Prediction
live-cover
LIVE69
I didn’t chase the first bullish candle after the breakout; my first instinct was to worry about a false breakout. Only after the pullback held and the second volume-backed move began did I confirm the direction and add to my long position.

After the price surged near the target and momentum stalled, I followed the plan and first cut 70% of the position, keeping the remaining 30%. Later, the protective level was hit during a pullback, so I simply exited the remaining position completely.

This long trade made one thing clearer to me: entering a little later is nothing to be ashamed of. The
post-image
BNB-2.57%
ADA+0.50%
on the mountain top schizophrenically talking to myself about flork and how its the next multi bil genny coin of doom
post-image
Everyone’s chasing TAO’s green candles, but the 4h tape is screaming something they refuse to hear.

$TAO /USDT - SHORT

Trade Plan:
Entry: 267.0 – 269.4
SL: 283.5
TP1: 256.7
TP2: 249.1
TP3: 237.6

Why this setup?
- RSI on the 15m is overheated at 69.6—buyers are exhausted right as price tags the 268.2 reference.
- ATR (1h: 4.89) shows volatility is compressing; a snap back toward 256.7 (TP1) is the path of least resistance.
- 1D trend is range-bound, so fading the top of the range (269.4) with a 77.4 confidence short isn’t a gamble—it’s statistical edge.

Debate:
If TAO rejects 269 an
TAO+13.72%
$ARB Signal】4H bullish trend intact, 1H stabilizing for a long entry
$ARB Current price 0.18475, 4H MACD bullish momentum is contracting, and the price has retraced from the high of 0.2068 to near EMA20. 1H RSI is 55.35, with signs of a bottom forming. Order book depth imbalance is -4.41%; selling pressure has not been fully absorbed, while buyers are providing support near 0.1840.
🎯Direction: Long
⚡Entry/limit order: 0.18475
🛑Stop-loss: 0.1755125
🚀Target 1: 0.1986063
🚀Target 2: 0.2055344
🛡️Trade management:
- Execution strategy: After reaching Target 1, reduce the position by 50% and mo
post-image
ARB+10.24%
BTC+0.01%
ETH+0.67%
SOL+2.14%
$ARB Signal】1H pullback support, long plan
$ARB 1H RSI has fallen back to 55.5, and the price is in the recommended entry range of 0.18426-0.18481. The 4H MACD histogram at 0.0042 remains above the zero line, while 1H MACD momentum is weakening. Depth imbalance is -30.5%, aggressive buying has not yet returned, and the 0.01% funding rate shows no overheating.
🎯Direction: Long
⚡Entry/limit order: 0.1842556 - 0.1848100
🛑Stop-loss: 0.1829619
🚀Target 1: 0.1875822
🚀Target 2: 0.1889682
🛡️Trade management:
- Execution strategy: Reduce the position by 50% after reaching Target 1 and move the sto
post-image
ARB+10.24%
BTC+0.01%
ETH+0.67%
SOL+2.14%
$METIS Signal】4H upper band breakout, go long with the trend
$METIS RSI 77, the 4H upper band at 3.3568 has been broken, and the current price of 3.457 is hugging the outer edge of the upper band. 1H MACD bullish volume continues to expand, while RSI at 69.78 has not reached extreme flattening. Sell pressure dominates the order book, funding rate is -0.0082%, and OI is stable. Buyers are still attempting to push higher, but depth imbalance is limiting smooth movement. Chasing a long at the current price offers a 1.5 risk-reward ratio, with moderate upside, but momentum is dominant, so executi
post-image
METIS+22.52%
BTC+0.01%
ETH+0.67%
SOL+2.14%
SKR & PONS Futures Trading Challenge
https://www.gate.com/share/act/27404c27
$SKR $PONS
SKR-8.37%
PONS-7.88%
  • 10
Load More

Join 40 M users in our growing community

⚡️ Join 40 M users in the crypto craze discussion

💬 Engage with your favorite top creators

👍 See what interests you

View More