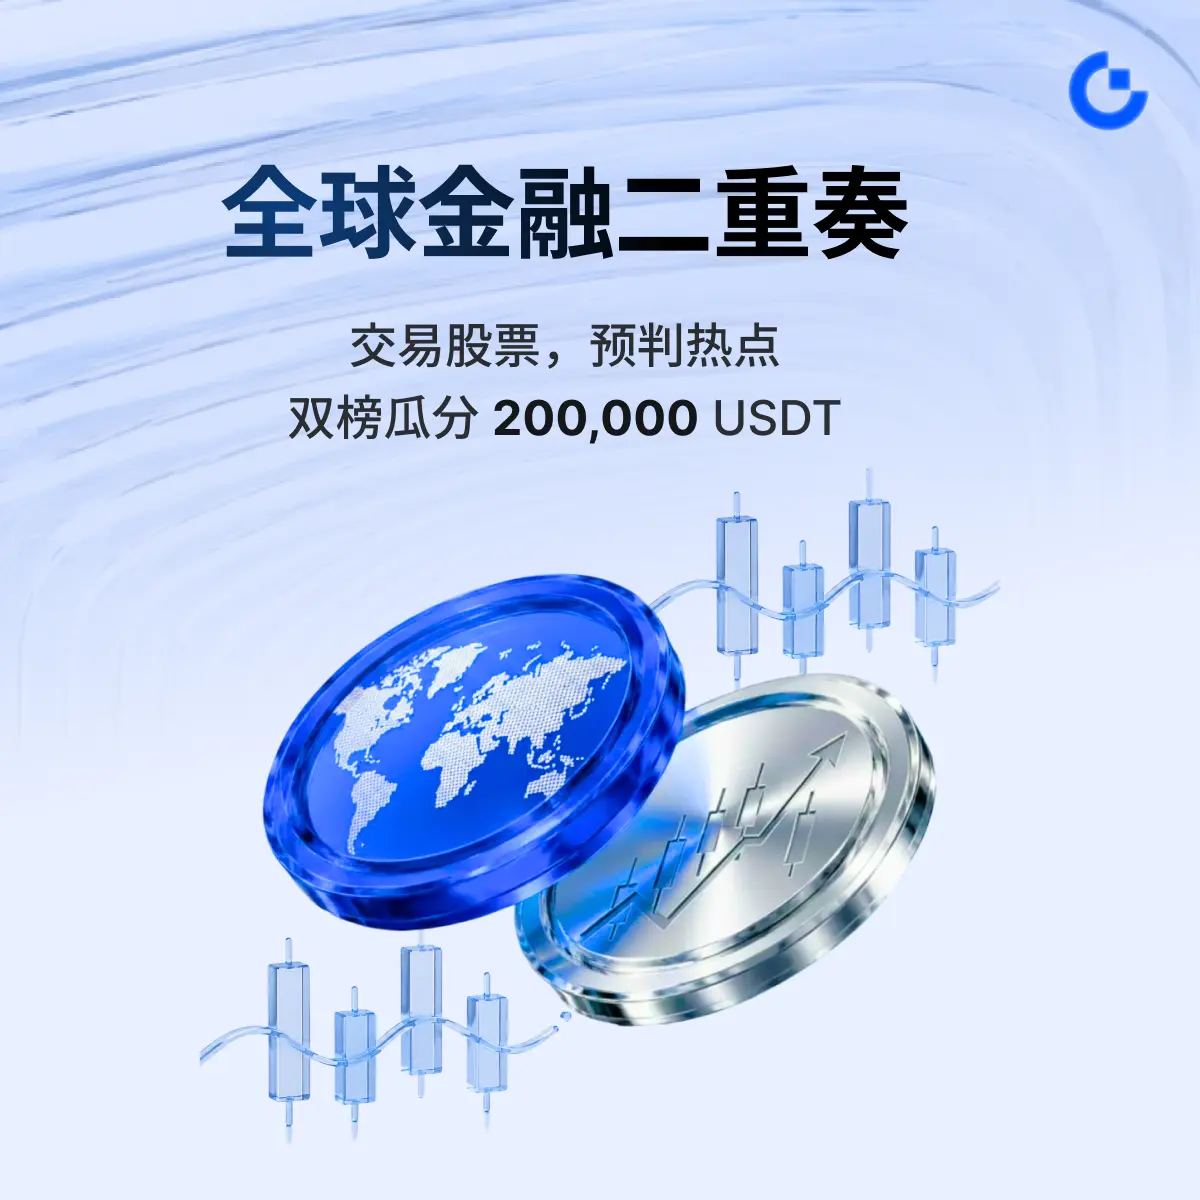
Share crypto content and earn up to 60% commissions through content mining.
placeholder
gatefun
On July 3, 2026, Ethereum (ETH) is temporarily reported at $1,699, up about 5%-6% in 24 hours. Affected by weak U.S. employment data weakening expectations of interest rate hikes, market sentiment has somewhat recovered. The key to the current strategy is to determine whether this is a bottoming rebound or a pause in the downtrend.
📊 Core Market Divergence
· Short-term (cautiously optimistic): ETH has formed support above $1,650, and the 1-hour bullish structure remains intact. However, it has touched resistance near $1,725, showing overbought signals, with a need for a short-term pullback.
·
ETH6.17%
View Original
post-image
[The user has shared his/her trading data. Go to the App to view more.]
  • Reward
  • Comment
  • Repost
  • Share
Feel good, the market finally broke through the fake strength!📉😎
The last look before bed a few days ago, $XAG was still grinding sideways at a high level, looking like it was bottling up a direction, but actually the longer it grinds, the weaker it gets.
During the session when it was grinding the top, I watched simply: the resistance above was obvious, the rebound was weak, the volume didn't cooperate, and every upward thrust fell short. Seeing these details, I leaned more towards opening a short position at around 75.56 👀
Now XAG has come to 61.23, giving a return of +1762.96%. This wav
XAG3.27%
BTC2.86%
ETH6.17%
View Original
post-image
  • Reward
  • Comment
  • Repost
  • Share
#WarshEndsForwardGuidance – A Comprehensive Breakdown of Its Impact and Future Implications
The financial world thrives on signals. Central banks, institutional investors, and retail traders alike hang on every word uttered by policymakers. Among the most anticipated communications is forward guidance, a tool used by central banks to shape market expectations about the future path of monetary policy. Recently, the term #WarshEndsForwardGuidance has gained traction, sparking debates across financial circles. This post delves deep into what this development means, its implications for markets, a
post-image
  • Reward
  • Comment
  • Repost
  • Share
Most traders will miss this SNDK setup because they’re staring at the wrong timeframe.

$SNDK /USDT - LONG

Trade Plan:
Entry: 1761.12 – 1785.90
SL: 1618.91
TP1: 1889.46
TP2: 1966.76
TP3: 2082.72

Why this setup?
• 4h bias is LONG with 77% confidence, yet 15m RSI is neutral at 47—this is the calm before the squeeze.
• Entry zone: 1761–1785, with TP1 at 1889 (7% upside) and TP2 at 1966 (11% upside).
• Why now? ATR is tight at 49, suggesting a breakout is imminent from the 1D range.

Debate:
Are you waiting for a retest of 1761 or jumping in at 1773 right now?
SNDK-11.19%
post-image
post-image
  • Reward
  • Comment
  • Repost
  • Share
I recently researched on-chain staking and found that WStaking is worth trying.
I was looking at various U-based financial products before, most of which either had pitifully low APY or were those obviously fake triple-digit yields that lure people in before rug-pulling.
After studying WStaking's staking rules, I found they calculate APY based on two dimensions: lock-up period and deposit amount:
> 1 month: 10%
> 3 months: 12–15%
> 6 months: 15–24%
> 12 months: 24–36%
Minimum 10U, maximum 10kU to hit the highest APY tier.
In other words, it's not a fixed number; the more you deposit and the lo
View Original
post-image
  • Reward
  • Comment
  • Repost
  • Share
$$RPL It pumped 28% in half an hour, but my stop-loss is already set.
At 1.89, it surged from 1.46 within 24 hours, with a volume of 5.6M, looking lively. But anyone used to buying low and selling high knows that chasing a 28% single-day gain usually ends up bag-holding. My discipline is simple: either buy low in the 1.46-1.48 range, or wait for a pullback to a safe zone before entering.
Here's a clear price plan: Entry: Don't act near the current price of 1.893. Plan to place the first long order at 1.72-1.75, with 2% position. If it continues to pull back to 1.62-1.65, add another 1%. This i
RPL23.98%
View Original
post-image
post-image
post-image
  • Reward
  • Comment
  • Repost
  • Share
A few days ago it was still pretending to be dead, but today it directly delivered the result. 🚀 The moment I opened the chart this morning, the rhythm of $SLX was clearly different. A few days ago, before sleeping, it was still grinding the bottom, but the key level was never broken—this is the crucial point. 👀 Before the chart had fully kicked off, SLX kept pressing around 0.21199, but every time it pulled back, someone stepped in to take it. The sell pressure didn’t keep building up. I judged back then that it wasn’t weak—it was accumulating power. 📌 When it’s time to feast, don’t act l
SLX-7.29%
BTC2.86%
ETH6.17%
View Original
post-image
  • Reward
  • Comment
  • Repost
  • Share
This bar came out, and the chart stopped pretending! 📉🔥 A few days ago before bed, I saw $STORJ still holding strong at a high level, on the surface it looked like it would continue to surge, but in reality it looked more and more weak. Volume didn't follow, the rebound didn't sustain, every time it went up it was pushed back. At that time I judged this wave was more like a bull trap, not suitable for chasing longs.
Before the chart had fully started, I was watching STORJ's support, and found that no one was buying when it went up, and the resistance softened on contact 👀 So I executed a s
STORJ1.77%
BTC2.86%
ETH6.17%
View Original
post-image
  • Reward
  • Comment
  • Repost
  • Share
$BEAT What the hell, 1,150 short orders at 3.3 didn’t get the profit. It dropped to 2.21, and I bottom-fished at a 1,700 cost with a 2.3 entry—only to get chopped up again. I’m really fucking fed up. I lost 3,000u on both the way up and the way down.
BEAT12.59%
View Original
post-image
post-image
  • Reward
  • 3
  • Repost
  • Share
KirishimaListeningToTheRain:
The stop loss you gave is too small.
View More
The last look before bed was still grinding, woke up to see it directly cashing out. 📉🚀 This wave $WLD didn't suddenly weaken; the details from a few days before bed had already revealed it.
I was watching WLD at that time, the upward resistance was never eaten, each bounce was weaker than the last, and the volume was insufficient 👀 especially every time it tried to rally it fell short. In such a position, I won't chase orders; instead, I pay more attention to the short window, so I executed a short near 0.4331.
Now the chart has reached 0.4062, yielding +435.79%, nice ✅🔥 Getting the rhyt
WLD16.38%
BTC2.86%
ETH6.17%
View Original
post-image
  • Reward
  • Comment
  • Repost
  • Share
[New Streamer] AI star stocks pull back sharply Micron technology, SK hynix and SanDisk see rising
gate liveLIVE
1,232
  • Reward
  • Comment
  • Repost
  • Share
A few days ago, it was still putting up a front, and today it just showed its hand! 🚀📉 While grinding higher during the session, I already felt $FARTCOIN something was off. The price was inching up, but volume didn't follow and bids weren't strong enough—it didn't look truly bullish at all. A few days ago in the afternoon, when I was watching FARTCOIN, I saw several breakouts get pushed back 👀. The overhead resistance wasn't absorbed, and the bounces were getting weaker. This kind of price action easily tricks people into thinking a breakout is coming, but short opportunities were already
FARTCOIN18.37%
BTC2.86%
ETH6.17%
View Original
post-image
  • Reward
  • Comment
  • Repost
  • Share
Don’t say it—this wave is truly solid! 📈 Just a few days ago, it was still grinding within a tight range. This morning, when I opened the chart, $USELESS it directly ignited the longs’ sentiment. Those watching this time didn’t end up burning time for nothing.
Before the chart was fully up and running, I saw USELESS chopping sideways at the bottom without breaking, and the pullback held firmly. When the buy side started to take the initiative 👀 as the price hovered around 0.07665, I told everyone then: don’t just focus on how it moves—what matters is whether the structure has been damaged.
USELESS5.26%
BTC2.86%
ETH6.17%
View Original
post-image
  • Reward
  • Comment
  • Repost
  • Share
AI star stocks pull back sharply!
gate liveLIVE
2,099
  • Reward
  • 3
  • Repost
  • Share
NareshBabu:
ab dhaka hogaa. trip to the moon
View More
I think $TROLL is going to be the biggest meme to come out of Solana
I used to think anything higher than 5 mill was too late to make life changing money
$PEPE put ETH memes on the map
For perspective, if someone invested when PEPE was at a $50 mill market cap and sold near its peak around an $11B market cap:
$250 would be $55,000
$500 would be $110,000
$1,000 would be $220,000
$5,000 would be $1.1M
$TROLL’s recognition, branding, and cultural reach make it hard for me to put a ceiling on where it could go but what I do know is 2-3 Billion is FUD!
There’s no comparing Troll we haven’t seen a
TROLL6.48%
SOL4.89%
PEPE5.59%
ETH6.17%
post-image
  • Reward
  • Comment
  • Repost
  • Share
ETH Analysis$ETH
1. Today's Direction: Consolidation
2. Current Trend: Price is above the 1-hour Bollinger Band middle line and below MA5, with the lower and upper Bollinger Bands diverging upward
3. Resistance Level: 1800, Short-term Minor Resistance: 1740
4. Support Level: 1600, Short-term Minor Support: 1652
#Gate股票转仓功能上线
ETH6.17%
View Original
post-image
  • Reward
  • Comment
  • Repost
  • Share
One impulsive trade can erase a lifetime of discipline.
post-image
  • Reward
  • Comment
  • Repost
  • Share
#TLM $TLM 15m another surge, current price $0.00164, 24h +12.95%.
This recent move was not ordinary volatility; the short-term push was very urgent, with funds following through.
But then again, on the whale side, the long/short positions are 56:44, clearly leaning long. Following the trend is fine, but the key is the support on pullbacks.
Both charts are below: the first one shows the analysis levels, the second shows the web candlestick chart.
$0.001599 must not break; if it breaks, risk will spread; $0.001689 is the first level for recovery.
TLM22.78%
View Original
post-image
  • Reward
  • Comment
  • Repost
  • Share
#PredictWorldCupWin40000U The event is more than just about trading. It's about building a community of football fans and crypto enthusiasts who share insights, debate predictions, and learn from each other.
Gate Square has become my go-to platform for connecting with like-minded traders this World Cup season. By posting content with event tags, participants can showcase their analysis, share trading screenshots, and explain their strategies, while competing for exclusive rewards including limited-edition World Cup jerseys and prediction market experience vouchers.
Content creation is a powe
View Original
post-image
post-image
ShanDingMediaSiyu
#PredictWorldCupWin40000U The campaign is not just about trading. It's about building a community of football fans and cryptocurrency enthusiasts who share insights, debate predictions, and learn from each other.
Gate Square has become my go-to platform for connecting with like-minded traders during this World Cup season. By posting content with the campaign hashtag, participants can showcase their analysis, share trading screenshots, and explain their strategies while competing for exclusive rewards, including limited-edition World Cup jerseys and prediction market experience vouchers.
Content creation is a powerful way to enhance your trading edge. When you write match predictions, you force yourself to articulate your reasoning, which often reveals loopholes in your analysis. Sharing your prediction slips builds accountability and encourages more careful position sizing. Daily match analysis posts attract feedback from other community members, exposing you to alternative perspectives you might have overlooked.
The campaign encourages six types of content: match predictions with reasoning, prediction slip screenshots with strategy explanations, daily match analysis based on team data, dark horse and upset predictions, championship predictions, and expert insights on teams and players. Each format serves a different purpose and appeals to a different audience.
I find engaging with other participants' content equally valuable. The comment section of Gate Square is filled with lively discussions, where experienced traders share real-time observations on odds changes, injury news, and tactical adjustments. This collective wisdom often surfaces information faster than traditional news sources.
Whether you're posting your first prediction or your hundredth, remember that authenticity resonates. Share your genuine thought process, acknowledge where uncertainty lies, and treat both victories and defeats as learning opportunities. The community thrives on honest conversations, not perfect predictions.
#PredictWorldCupWin40000U
#PredictWorldCupShare20000U
@Gate_Square
  • Reward
  • Comment
  • Repost
  • Share
$BTC Signal】1H divergence + deep support, long snipe
$BTC Buy-side depth accounts for 63%, selling pressure quickly absorbed. 1H MACD histogram continues to shorten, bearish momentum waning. 4H Bollinger Bands mid-band moving up, capital supporting the bottom is evident.
🎯Direction: Long
⚡Entry/Limit Order: 61340.43 - 61525.00
🛑Stop Loss: 60909.75
🚀Target 1: 62447.88
🚀Target 2: 62909.31
🛡️Trade Management:
- Execution strategy: After reaching target 1, reduce position by 50% and move stop loss to breakeven. If price falls back to entry, exit automatically to protect capital.
Current risk
BTC2.85%
ETH6.17%
SOL4.89%
View Original
post-image
  • Reward
  • Comment
  • Repost
  • Share
Load More

Join 40 M users in our growing community

⚡️ Join 40 M users in the crypto craze discussion
💬 Engage with your favorite top creators
👍 See what interests you
  • Pinned