Share your thoughts
placeholder
Article
Everyone’s staring at $MU /USDT’s 1017—but the 4h tape is screaming something else entirely.

$MU /USDT - SHORT

Trade Plan:
Entry: 1016.16 – 1017.94
SL: 1025.64
TP1: 1010.61
TP2: 1006.32
TP3: 999.87

Why this setup?
- 1D is *range*, not trend—so this isn’t a breakout play; it’s a mean-reversion snipe.
- RSI on 15m sits at 57.31—weak momentum, not exhaustion—meaning longs lack fuel to clear 1025.
- ATR 1h = 3.58 → tight stops, but TP1 at 1010.61 is only 6.4 points away—quick grab if 1017.05 holds as rejection.
- Why now? Price is parked at entry_ref with a 55.4 SHORT edge—waiting for
MU+0.19%
Everyone’s staring at the 1H pump, but the 4H clock just ticked against WLD.

$WLD /USDT - SHORT

Trade Plan:
Entry: 0.3959 – 0.3983
SL: 0.4084
TP1: 0.3886
TP2: 0.3830
TP3: 0.3745

Why this setup?
Why now?
- RSI on the 15m is 51.5—dead neutral, no momentum to break the range.
- ATR (1H) is razor-thin at 0.0047, meaning the next expansion hits fast.
- With 1D in “range” and bias SHORT at 55%, the path of least resistance is down to TP1 (0.3886).
- The current price (0.3971) sits right at the entry reference—this is the trigger zone, not a chase.

Debate:
If 0.3959 fails to hold, are
WLD+4.51%
$ETH Signal】Long + 1H MACD histogram widening / 4H golden cross
$ETH The 1H MACD histogram widened to 3.81, with the price holding just below the upper Bollinger Band. The 4H golden cross continues, and the previous 4H bullish candle had a volume of 464,000. The 1H RSI is 65.24, and the funding rate is 0.0078%, so longs are not overheated. The order book depth ratio is 0.20, with sell orders placed deeper, creating slippage costs for short-term chasing. The risk-reward ratio is 1.5, the direction is clear, and execution should follow the specified levels.
🎯Direction: Long
⚡Entry/Limit order:
post-image
ETH+1.20%
BTC+0.18%
SOL+1.66%
Gate hits 60 million users! Veteran users, don’t scroll away just yet—let’s see who entered earlier than you?
Gate’s global registered users have surpassed 60 million. Since the platform was founded in 2013, it has gone through multiple bull and bear cycles in the crypto market, and its business now spans digital assets, stocks, ETFs, payments, wallets, and Web3.
But anyone who has truly experienced these cycles knows that the numbers in your account are merely the result—the process is the story.
Some watched BTC charge ahead all the way, while others experienced altcoins doubling in a day an
BTC+0.18%
  • 44
Crypto Signals and Trding Insights
live-cover
LIVE39
Gate reaches 60 million users—it's time to update your “crypto youth archive”!
What does 60 million users mean?
I think that rather than representing the platform's scale, it means 60 million crypto journeys have been connected. According to Gate's official data, the platform currently supports 5,000+ digital assets and continues to expand its diverse asset services, including stocks, ETFs, and RWAs.
But what may truly be worth remembering is the moment we first encountered the crypto market.
Were you a little nervous when you made your first deposit?
Did you stare at the candlestick chart for
RWA+5.05%
BTC+0.18%
  • 45
$GT is showing strong bullish momentum on the daily chart.
Price is up over 10% around $9.28 after breaking out from the recent $8.00 area.
Key levels I’m watching:
• Resistance: $9.67–$10.00
• First support: $8.80–$9.00
• Major support: $8.00–$8.20
If $GT can hold above $9.00 and break the recent $9.67 high, the next leg higher could open up.
For now, buyers clearly have momentum, but after such a strong move, a retest would be normal.
#GT #GateToken #Crypto
GT+10.60%
  • 2
  • 1
The probability of a Fed rate hike in September fell from 66% to 50% in just a few days. Fed Chair Christopher Waller sent a clear dovish signal, saying that if inflation slows further, he would support keeping rates unchanged in September. Bitcoin broke above $82,000, gold rose above $4,500, and U.S. stocks posted their biggest gain in nearly a month. What does such a sharp drop in expectations mean? How is the logic of crypto market pricing being reshaped?
Everyone’s staring at BTC—but ZEC just printed a 95% confidence LONG signal that nobody sees yet.

$ZEC /USDT - LONG

Trade Plan:
Entry: 1011.11 – 1018.97
SL: 977.33
TP1: 1043.32
TP2: 1062.18
TP3: 1090.46

Why this setup?
Why now? The 4h timeframe is screaming bullish while the 1D trend confirms it. RSI on the 15m sits at 47.77—not overheated, just coiled. ATR (1h) is 15.71, giving us room to run toward TP1 at 1043 without breaking a sweat. Entry zone: 1011–1019. This isn’t a gamble; it’s a high-probability setup with invalidation at 874.71. The market is waiting—but the clock is ticking.
ZEC-0.33%
【$B Signal】Long | 1H pullback to Bollinger midline + bid support
$B 1H pullback to the Bollinger midline, bid-side depth imbalance at 12.02%, current price 0.1733 holding just above the midline.
🎯Direction: Long
⚡Entry/Limit order: 0.172780 - 0.173300
🛑Stop-loss: 0.171567
🚀Target 1: 0.175900
🚀Target 2: 0.177199
🛡️Trading management:
- Execution strategy: After reaching Target 1, reduce the position by 50% and move the stop-loss up to breakeven. If the price falls back to the entry level, exit automatically to protect the principal.
Depth logic: The 4H MACD is above the zero line; the hist
post-image
BTC+0.18%
ETH+1.18%
SOL+1.66%
Can HYPE still be chased after breaking above $88? What’s really worth watching now isn’t the price
HYPE broke above $88 to hit a new all-time high, and the market has started asking the familiar question again: “Can it keep rising?”
My view is that instead of guessing the top, it’s better to observe the market structure after the breakout.
A truly healthy strong market usually won’t rely on a single large bullish candle. After breaking through the previous all-time high, if the price can consolidate at elevated levels to absorb profit-taking and then gradually form higher lows, that indicates
HYPE+1.66%
  • 39
Everyone’s staring at ONDO’s 0.371—but the 95% score says you’re early, not late.

$ONDO /USDT - LONG

Trade Plan:
Entry: 0.370 – 0.372
SL: 0.363
TP1: 0.377
TP2: 0.381
TP3: 0.388

Why this setup?
Why now?
- 4H bias is LONG with 95% confidence—the algo smells a breakout before the crowd does.
- Daily trend is bullish; pullback to 0.371 is the *last* cheap ticket before TP1 at 0.377.
- RSI 15m at 50.2 = neutral fuel, not exhaustion. ATR 1h (0.003465) shows tight coils—squeeze ready.
- SL at 0.363 is a 2% risk for a 4.5% ride to TP3 (0.388). Asymmetry is your edge.

Debate:
Are you ad
ONDO+4.22%
$UNI You must hold on for the long term to catch the big fish; it will definitely make you financially free, even more financially free, even more financially free.
post-image
UNI+15.89%
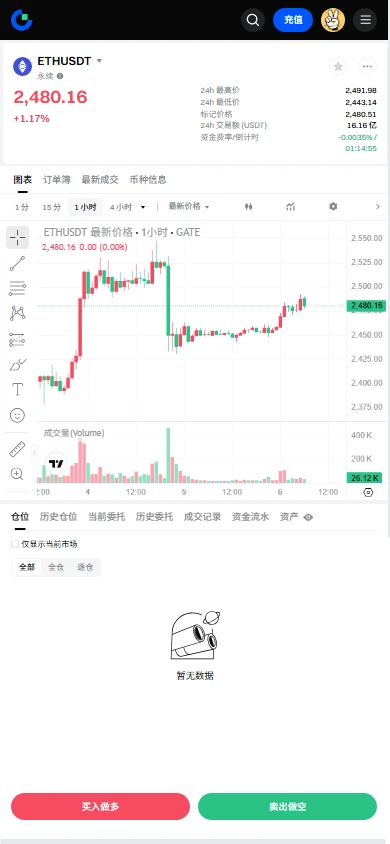
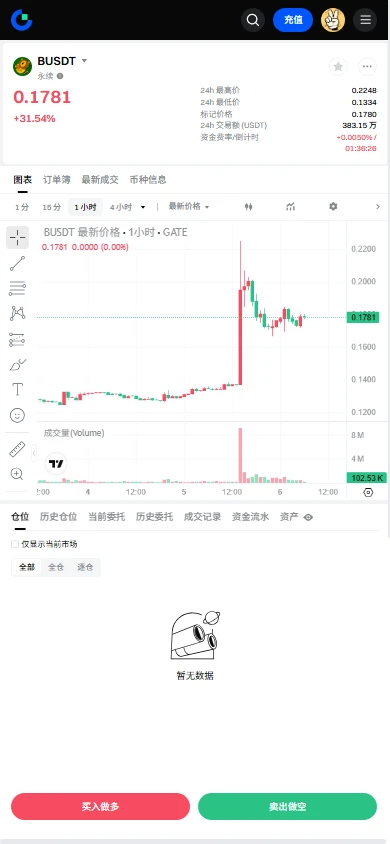
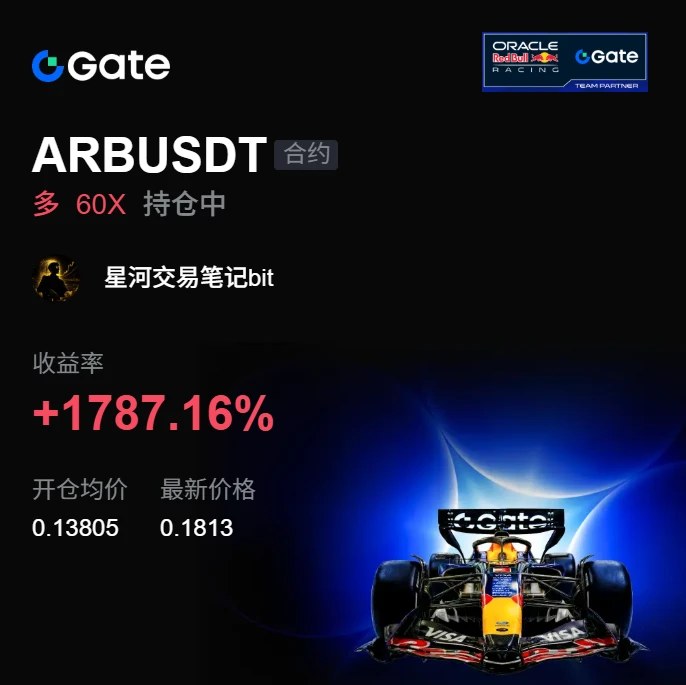
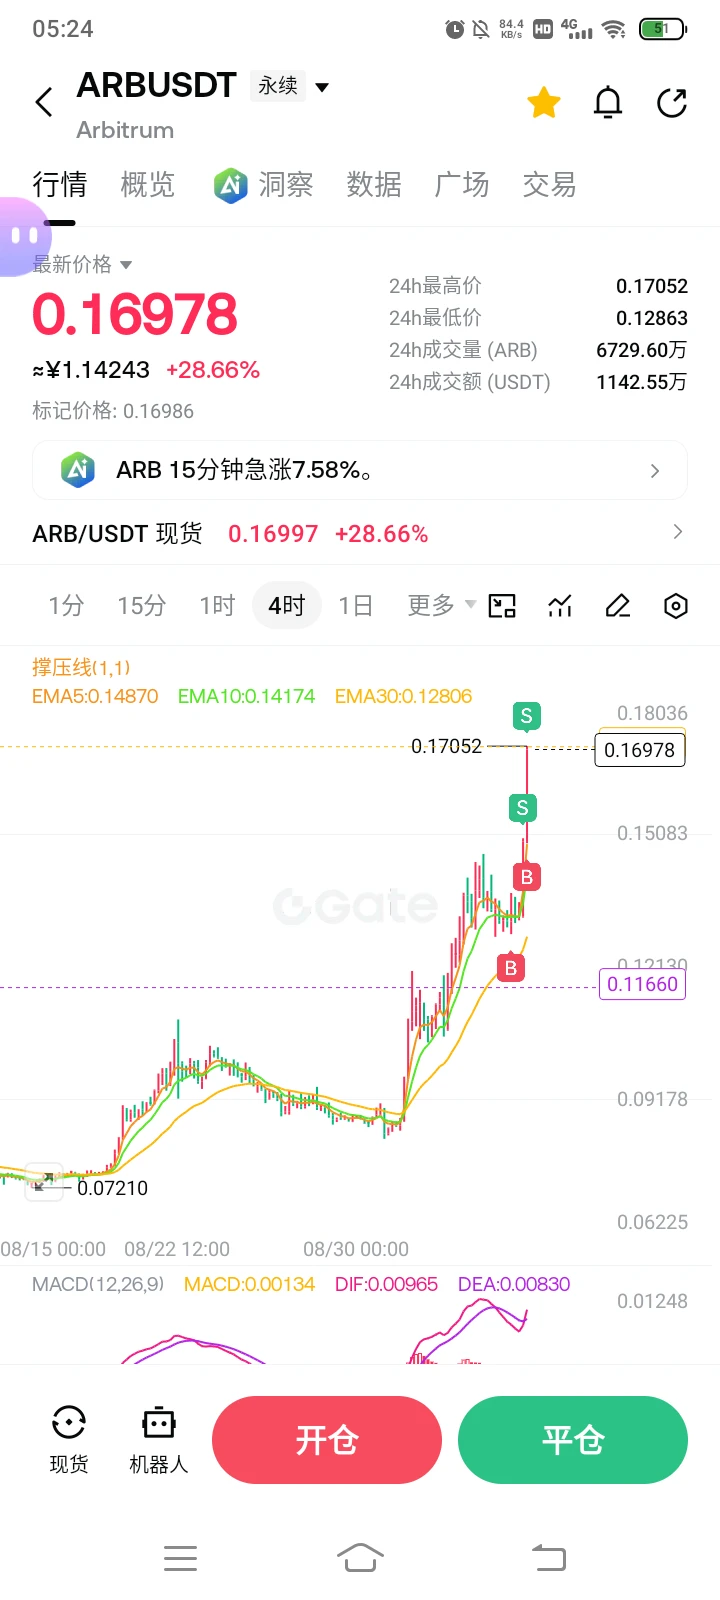
A few days ago, $ARB broke out on heavy volume and held above the moving averages. I reminded myself not to hesitate and added to my long position with the trend. But the wicks early in the breakout were genuinely frightening, and my unrealized profit briefly shrank by more than half.
After the price strengthened again, I closed 70% of the position first and placed a trailing stop on the remaining 30%. Some people prefer to exit all at once, but taking profits in batches suits me better. Even if the price continues to surge on momentum later, I still have a position to participate with and won
post-image
ARB+40.30%
ZEC-0.33%
BNB+7.18%
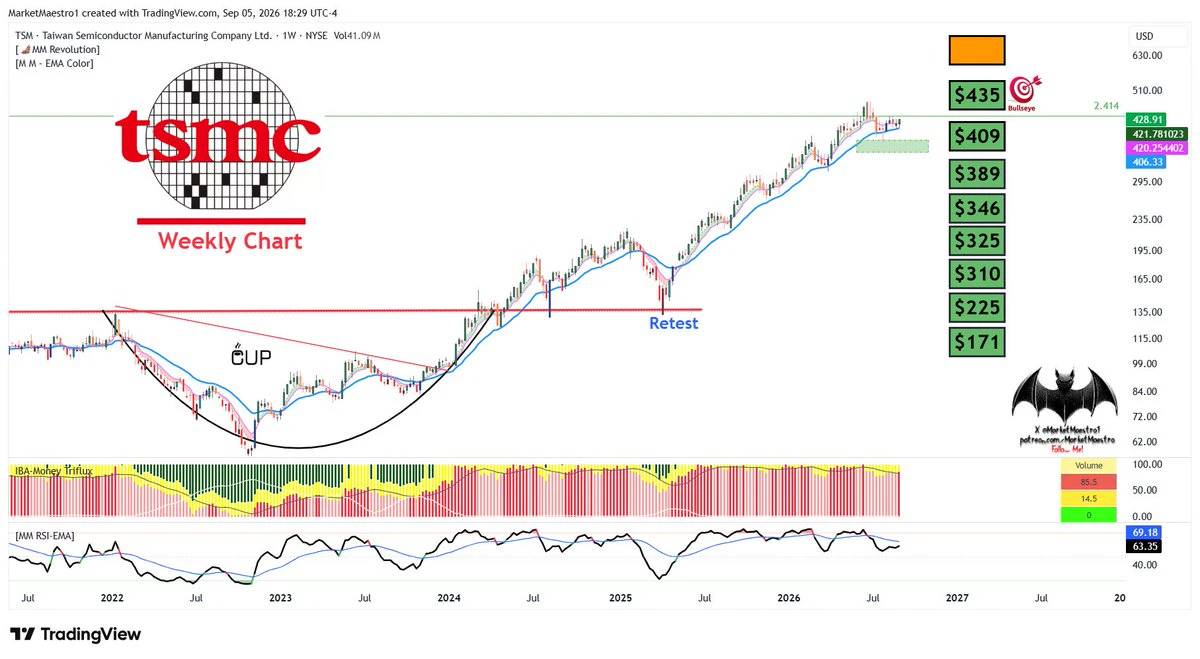
$TSM
It may have survived the worst! The green zone was my entry/add zone
post-image
TSM+2.76%
$PI Pi doesn't have what it takes. TRB is the real deal.
post-image
PI+1.34%
  • 1
BTC MARKET UPDATE
live-cover
LIVE57
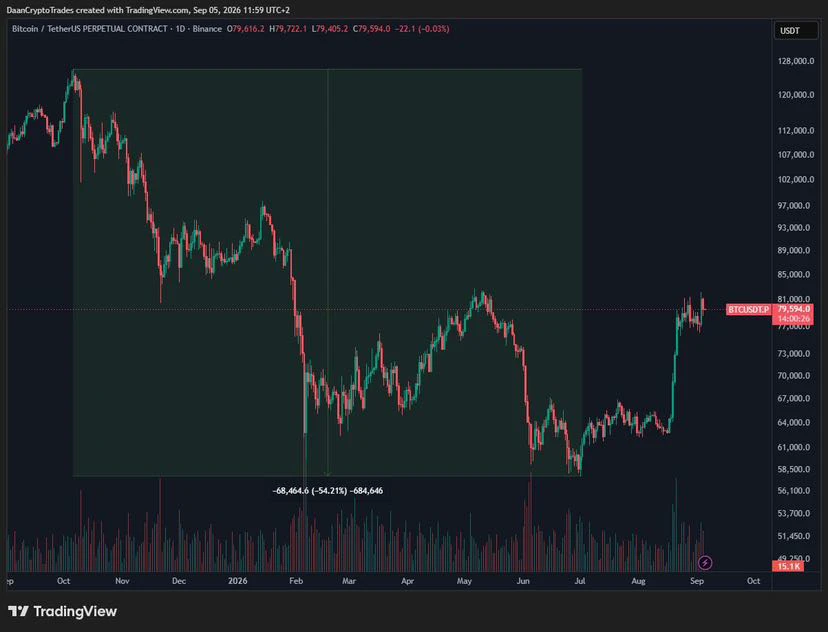
$BTC 's Recent bear market trend has seen a -54% drawdown top to bottom.
This was while all other markets were rallying hard, which is a good argument as to why it was "just" -54% this time around. Arguably, price would see a much larger drawdown if stocks and everything were down a lot too during this time.
This was a very isolated bear trend this time around.
#Gate60MillionUsers #BTCReclaims80K
post-image
BTC+0.18%
  • 7
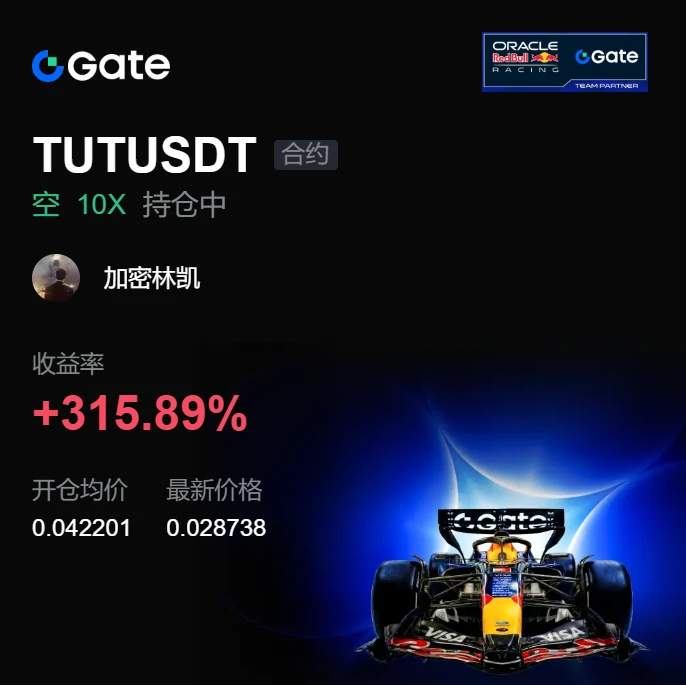
The hand that set the stop-loss a few days ago trembled slightly; this morning, I realized that was unnecessary filial piety. Before bed, I placed the short order for $TUT , and when I woke up, the candlestick had already completed most of the move for me 😏
Watching the market at the time, the rebound had no volume, and every push upward felt weak. The selling pressure above was obvious—someone was rushing to exit every time the price tested a high. This structure was not a breakout, but a bull trap. I set the entry at 0.042201 in advance; when it was time to short, I shorted without hesitati
post-image
TUT+22.79%
SNDK+1.85%
BNB+7.18%
Everyone’s staring at HYPE’s 85.5—but the real trap is waiting at 87.3.

$HYPE /USDT - LONG

Trade Plan:
Entry: 85.356 – 85.660
SL: 84.053
TP1: 86.600
TP2: 87.327
TP3: 88.419

Why this setup?
Why now? The 4h structure is armed LONG with 95% confidence, and the 1D trend is bullish—this isn’t a coin flip.
- Entry zone: 85.35–85.66 (tight, disciplined).
- RSI 15m at 56.5 shows room to run, not exhaustion.
- TP1 at 86.6 is the appetizer; TP2 at 87.3 is where the crowd gets greedy.
- Invalidation sits far below at 82.2—so the risk/reward is mathematically on your side.

Debate:
Do you f
HYPE+1.69%
Load More

Join 40 M users in our growing community

⚡️ Join 40 M users in the crypto craze discussion

💬 Engage with your favorite top creators

👍 See what interests you

View More