Share your thoughts
placeholder
Article
$SOL Signal】Long, 1H buy-side support
$SOL Buy-side support is clear: 1H MACD histogram at 0.135, depth ratio at 1.05, and funding rate at 0.0083%. At 12:00, increased volume pushed the price to 103.19, with buyers accounting for 0.63 of transactions; at 13:00, a long upper wick led to a pullback, followed by a rapid recovery to 102.8 at 14:00. The 4H MACD golden cross is continuing, and OI is stable. The price is approaching the 1H Bollinger upper band at 102.99, with dense orders around 102.5 below, while selling pressure has been continuously absorbed. The risk-reward ratio is within an ac
SOL+1.57%
This move doesn't even require me to think—the account is dancing on its own. When the screen was all green, everyone was selling at a loss, but I didn't panic watching the market. It was bottoming without breaking support, while funds quietly entered—the signal worked better than any analysis.

$SNDK $LAB
post-image
SNDK+1.88%
LAB+2.32%
Everyone’s staring at BNB’s 771.6—but the real trap is 788.7, not the floor.

$BNB /USDT - SHORT

Trade Plan:
Entry: 769.8 – 773.4
SL: 788.7
TP1: 758.8
TP2: 750.3
TP3: 737.5

Why this setup?
- 4h bias is SHORT with 55.4 confidence, yet 1D trend is *range*—so this isn’t a breakout, it’s a fade.
- RSI 15m at 49.58 = zero momentum; price is coiling inside a 769.8–773.4 pocket.
- Why now? ATR 1h (7.1) is shrinking—volatility compression precedes a 2–3% expansion. Targets 758.8 (TP1) then 750.3 (TP2) are the path of least resistance if 771.6 breaks down.
- Invalidation is clean: 714.6. Ris
BNB+7.27%
Everyone’s staring at H/USDT’s bounce—but the 4H tape just whispered a secret that 95% of traders will ignore.

H/USDT - SHORT

Trade Plan:
Entry: 0.07631 – 0.07705
SL: 0.08024
TP1: 0.07401
TP2: 0.07222
TP3: 0.06955

Why this setup?
- RSI (15m) is pinned at 33.52—weak momentum, not oversold enough to reverse a bearish 1D trend.
- ATR (1h) at 0.001485 means volatility is contracting—perfect setup for a liquidity sweep below 0.07631.
- With TP1 at 0.07401 and TP2 at 0.07222, the path of least resistance is down, not up.
- Why now? The 0.07960 invalidation is miles away, giving shorts ro
$UNI ‌UNi's real revenue expansion has only just begun.
UNI+15.53%
Everyone’s long $CL /USDT at 91.78—except the 4h tape just whispered a secret.

$CL /USDT - SHORT

Trade Plan:
Entry: 91.69 – 91.87
SL: 92.60
TP1: 91.17
TP2: 90.76
TP3: 90.14

Why this setup?
Why now?
- 1D is range-bound, so no breakout fuel—only mean reversion.
- 15m RSI at 60.4 is fading; momentum is stalling right at resistance.
- ATR (1h) at 0.34 means tight stops—but TP1 at 91.17 is a 0.6% drop that respects the range floor.
- Confidence is weak (55), so this is a scalp, not a saga.

Debate:
Are you fading the 91.78 pop for TP1, or does the range fake you out into 92.39 first?
CL+0.88%
🔥 Today, you see the price at the bottom… and tomorrow, you may see it at the top.
And the question then will be:
Were you only watching EGY? 👀
Or did you own some and sell it early, whether at a loss or for a small profit?
In the market, the hardest thing is not seeing the opportunity…
but knowing its value before everyone else sees it.
Opportunities do not remain available forever; otherwise, they would not be called opportunities in the first place. ⏳🔥
EGY/USDT is still in its early stages… and the story is not over yet. 🚀
Think calmly, do not let FOMO or fear drive your decision, and d
EGY
EGYEgypt
Gate.Fun
MC:$140.15KHolders:1254
100%
  • 3
$TEL BOUGHT MORE HERE NOW FUCKIN SEND IT!!!
post-image
TEL-0.36%
peaq chart btw
post-image
PEAQ-1.68%
If you're reading this & you sell cash secured puts... I need you to do one thing.
Add up every dollar of cash you've had parked as collateral over the last 5 years.
Now pull up the $Q chart for those same 5 years.
That's what your collateral missed.
Not what you lost. What you never got. It doesn't show up on any statement, there's no red number, so nobody ever counts it.
You won your trades. Most puts expired, you kept the premium, high fives.
BUT! your collateral sat next to one of the best 5 year runs in history earning essentially nothing.
I ran the same trades. Same strikes. Same premium
post-image
VOO-0.36%
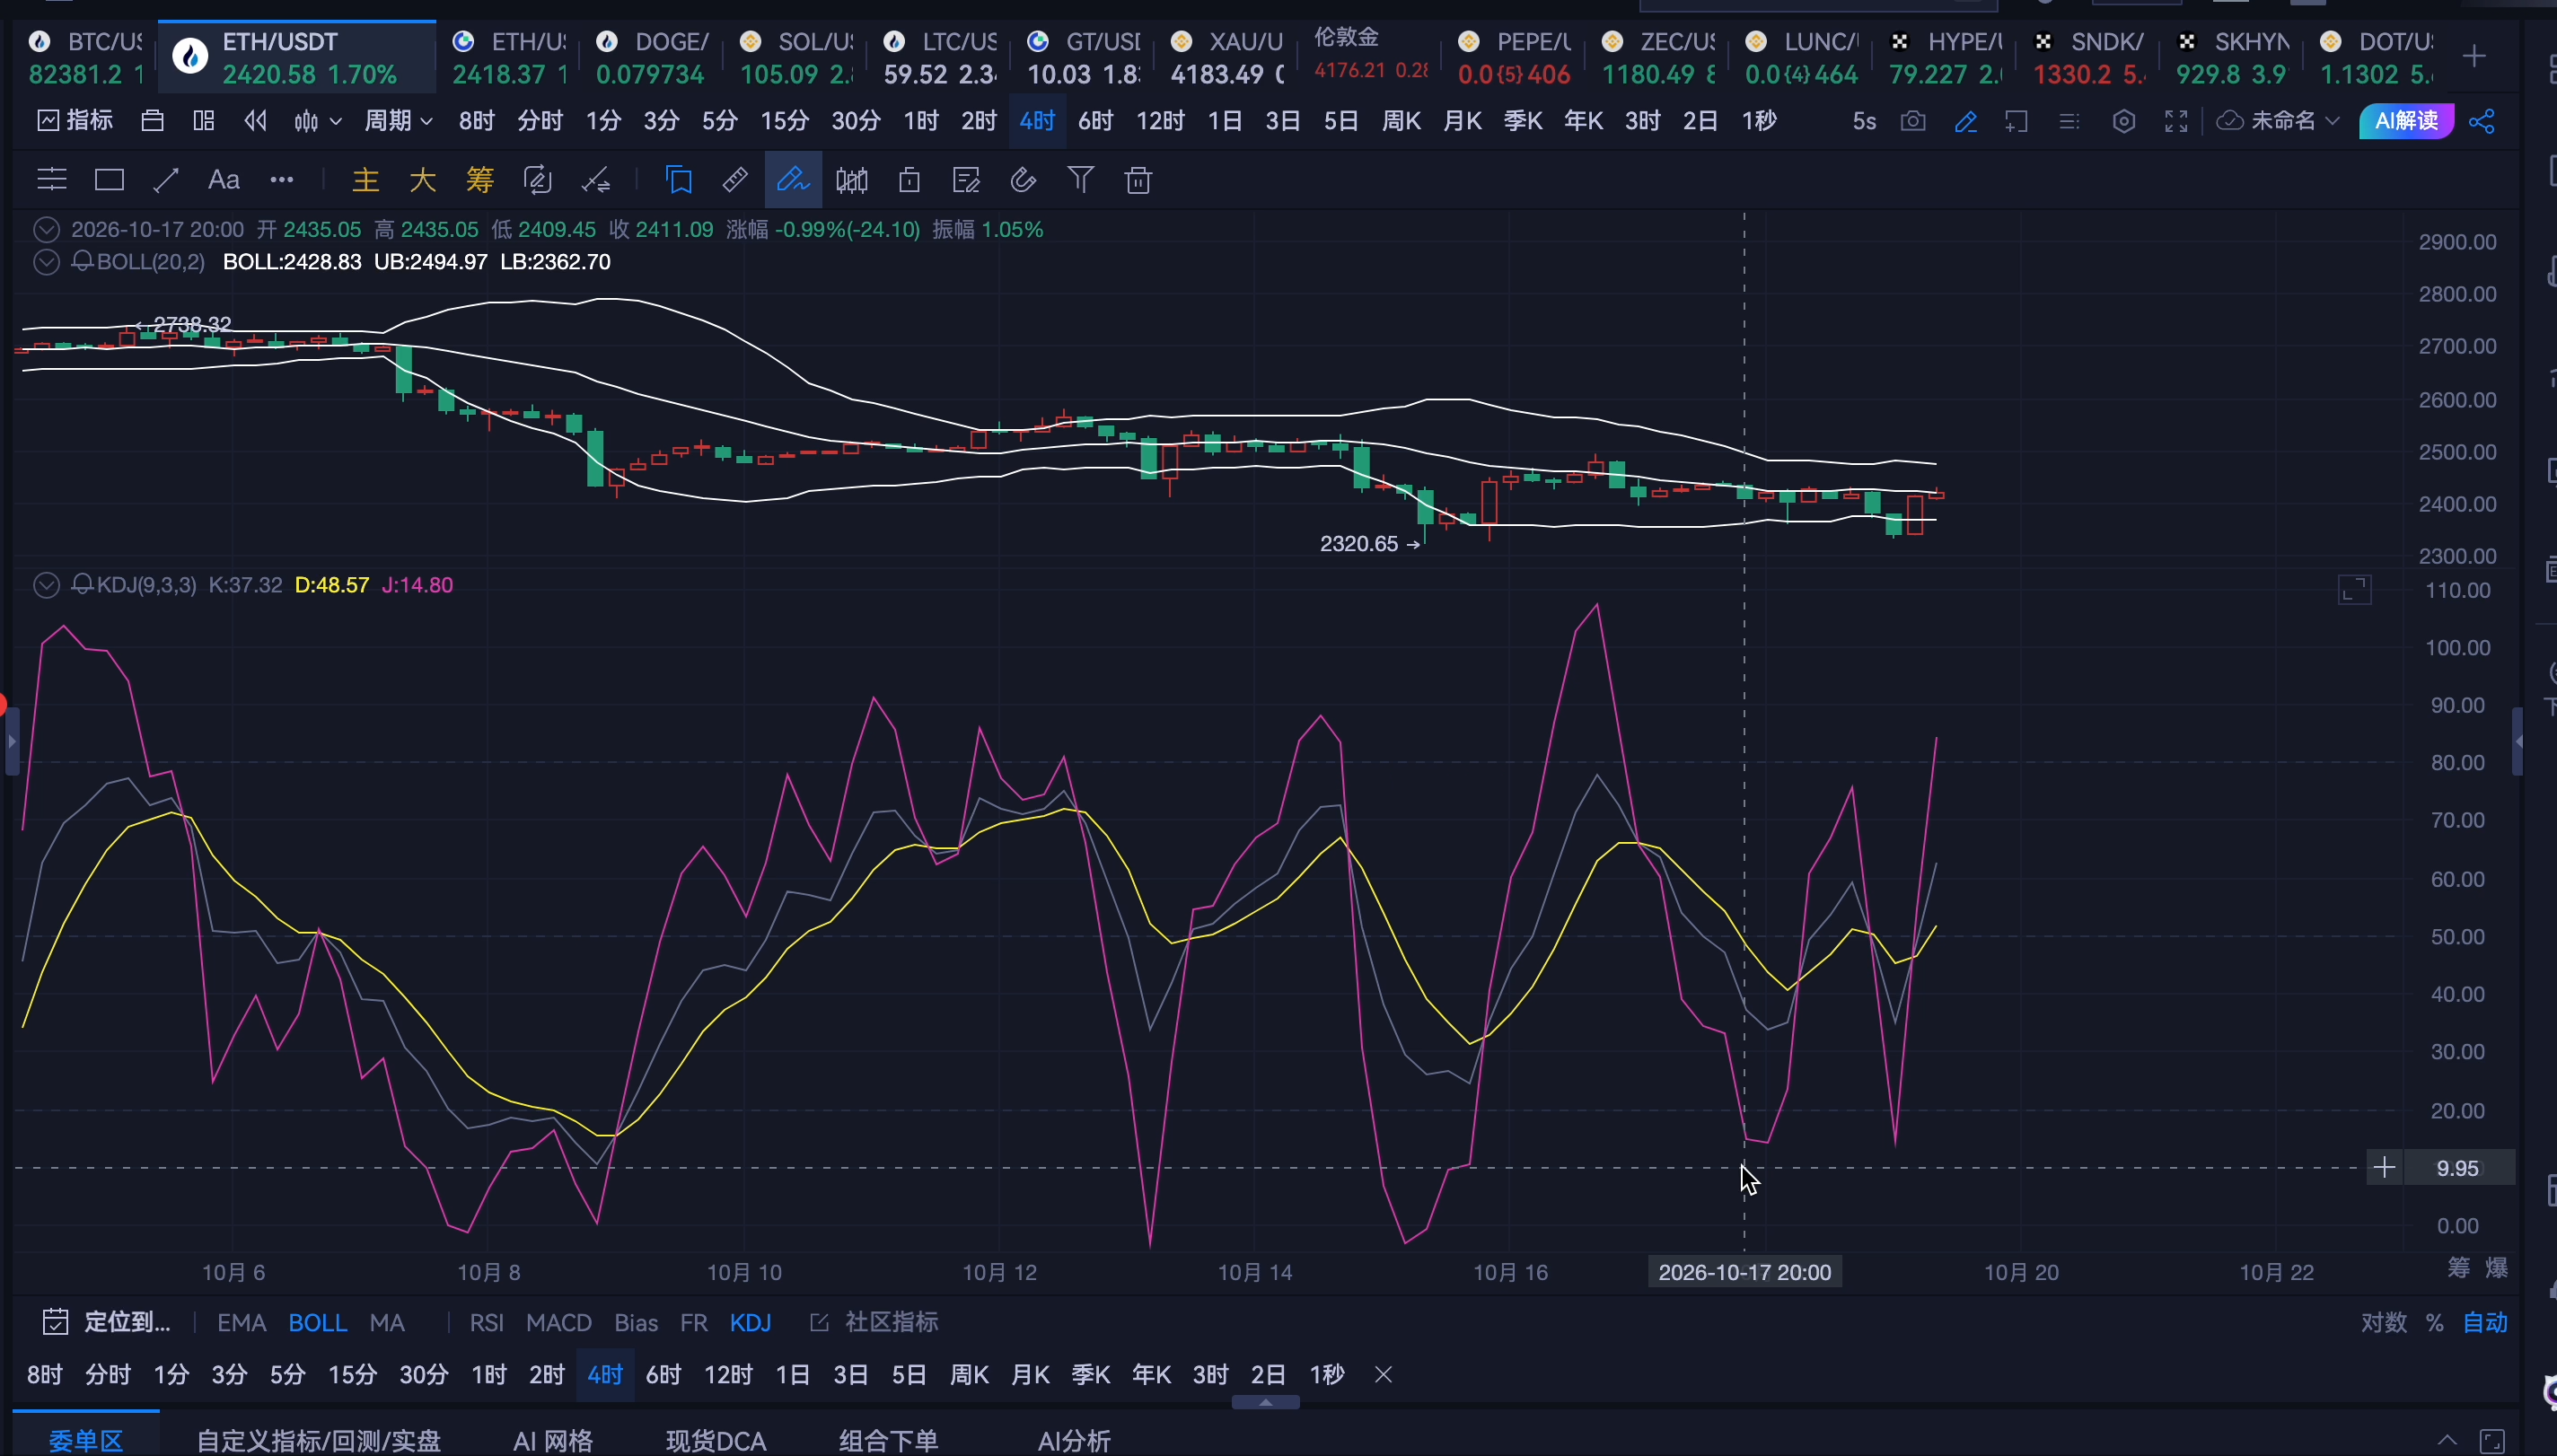
$ETH Signal】Long | 1H Bollinger upper band breakout + MACD momentum expansion
$ETH RSI(1H)64.05, with the price at 2482.53 holding above the 1H Bollinger upper band at 2481.64.
The 1H MACD histogram is 3.87, while the 4H MACD histogram is 0.47 and remains in a bullish crossover state, with short-term momentum clearly dominant. EMA20/50 are tightly clustered around 2454-2462, and the price is above all moving averages. The order book Bid/Ask ratio is 0.70, with sell orders relatively heavy, so chasing longs directly carries a high risk of getting wicked. OI is stable, the funding rate is 0.005
post-image
ETH+1.02%
BTC+0.05%
SOL+1.57%
Everyone’s chasing the 15m RSI bounce on $ESPORTS /USDT—but that’s exactly where the trap snaps shut.

$ESPORTS /USDT - SHORT

Trade Plan:
Entry: 0.01484 – 0.01492
SL: 0.01527
TP1: 0.01459
TP2: 0.01439
TP3: 0.01410

Why this setup?
- Daily trend is **bearish**, and the 4h setup is screaming SHORT at 95% confidence.
- The 15m RSI at 56.89 is a weak pullback, not a reversal—price is stalling under the 0.01488 pivot.
- Why now? ATR (0.000163) shows tight coils; the next leg down targets 0.01459 (TP1) and 0.01439 (TP2) before the daily close.
- The invalidation at 0.01530 is clear—risk is
ESPORTS+0.68%
That said, don't get greedy trying to catch the very last bit of the move. I'll take profit on 80% first to lock in the gains, and place a breakeven stop on the remaining 20%. If it keeps pumping, I'll let the profits run; if it pulls back, I won't let the gains turn into a loss.
$DOGE $ZEC
post-image
DOGE+7.01%
ZEC-1.52%
$4 Signal】MACD dual-timeframe expansion, follow long
$4 RSI (4H) 80.32, 1H 77.68; MACD dual-timeframe bars expanding, with price moving along the upper Bollinger Band. The latest 4H candle closed at 0.034113, with aggressive buy orders accounting for 52%. The funding rate is 0.1381%, long position costs remain high, and the order book has not been overwhelmed. Order-book depth imbalance is -0.78%, with slightly greater sell-side depth. Risk-reward ratio 1.5; trade the momentum and do not overstay.
🎯Direction: Long (long)
⚡Entry/limit order: 0.03403459 - 0.03413700
🛑Stop-loss: 0.03379563
🚀T
post-image
4+37.54%
BTC+0.05%
ETH+1.05%
SOL+1.57%
Everyone’s watching HYPE’s 4h breakout—but I’m fading the crowd until this RSI prints a lie.

$HYPE /USDT - LONG

Trade Plan:
Entry: 85.800 – 86.102
SL: 84.505
TP1: 87.035
TP2: 87.758
TP3: 88.843

Why this setup?
- 1D trend is bullish, yet the 15m RSI at 64.16 screams overbought exhaustion before the 4h close.
- Entry zone 85.80–86.10 is a liquidity magnet; ATR (0.60) says volatility is coiling for a 1.5% snap either way.
- Why now? TP1 at 87.03 is only 1.2% away—but the 95% confidence LONG is priced for a “sure thing,” which is exactly when traps trigger.

Debate:
If the 4h candle clo
HYPE+1.05%
Everyone’s staring at Bitcoin—but ZEC just flashed a 95% long signal that nobody sees yet.

$ZEC /USDT - LONG

Trade Plan:
Entry: 1009.13 – 1017.39
SL: 973.59
TP1: 1043.02
TP2: 1062.85
TP3: 1092.61

Why this setup?
Why now? The 4H timeframe is primed while the 1D trend stays bullish. RSI on the 15m sits at 40.87—cooling off without breaking down. That’s the sweet spot: entry ref at 1013.26, with TP1 at 1043 and TP2 at 1062.85. ATR shows controlled volatility (16.53), so the move isn’t overheated. This is a textbook pullback-buy setup, not a chase.

Debate:
Are you loading ZEC before TP2, o
ZEC-1.52%
🚀 NVDA Tokenized Stock: The AI Super-Cycle Continues! Are We Gearing Up for a New ATH? 🚀
Nvidia (NVDA) is showing incredible resilience, and the charts are printing exactly what bulls want to see. Trading at $230.40 (+0.87%), NVDA has staged a massive recovery. Let’s dive into the technicals across multiple timeframes to see where this AI giant is heading next on Gate.io!
📈 1-Day Chart Analysis:
The Ultimate Bounce
The daily chart is a masterclass in trend recovery. After tapping the $190 support level in late July/early August, NVDA has executed a te
NVDA+0.87%
  • 5
  • 2
Nonfarm payrolls beat expectations—should BTC be cautious? The real pressure comes from here
U.S. nonfarm payrolls increased by 162,000 in August, far exceeding market expectations, while the unemployment rate held at 4.1%. After this data was released, the market's first reaction was very direct: expectations for Fed rate cuts cooled, and interest rates once again became the “sword of Damocles” hanging over risk assets.
For BTC, this logic is particularly important.
Over the past period, one of the core narratives driving the crypto market higher has been improving liquidity. If the U.S. econ
NVDA+0.87%
  • 19
BTC & ETH Weekly Momentum Improves! Could September become stronger after the early volatility?
live-cover
LIVE431
Load More

Join 40 M users in our growing community

⚡️ Join 40 M users in the crypto craze discussion

💬 Engage with your favorite top creators

👍 See what interests you

View More