Square
Following
Hot
News
Profile
Share your thoughts
placeholder
Article
On the daily chart, Xiao Huangyu remains in a bearish structure of progressively lower highs. After consecutive declines, a candlestick with a lower shadow appeared, indicating a short-term willingness to stabilize and recover, and a technical rebound may emerge. However, the bullish candle's body is relatively weak and failed to break above the point where the previous decline began; essentially, it remains a pullback recovery
On the 4-hour chart, the price staged a slight rebound after stabilizing at a low, with several small bullish candles formed consecutively in the short term. However, t
post-image
BTC+0.68%
ETH+2.58%
#USSeptemberPPIBeatsExpectations
🇺🇸 US September PPI Beats Expectations: What Does It Mean for Markets?
The US Producer Price Index (PPI) surged by 1.3% in September, significantly exceeding market expectations of 0.5–0.6%. Annual producer inflation climbed to 6.3%, highlighting renewed inflationary pressures across the economy.
🔥 Key Market Implications
📈 Federal Reserve: Persistent inflation could delay interest rate cuts or keep monetary policy tighter for longer.
💵 US Dollar & Bonds: Higher inflation expectations may increase market volatility and influence Treasury yields.
₿ Cryptoc
BTC+0.60%
GT+1.46%
ETH+2.45%
  • 1
Bro, don’t worry—time will prove this is the final dance!
post-image
Houston, we have a problem!
The G-force is steadily increasing 🥸
post-image
I placed a short order at 4190 and added one more. Are your short positions around 4182 and 4190?$XAUUSD ‌
post-image
XAUUSD+0.08%
  • 2
in the depth of purgatory (gigachad mode)
post-image
$BTW Stay bearish! This kind of LAB coIa freak coin’s market cap basically fluctuates around 8–9 billion, and a sharp crash could hit at any moment, with a 90% plunge entirely possible.
The longer they pump it, the higher the cost will get. It’s simply not worth it for the main players, who would be better off abandoning it and starting over with a new coin!
post-image
BTW-14.22%
LAB+6.36%
  • 1
$TRX TRX at End of Multi-Year Correction, Could go to $55+
TRX has spent months in an extremely tight range within what I’m counting as wave-e of E. My volatility-compression indicator is showing extreme, persistent readings, with the current stretch approaching its historical duration record.
I’ve labeled the potential 2018–2026 correction as a triangle, although other interpretations remain possible. The more immediate focus is the contracting structure developing from the 2024 high. If this triangle is completing, the count favors an upward thrust.
The bigger question is what that triangle
post-image
TRX+1.25%
#USSeptemberPPIBeatsExpectations
#每周来晒
‍#USSeptemberPPIDataRelease
‍#美国9月PPI大超预期
Producer prices just posted their biggest monthly jump since March 2022, and the market’s first reaction was a shrug. That mismatch is the story, so here’s how I’m reading it.
1. The print
PPI rose 1.3% m/m against roughly 0.5–0.6% expected, and 6.3% y/y against about 5.3% (surveys varied), the highest annual rate since December 2022. Core was 0.7% m/m (0.3% expected) and 5.0% y/y (4.4% expected). Producer gasoline jumped 20.3% and energy 10.8%, but core wasn’t a gasoline story. My math: 1.3% annualizes to r
BTC+0.60%
DOW+1.59%
NDAQ+1.57%
SPX-0.34%
GAS-0.49%
  • 3
solana:6sEf597zqUxoJeW1znjtx8MUPsXFFF7zjjH2KSG8zF9y
6sEf597zqUxoJeW1znjtx8MUPsXFFF7zjjH2KSG8zF9y
Potential to go 80%
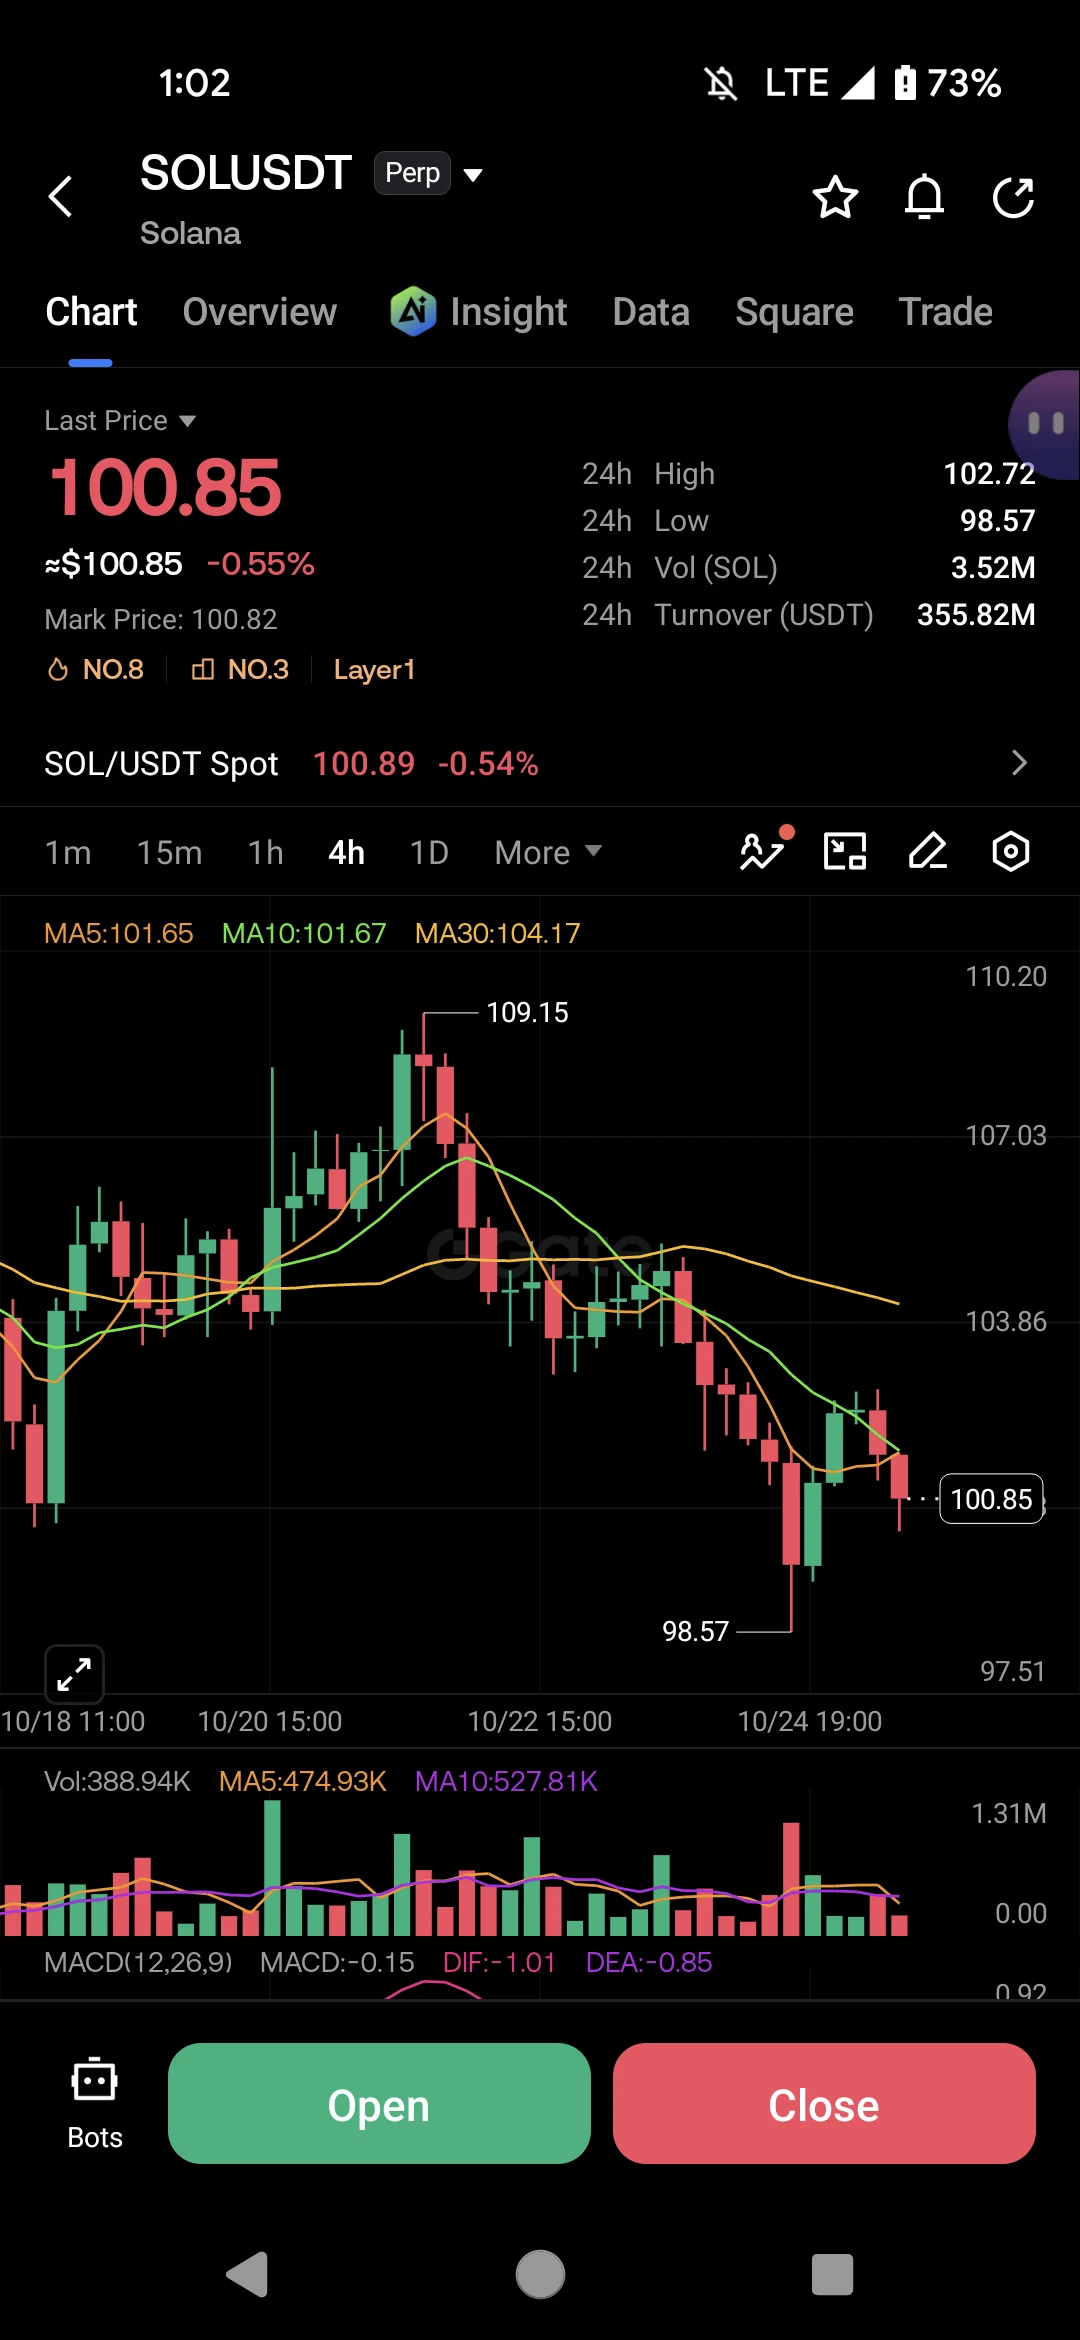
#crypto $sol
SOL+1.71%
Hi lawyers!
Just conducting some business transactions 👀
post-image
September PPI Shock: 6.3% YoY - The Production Side Inflation is Back, and The Fed Game Has Changed.
The data is out. The US September Producer Price Index, released on October 15th at 8:30 AM ET, was not just a beat, it was a terrifying upside surprise that has completely rewritten the rate path.
If you were expecting a cool-down, you were wrong. Here is the academic breakdown of what really happened.
1. The Numbers: Expectations vs. Reality - A Massive Overshoot
The consensus was clear before the release: Headline PPI to rise 0.5% - 0.6% MoM, and 5.3% YoY. Core PPI to rise 0.3% MoM.
The real
post-image
BTC+0.60%
US500+0.23%
XAUUSD+0.08%
  • 7
  • 3
Hammer Bobi October 16, 2026 ETH Market Analysis
Market review: The previously mentioned 2330 and 2300 were successfully bottom-fished
Today's market analysis: A very long lower wick on the daily chart
The market is oscillating around the daily box range of 2325—2517 and 2548
Holding above 2440, 2460, and 2480 targets 2500 and 2540
Historical key levels 2380 and 2400 remain valid
Prioritize going long, with shorting as a supplement; sell high and buy low within the range—do not blindly hold out of conviction
Watch the market if 2400 and 2410 br
ETH+2.45%
morning update
live-cover
LIVE2,161
🚨 FED CHAIR KEVIN WARSH: KEY TAKEAWAYS!
Inflation control remains a priority, but no rate-cut hints
Strong investment is driving US economic growth
Global economy proving more resilient than expected
Bullish on AI-driven productivity, but job impacts remain uncertain
AI optimism is rising, but the Fed’s rate path remains unclear.
post-image
Semiconductors completely wrecked my trades—they somehow turned A-shares’ T+1 into T+0.
post-image
$STRK Just blindly go short and that's it.
post-image
STRK+12.59%
🧧 Gate Live’s daily red packet rain is here—did you grab yours today?
🎙 Chat about hot market trends in real time, watch the market with professional hosts online, and join voice interactions anytime to discuss hot topics and find opportunities together~
Look for livestreams with the red packet icon on the cover—enter to participate in the red packet giveaway!
⚡ Get your fingers ready: https://www.gate.com/live#WCTCS7
Came across Tesla and Xiaomi at the same time😂😂
One is flying, while the other is testing whether the suitcase is closed
post-image
US Initial Jobless Claims
live-cover
LIVE1,857
Load More

Join 40 M users in our growing community

⚡️ Join 40 M users in the crypto craze discussion

💬 Engage with your favorite top creators

👍 See what interests you

Trending Topics

USSeptemberPPIBeatsExpectations

91.35k Views1.9k Discussing

US September PPI came in at 6.3% YoY, well above the 5.3% market expectation, pointing to renewed producer-side inflation pressure. Weekly jobless claims were 199K, broadly in line with forecasts. Could hotter inflation further reduce room for rate cuts, and what does it mean for $BTC, US stocks, and gold?

GateWCTCS9GlobalTradingCompetition

37.87k Views6.42k Discussing

WarshIMFSpeech

62.4k Views759 Discussing

View More