Square
Following
Hot
News
Profile
Share your thoughts
placeholder
Article
Tomorrow is Monday, so let's briefly discuss the market outlook.
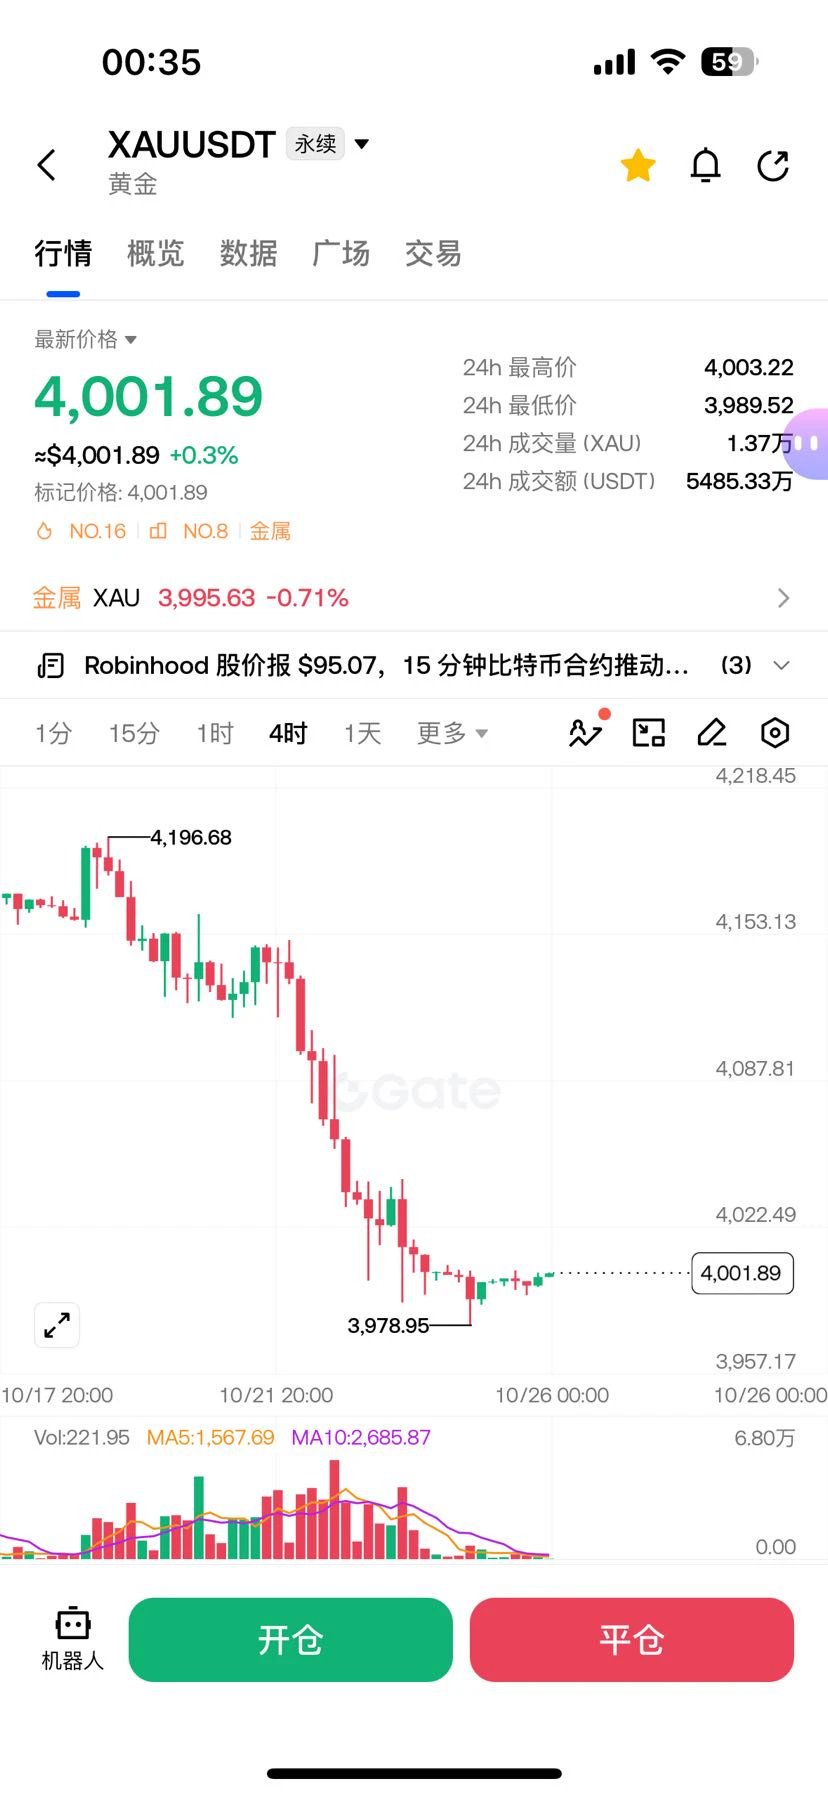
Gold prices fell again last week. The selling pressure in any single move wasn't particularly intense, but the decline was steady, with Friday's close directly below the 4000 level.
For Monday, prioritize shorting at higher levels, with a focus on two resistance levels: 4010 and 4040. If the market rebounds into the range and meets resistance, you can enter short positions. The first target is 3970, followed by 3930. ​
post-image
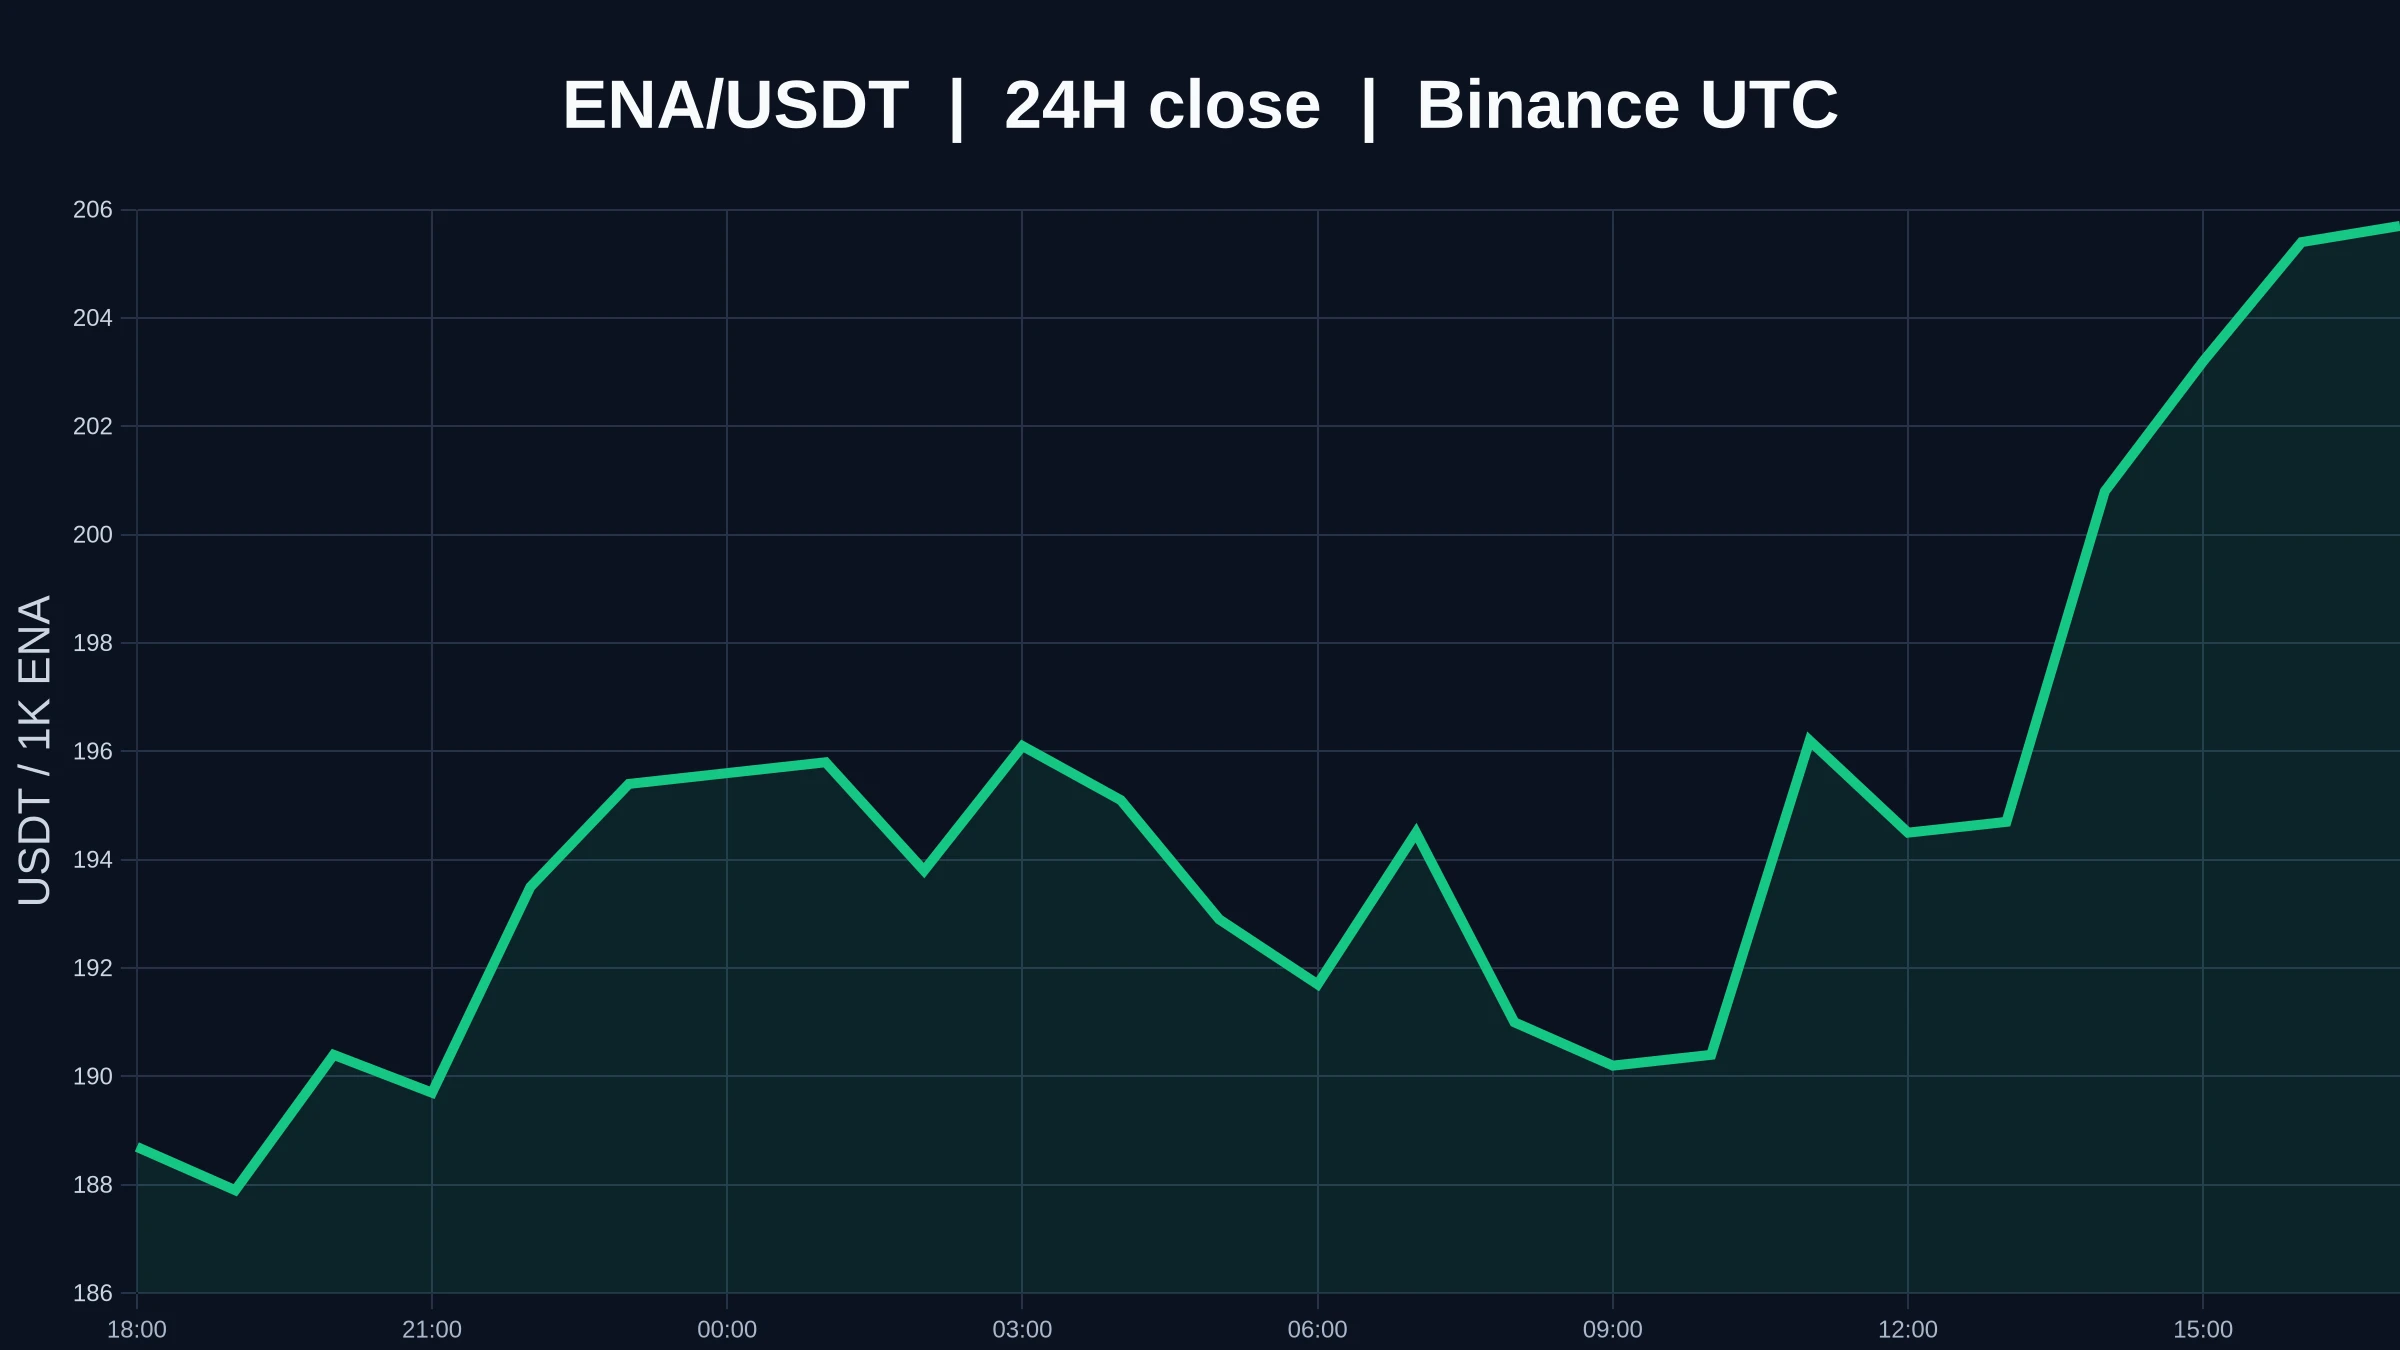
After a sharp 24-hour rally, should $ENA continue higher or consolidate first?
$ENA is now at 0.206 USDT, up +9.87% over 24 hours, fluctuating between 0.1852 and 0.2063. One-hour support is at 0.1859, with resistance at 0.2063; the four-hour direction is strong, while trading participation is only 0.09x. In this snapshot, the price has already broken above the 24-hour high, but volume has not expanded significantly.
My view is that the sharp move has already happened, and the next step is to verify whether it can continue rather than extrapolating the past 24 hours into the future.
The big mo
post-image
ENA+10.55%
Trenches
STONK
S
bade
b
STONK
6GmA...UNgx
Market Cap
$.
Change
.
24h Vol
$.
Holders
.

BTC
B
bade
b
BTC
C5xp...pump
Market Cap
$.
Change
.
24h Vol
$.
Holders
.
CNPY
C
bade
b
CNPY
0xc6...ddd2
Market Cap
$.
Change
.
24h Vol
$.
Holders
.
ZIG
Z
bade
b
ZIG
0x8c...1145
Market Cap
$.
Change
.
24h Vol
$.
Holders
.
Q
Q
bade
b
Q
0xc0...0589
Market Cap
$.
Change
.
24h Vol
$.
Holders
.
Another successful trade 😎😘 Guys, keep opening short positions on $USELES , as another crash is coming very soon 📉📉
🎯 Final target: $0.10
post-image
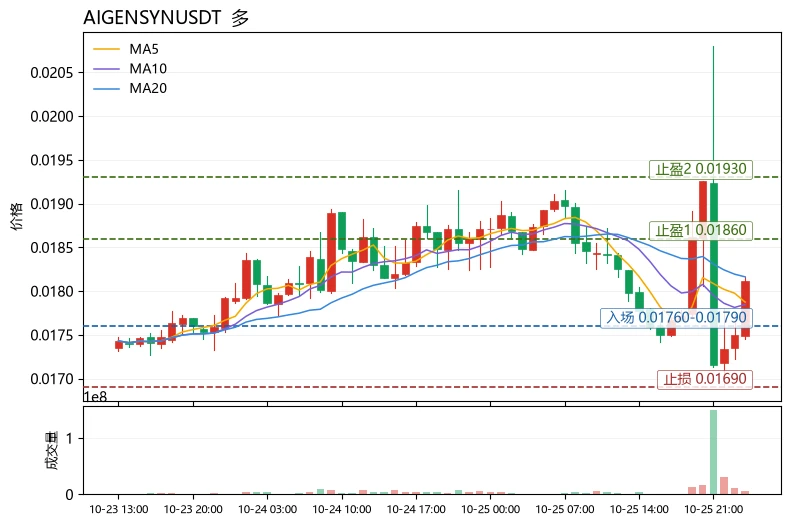
$AIGENSYN is currently at a critical point where the moving averages have not recovered, but bearish momentum is fading. My view is that the short-term bias is bullish; wait for a pullback confirmation rather than chasing the price higher. I’ll start with the conclusion, then use it to demonstrate a reusable method for assessing moving-average health.
To judge whether a trend is healthy, I look at just three things: moving-average alignment, the relationship between price and the moving averages, and whether momentum confirms the move. The current price is 0.01811, and MA5=0.017874 is already
post-image
GTC
GTC芝麻币
Gate.Fun
MC:$0.1Holders:1
0%
AIGENSYN-5.09%
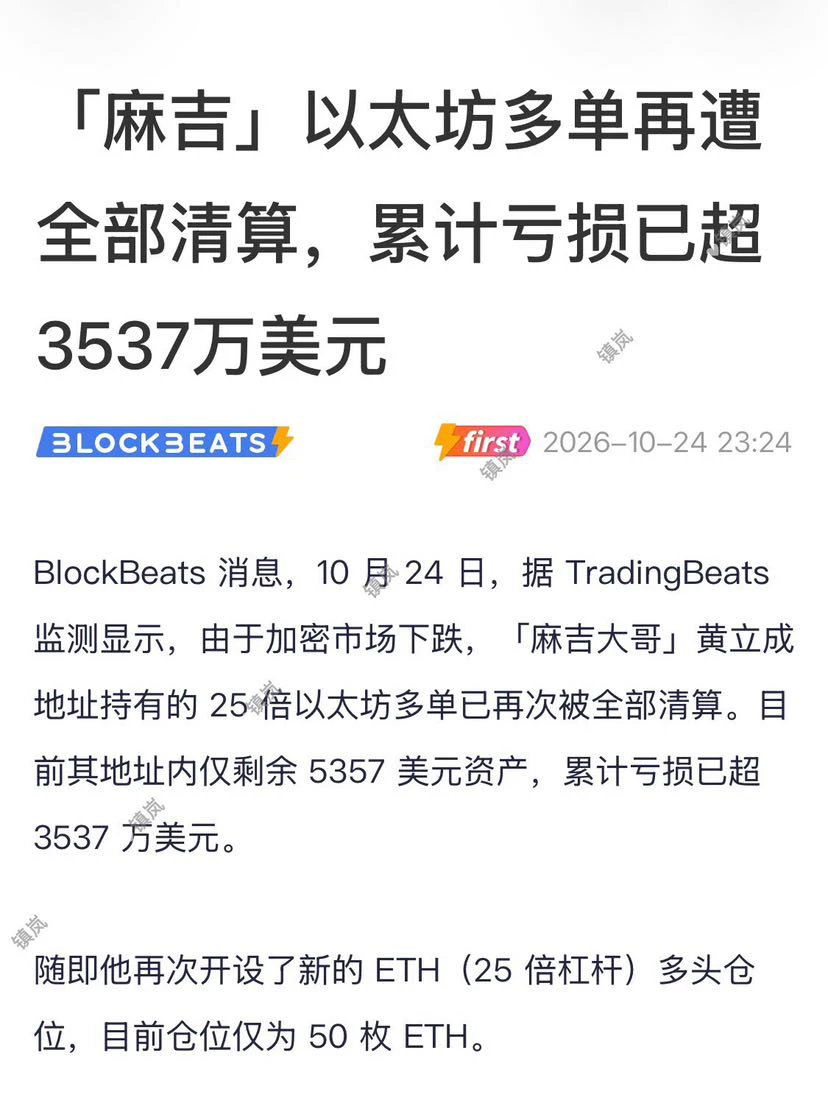
Machi Big Brother’s latest move gives me chills. His 25x $ETH long position was completely liquidated, leaving just over $5,000 in his account, with cumulative losses topping $30 million. Yet he didn’t even pause for breath before opening another 25x position. He’s now holding 50 ETH, moving so fast you’d think he’d never been liquidated.
This isn’t trading anymore—it’s a full-blown gambler’s mindset. Either he’s almost out of bullets and is betting his last scraps on a comeback, or he’s falling for the gambler’s fallacy, thinking that after losing so many times, this time has to be the rebou
post-image
ETH+1.24%
BTC+0.43%
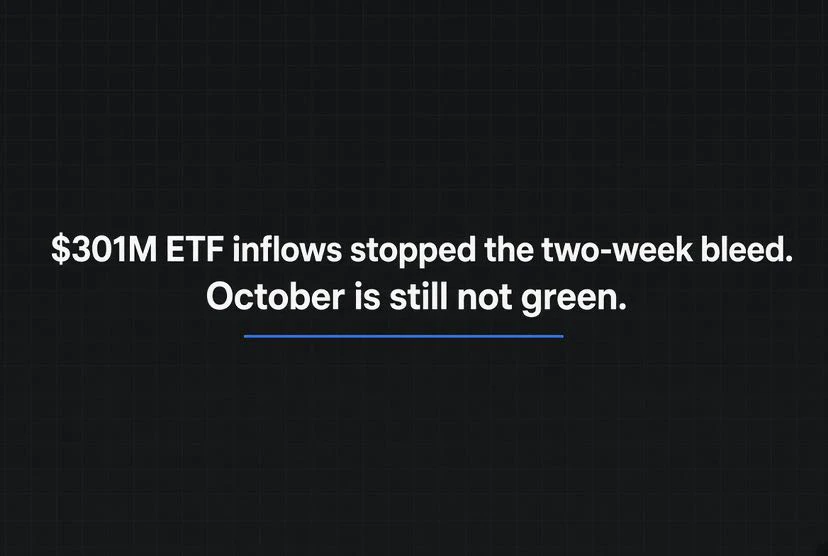
$301M in Bitcoin ETF inflows. Enough to flip October green?
US spot $BTC ETFs finished the latest week with roughly $301 million in net inflows. That broke a two-week run of outflows totaling about $910 million.
The week was not clean. Early sessions brought strong buying, more than $1 billion across the first three days. Thursday and Friday then saw heavy redemptions, including one day near $635 million out. BlackRock’s IBIT carried most of the week’s net positive.
October itself is still not clearly green. Mid-to-late month numbers showed the month still in the red or only barely improved on
post-image
BTC+0.38%
  • 3
  • 1
$BTC ‌#美股财报季 Crypto Scholar: 10.26 Bitcoin (BTC) has five major hurdles bearing down on it, yet it just won’t fall. What is the invisible hand behind it doing?
A follower DM’d me today, saying he’d put the money he’d set aside for rent into the market and asking if he could double it. I read it and didn’t reply. It wasn’t because I was cold; I was genuinely afraid. The most brutal thing about this market isn’t getting the direction wrong—it’s using the wrong money. Leverage, futures contracts, going all-in full-time—touch even one of these, and you’re already halfway to losing. I write these
BTC+0.43%
Long the coins. Short oil.
post-image
$ORDER Down 31.9% in one day, from 0.0736 to 0.0453. This isn't a pullback; it's a slaughter.
First, let's lay out the macro chain: Last week's Fed minutes were hawkish, the dot plot lowered rate-cut expectations, and real interest rates rose. The Nasdaq fell 1.2% that day. High-beta altcoins like $ORDER have maintained a 30-day correlation with the Nasdaq above 0.7, and a negative correlation with the U.S. Dollar Index near -0.6. In other words, when the dollar firms and risk assets come under pressure, less liquid assets like $ORDER are the first to get drained. Today's trading volume of 3
ORDER-31.85%
NAS100+0.30%
USIDX+0.13%
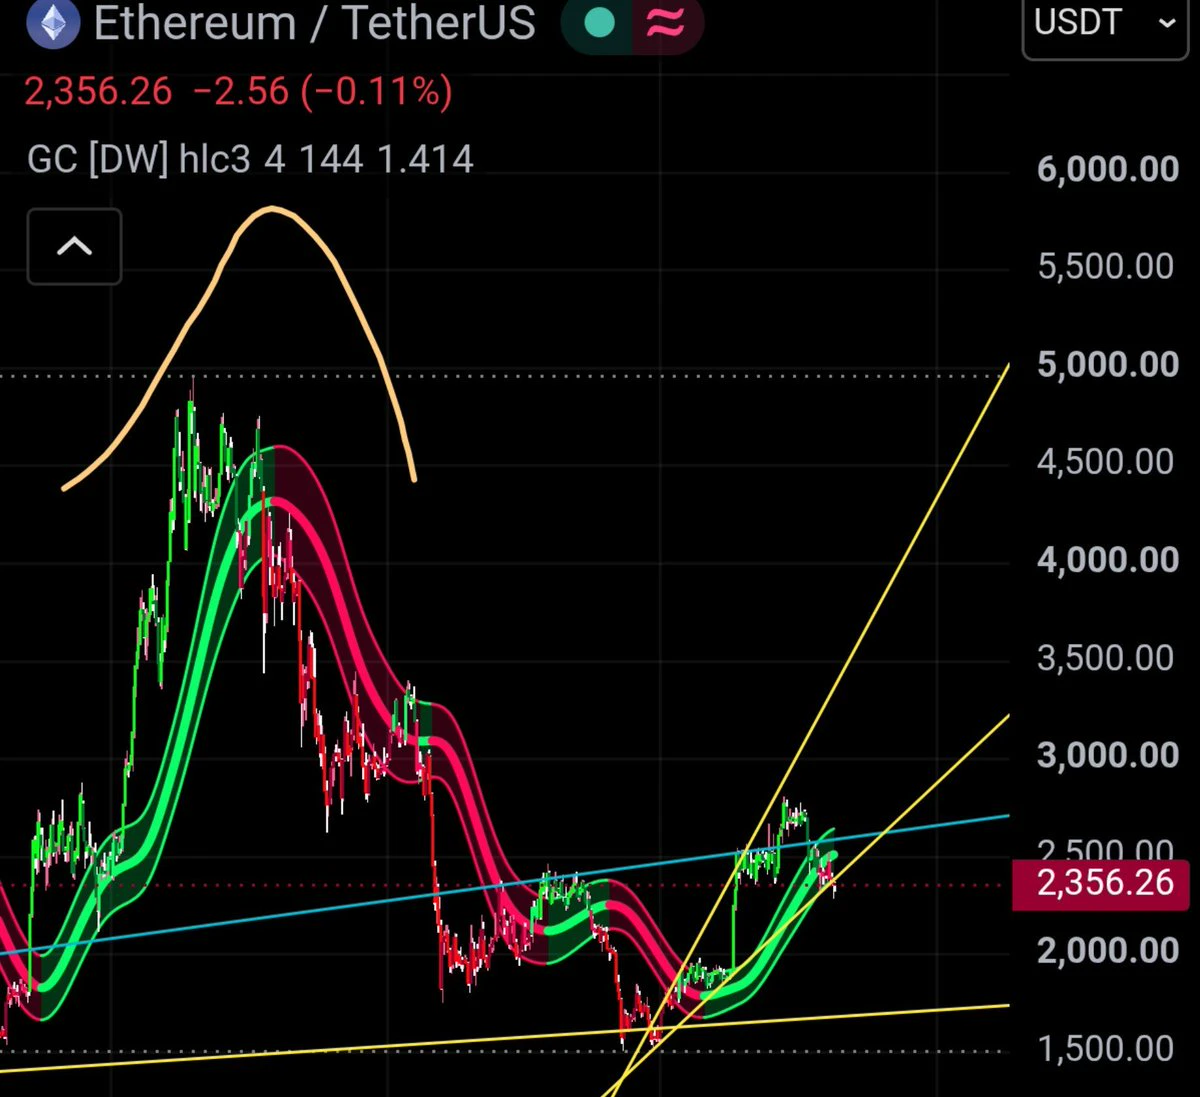
Eth market update
live-cover
LIVE1,324
October presented a split picture for the semiconductor sector: share prices were falling while earnings were rising.
$TSM Third-quarter revenue in U.S. dollars, announced on October 15, rose 41.2% year over year, directly exceeding the top end of guidance, and the midpoint of fourth-quarter guidance implied another 14% sequential increase. But the Philadelphia Semiconductor Index had fallen 18.4% from its October 6 high by the 23rd. With the Fed, macro data, and more than a dozen earnings reports converging next week, the market's core question is: who will close this gap?
$SOXX $NVDA MU LRC
post-image
NVDA+0.61%
[New Streamer] Market Prediction
live-cover
LIVE2,152
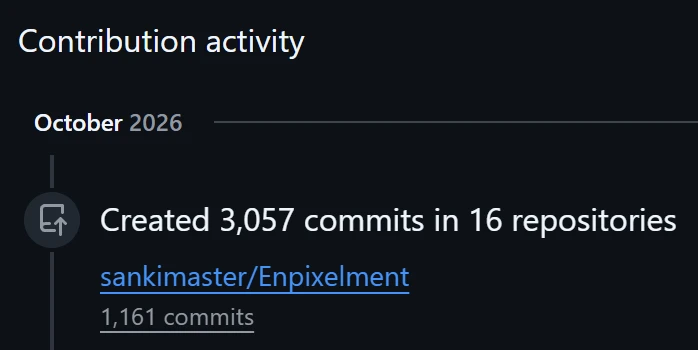
🚀 October 2026 contribution activity so far:
3057 commits on GitHub
#solodev #vibecoding
@claudeai @OpenAI @thsottiaux @bcherny
post-image
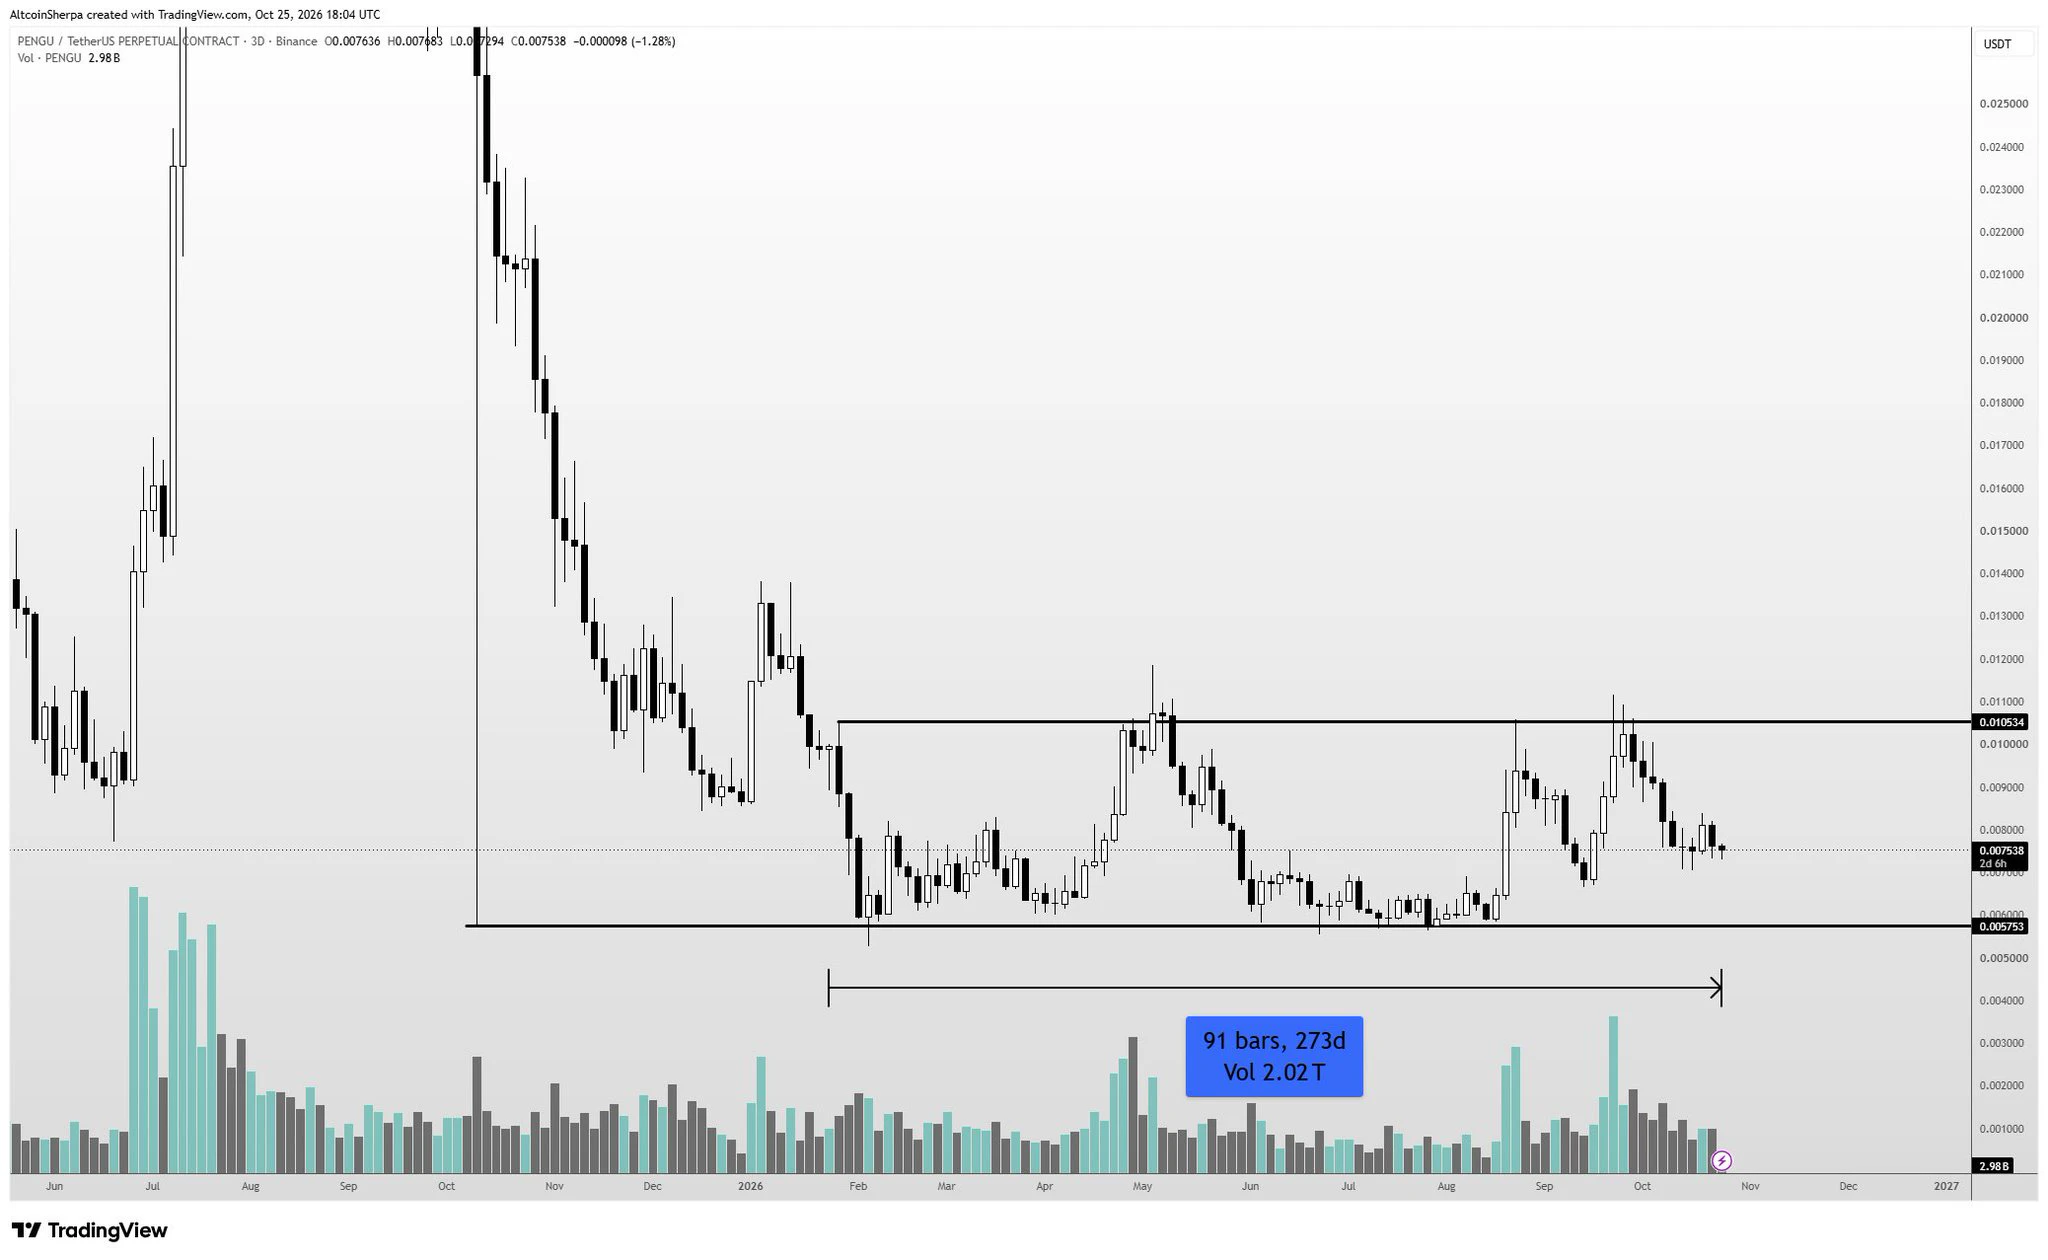
$PENGU isnt a fast trade by any means but I still think it's a decent slow cook and I have a bag of it. It's still a coin that has a gigantic community + tons of products they are consistently shipping across many sectors. I think they're going to keep building and this is still a comfy hold
post-image
PENGU+0.78%
I've never understood why the deluded bitcoiners were so bullish on something so bad
DO NOT TRY THIS AT HOME 🚨⚠️☣️
$ETH
post-image
ETH+1.19%
$HYPE This market action has really shown just how absurd the market is.
I looked into the fundamentals: the U.S.-listed PURR project announced a $100 million buyback plan, but it is buying its own Nasdaq-listed shares, which have absolutely nothing to do with the HYPE tokens circulating on-chain.
The ridiculous part is that a bunch of people took this news as a lifeline for the token and rushed in to become exit liquidity.
Now that the positive news has landed, it has barely made a ripple. The area around $80 is packed with tokens held by people trapped after chasing the highs, and the bears
post-image
HYPE+1.83%
PURR+0.92%
#KOSPIFallsNearly4% #ShareWeekly
KOSPI’s 3.73% Plunge: AI Optimism Meets Market Reality as Investors Reassess Risk
South Korea’s stock market delivered a sharp warning on October 20, 2026, when the KOSPI dropped 3.73% to close at 5,552.74. The decline wiped out the previous session’s gains and highlighted a growing concern across global markets: strong technological growth does not always translate into continuously rising stock prices.
In my view, this sell-off is about more than a single disappointing trading session. It reflects the combination of semiconductor volatility, uncertainty surr
Halloween is coming.
Tianmu has a Halloween vibe all its own.
You can even see people decorating the entire huge exterior wall of their villa with several giant spiders. Don’t underestimate this kind of decoration—it costs money.
I really love Tianmu. There are so many houses I like
that aren’t modern buildings (so-called luxury homes), but their owners
have created a unique aesthetic.
It’s just a shame there’s no one to share this beauty with.
post-image
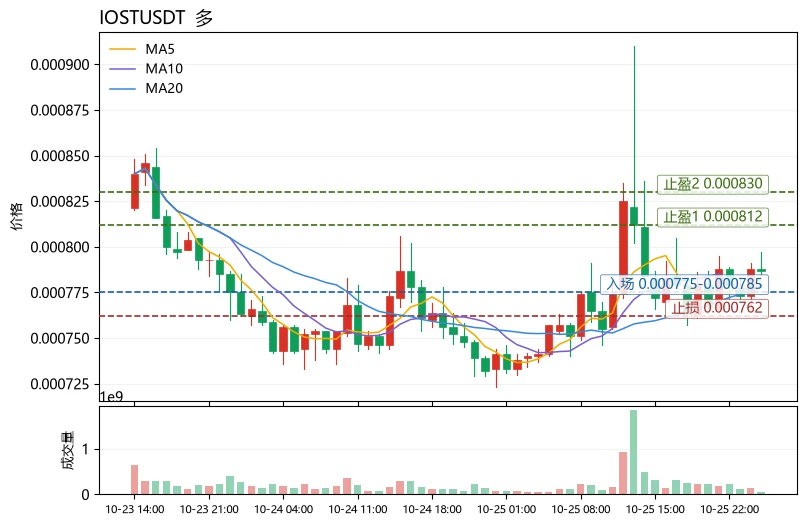
$IOST Current price is 0.000787. The upper Bollinger Band at 0.000812 is the first resistance, while MA20 at 0.000778 and the Bollinger midline at 0.00077775 form a short-term support zone. If this zone fails, watch the lower Bollinger Band at 0.000743.
The 30-candle range is about 23.76%, indicating elevated volatility, while the funding rate of -0.0632% shows shorts are paying and the cost of holding longs is negative, suggesting heavy shorting sentiment. However, the price is above MA5, MA5>MA20, and the MACD histogram is positive, so the bullish structure remains intact. RSI at 53.7 is in
post-image
IOST+5.62%
Hello, Gate Square community! Looking at our screens today, amidst the massive volatility in the bond market, one cannot help but consider what this means for our own portfolios. With the yield on the 30-year U.S. Treasury bond hovering above 5.5% and the 10-year yield approaching the 5.2% mark, we are seeing levels not witnessed since 2002.
So, what does this imply for us? As yields climb, investors find more compelling reasons to shift their capital into interest-bearing assets. When the "risk-free" return is this high, the opportunity cost of holding non-yielding assets—like Bitcoin—increas
post-image
BTC+0.38%
GT+0.81%
ETH+1.19%
SOL+0.94%
XRP+1.71%
Load More

Join 40 M users in our growing community

⚡️ Join 40 M users in the crypto craze discussion

💬 Engage with your favorite top creators

👍 See what interests you

Trending Topics

USEarningsSeason

99.7k Views3.52k Discussing

The U.S. Q3 earnings season is in full swing, with major tech companies including Tesla and Meta reporting results. Market focus is shifting beyond revenue and profit toward AI spending, capital expenditure, margins and forward guidance. Which company’s earnings are you watching most closely?

GateWCTCS9GlobalTradingCompetition

720.76k Views8.09k Discussing

USConsumerSentimentNearRecordLow

12.12k Views299 Discussing

View More