
Share your thoughts
placeholder
Article
I need to share a quick story about how unpredictable this market can be. 😅 Yesterday, we got hit with a double dose of regulatory and macro pressure. The Federal Reserve went ahead with its first rate hike since 2023, and at the same time, the highly anticipated Clarity Act failed to pass. By all traditional rules, this should have triggered a massive sell-off.
But crypto had other plans! 🚀 Instead of crashing, the major assets bounced back beautifully, and we are seeing some incredible green candles across the board. It is a classic case of bad news bringing unexpected strength. It feels
post-image
BTC-0.34%
SOL-1.01%
  • 7
  • 3
$SYN The most unusual detail today is not that it fell 12.39%, but that the funding rate remains positive at +0.0050%. As the price gets hammered down, longs are still paying shorts, indicating that leveraged long positions have not been fully flushed out. Under this structure, any rebound is often unsustainable.

Using this coin as an example, here is a reusable method: use moving-average alignment to assess trend health. In a healthy downtrend, MA5 should continue to suppress MA20, with the price tracking the lower Bollinger Band. SYN currently has MA5=0.210602 below MA20=0.223692, confirming
post-image
FIL-12.08%
LSK-7.64%
Nobody is talking about this SYMBOL setup hiding in plain sight.

$BTC /USDT - LONG

Trade Plan:
Entry: 81075.38 – 81244.44
SL: 80348.42
TP1: 81768.52
TP2: 82174.27
TP3: 82782.88

Why this setup?
Why now? The daily trend is bullish and the 4h bias is long, so momentum is stacked in one direction. The 1h ATR of 338.12 means each candle can swing nearly 340 points, so position sizing is critical. The 15m RSI at 60.17 shows room to run before overbought, and the entry zone between 81075.38 and 81244.44 offers a precise risk-defined zone. TP1 at 81768.52 and TP2 at 82174.27 give clear exits, wh
BTC-0.35%
#GarrettJinHolds320MInZEC
Garrett Jin’s ZEC position is a lot more interesting than a simple “whale is shorting ZEC” headline.
The records he shared show roughly 202,080 ZEC still held in spot, worth around $320M at the reported price. At the same time, his Hyperliquid position is a short of about 38,000 ZEC, worth roughly $60M. The short is currently carrying a large unrealized loss.
But look at the structure.
Around 202K ZEC spot versus roughly 38K ZEC short.
That means the short represents only a portion of his overall ZEC exposure. If the purpose is hedging, the logic is very different fr
post-image
ZEC-0.24%
( new streamer) market overview
live-cover
LIVE60
We’re checking out first thing in the morning! 👀👀
Prepared a little surprise (hope the housekeeper won’t be startled)
post-image
$BTC #BTCRetakes80K
Bitcoin Reclaims $80,000:A Recovery Built on Liquidations, ETF Flows, and a Shift in Sentiment
Bitcoin has pushed back above the $80,000mark for the first time in over ten days, recovering ground lost after last week's Federal Reserve rate hike. The move was not a slow grind higher. It was a sharp, almost violent repricing that caught the market off guard.
The first phase of the rally was mechanical. In a single hour, more than $183million in short positions were liquidated as Bitcoin broke through the $80,000level, forcing bearish traders to buy back their positions at a
User_any
$BTC #BTCRetakes80K
Bitcoin Reclaims $80,000: A Recovery Built on Liquidations, ETF Flows, and a Shift in Sentiment
Bitcoin has pushed back above the $80,000 mark for the first time in over ten days, recovering ground lost after last week's Federal Reserve rate hike. The move was not a slow grind higher. It was a sharp, almost violent repricing that caught the market off guard.
The first phase of the rally was mechanical. In a single hour, more than $183 million in short positions were liquidated as Bitcoin broke through the $80,000 level, forcing bearish traders to buy back their positions at a loss. That forced buying added fuel to the move, pushing the price as high as $80,930 on Friday. By Saturday, the price had settled into a consolidation range, trading near $81,300 as of this writing.
The ETF Bid Returns
Beneath the price action, the flow data tells a more structural story. U.S. spot Bitcoin ETFs returned to net inflows on Thursday, absorbing $159.45 million, led by a sharp rebound in BlackRock's IBIT. That followed a massive $433 million inflow day on September 18. The pattern is notable because it suggests that institutional allocators, who had paused during the Fed-driven selloff, are stepping back in as the price stabilizes.
This is not a speculative surge driven by retail leverage. The funding rates, which measure the cost of holding long positions in the perpetual futures market, have returned to neutral. That means the rally is not being driven by an overcrowded long side that could unwind violently. The derivatives market is balanced.
The Technical Battlefield
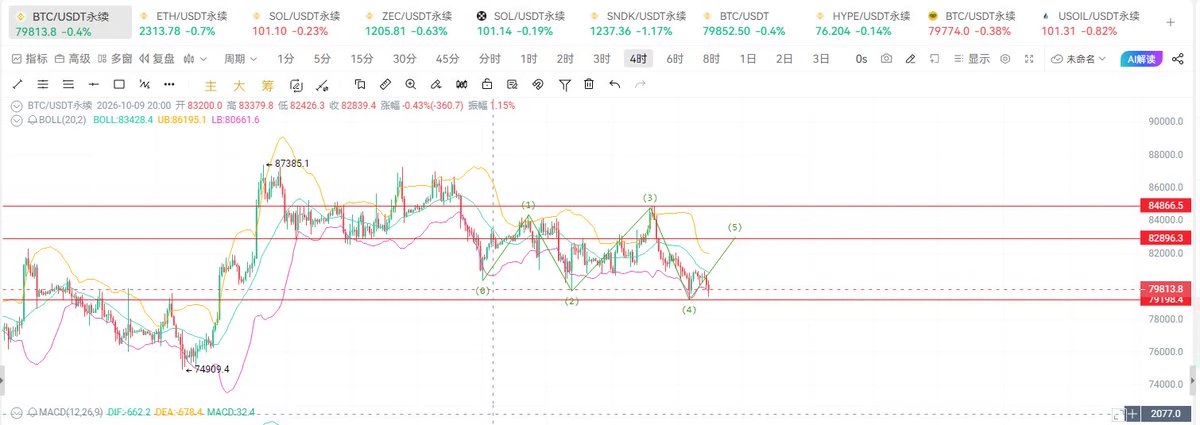
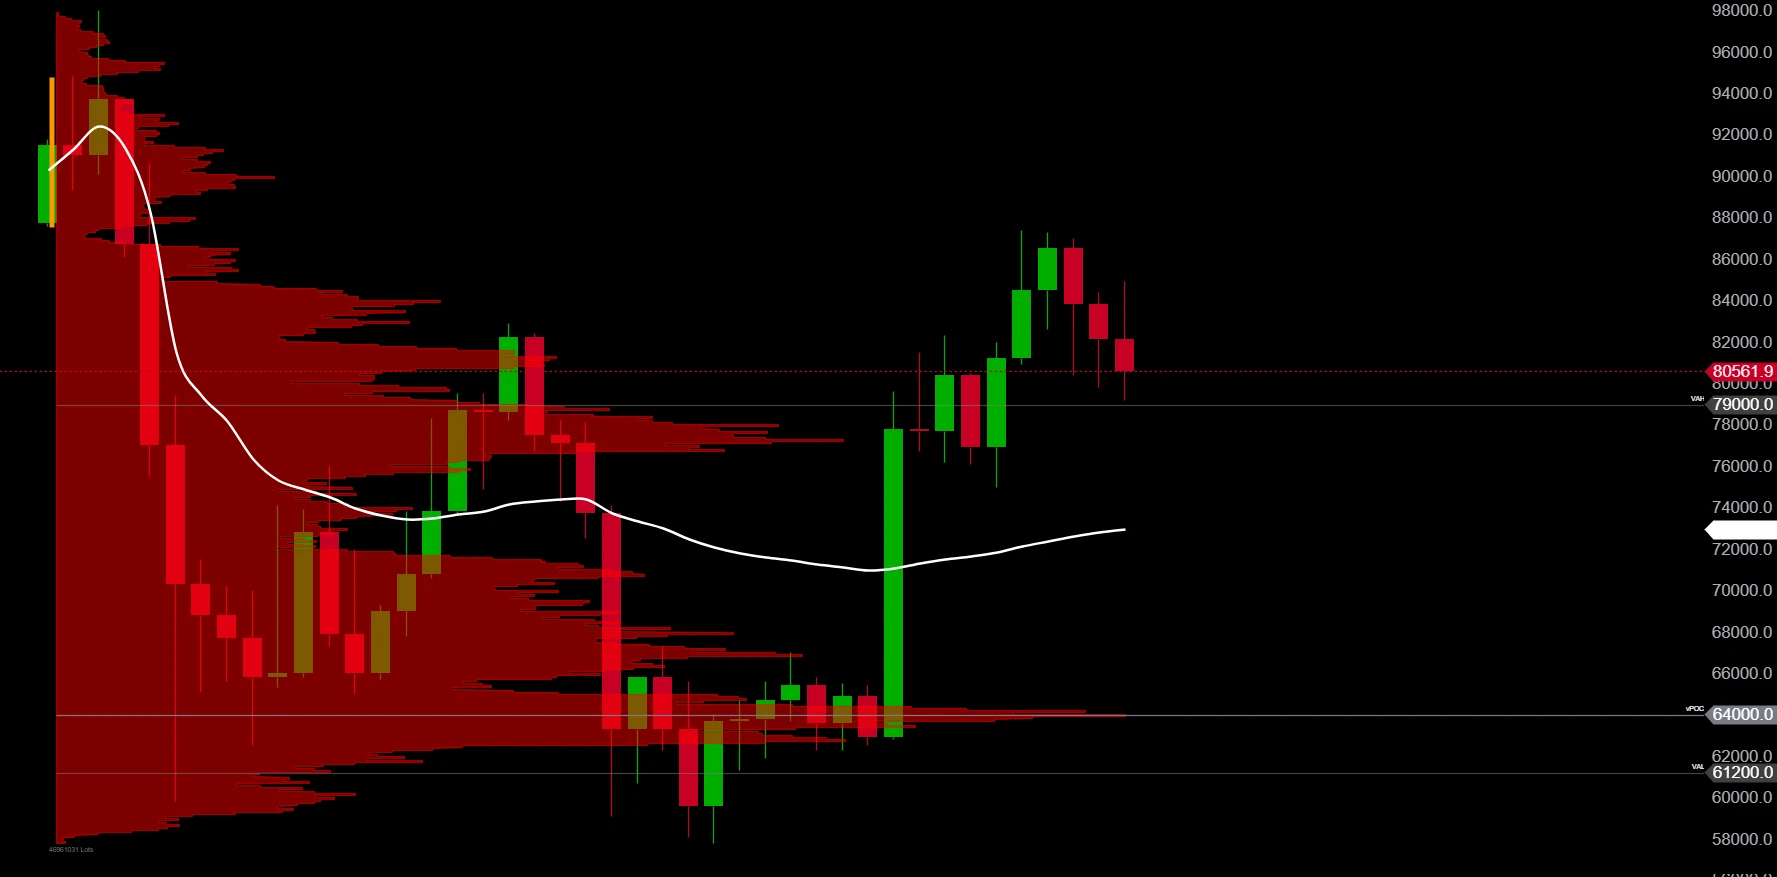
The charts now describe a market at a decision point. The $79,800 to $80,500 zone has become the immediate support band. If Bitcoin holds above this level, the next major test is the $82,000 to $82,900 resistance zone. A decisive break above $82,300 would open the path toward the $83,000 to $85,000 range. On the downside, a loss of $80,000 would shift the focus to the $74,000 to $75,000 support area.
The daily chart shows a market that has recovered from a low near $74,965 but has not yet confirmed a new uptrend. The price is trading above its short-term moving averages, but the medium-term structure remains in transition. The volatility has compressed in recent sessions, a sign that the market is waiting for a catalyst to determine its next directional move.
What Comes Next
The next 24 to 48 hours will be critical. A sustained hold above $80,000 would confirm the recovery and set up a test of the $82,000 resistance. A failure to hold would suggest that the rally was a short-covering bounce rather than a genuine shift in trend.
For those watching the market, the signals to track are the ETF flow data, the funding rates, and the behavior of the $80,000 support level. The recovery is real, but it is still fragile. The market has reclaimed a key psychological level. The question now is whether it can build on it.
DYOR 🔎 NFA ✔️
##Gate广场中秋团圆局 #GateSquareMidAutumnReunion #ShareWeekly
repost-content-media
BTC+6.16%
As the tide rises and falls, human nature is revealed; through every gain and loss, one's discipline is tested.
After years of ups and downs in the market, I deeply understand the hardships ordinary traders face.
When first entering the market, with no one to guide them, they struggle forward alone. Staying up late watching the market, unable to sleep over trapped positions; rushing to exit at the slightest profit, while stubbornly holding on through deep losses. Emotions pull them back and forth until they are mentally exhausted. They fail to keep their profits, and are consumed by the market
post-image
BTC-0.34%
ETH-0.35%
#BTC重回80K After Bitcoin, cryptocurrencies with even greater explosive potential will emerge—the era of Chinese cryptocurrencies rising has arrived.
BTC-0.34%
Everyone calling $CL /USDT a range is missing the 1h setup forming right now.

$CL /USDT - SHORT

Trade Plan:
Entry: 97.08 – 97.28
SL: 98.16
TP1: 96.45
TP2: 95.96
TP3: 95.23

Why this setup?
Why now? The 4h structure shows a range, but the 1h RSI at 44.19 signals bearish momentum building inside that range. The 1h ATR of 0.406468 confirms enough volatility to push from the entry zone of 97.18 down toward TP1 at 96.45 and then TP2 at 95.96. The daily trend being range-bound means this short has room to run before mean reversion hits. The invalidation level at 97.01 is the line in the sand th
post-image
CL+2.20%
Unlimited hotpot for 4 people
0.42 SOL - did we get robbed?
post-image
SOL-1.01%
Watching the charts until I got fed up—turning them off actually made things clearer. Once my eyes stopped staring at them, my mind stopped panicking too. Panic comes from having no plan; losses come from overthinking.

During the intraday bottoming process, I watched $ONE . It held after the pullback, buying pressure strengthened, and I judged it wasn’t a bull trap, so I said it could be accumulated in batches.

It then pushed all the way to 0.003453. Calculated from 0.000713, that’s +7561.19%. It really feels great. The price action was truly sluggish at first, but once it broke out, it was
post-image
ONE-7.87%
ZEC-0.30%
SNDK-0.65%
Everyone calling $ONE /USDT a buy is ignoring the daily range trap

$ONE /USDT - SHORT

Trade Plan:
Entry: 0.003471 – 0.003725
SL: 0.004815
TP1: 0.002685
TP2: 0.002077
TP3: 0.001164

Why this setup?
Why now? The 4h setup signals a SHORT bias at 55% confidence, and the 1h price is pinned near 0.003597 inside a tight range. The 15m RSI sits at 47.24, showing neither overbought nor oversold conditions, which favors a continuation of the range rather than a breakout. The 1h ATR of 0.000507 confirms compressed volatility, setting up a potential explosive move once the range finally resolves. The
ONE-7.87%
Nobody is talking about this quiet short setup on $XAU /USDT right now.

$XAU /USDT - SHORT

Trade Plan:
Entry: 4377.52 – 4378.92
SL: 4384.96
TP1: 4373.17
TP2: 4369.80
TP3: 4364.74

Why this setup?
Why now? The daily trend is range, which often precedes a decisive break, and the 1h price is sitting at 4378.22, the exact entry reference for a short. The 15m RSI at 56.71 shows room to drop without being overbought, while the 1h ATR of 2.807966 means the next candle can easily cover the distance to TP1 at 4373.17. TP2 at 4369.80 offers a bigger reward, but the invalidation level of 4370.91 is
XAU-0.18%
#SUI is back above $0.80, and this is the part of the chart I am paying attention to.
The move is not just a one-day bounce. SUI went from roughly $0.686 on September 15 to above $0.81 within a few sessions, and the latest market data has it around $0.83. That puts the short-term structure firmly back in recovery mode.
The bigger question now is whether $0.80 becomes support or whether this move turns into another rejection.
The current market data shows SUI around $0.83, with roughly 8.5% 24-hour gains and more than 14% seven-day gains. Spot volume is around $226M, while futures volume is clo
post-image
SUI+3.28%
BTC-0.34%
AURORA-0.38%
3 USDT on Your First Trade, Up to 8,000 USDT to Win https://www.gate.com/campaigns/event/6323?ref=VLARBF1YAG&ref_type=132
post-image
CryptoChampion
3 USDT on Your First Trade, Up to 8,000 USDT to Win https://www.gate.com/campaigns/event/6323?ref=VLARBF1YAG&ref_type=132
repost-content-media
Market updates
live-cover
LIVE1,078
Big Pump VERY SOON
$BTC
$80,000 - $100,000 is loading NOW
🚀🚀💲💲🤑🤑
post-image
BTC-0.34%
PATIENCE IS ALSO A POSITION
The market rewards movement, but not every movement deserves a trade.
The crowd wants instant action.
The wolf understands the value of waiting.
Meme markets create constant pressure to participate.
One token is trending. Another suddenly doubles in volume. A community starts calling for the next breakout.
The temptation is obvious: if you don't enter now, you might miss everything.
But this is exactly where discipline becomes valuable.
I don't consider waiting an inactive strategy.
When the market becomes overheated, I watch how volume, liquidity and price structur
post-image
DOGE-3.27%
PEPE-6.57%
BONK-2.48%
TRUMP-2.43%
#GateTops24HNetInflowsAmongExchanges
Gate is quietly showing the kind of strength I actually pay attention to.
The latest DefiLlama CEX data puts Gate at around $95.8M in net inflows over the past 24 hours, currently the strongest 24-hour inflow among the major centralized exchanges tracked on the dashboard.
The interesting part is that the story does not stop at the 24-hour number.
Gate is also showing approximately $41M in 7-day net inflows and $287.8M over the past month. That makes the current move more meaningful to me than a single large deposit day. One day can be noise. A positive flo
post-image
GT+0.48%
ARC+12.68%
BTC-0.34%
ETH-0.35%
USDC0.00%
Load More

Join 40 M users in our growing community

⚡️ Join 40 M users in the crypto craze discussion

💬 Engage with your favorite top creators

👍 See what interests you

Trending Topics

MSTRTopsNasdaq100

74.26k Views3.03k Discussing

Strategy (MSTR) has gained about 48% over the past month, making it the best-performing stock in the Nasdaq 100, while Bitcoin rose roughly 12% over the same period. The company holds 845,050 BTC with a cumulative cost basis of about $63.73B. MSTR is not a pure Bitcoin proxy — its price swings can be more extreme. Can this rally last?

Gate Tops 24H Net Inflows Among Exchanges

26.51k Views3.69k Discussing

BTCRetakes80K

57.37k Views60.68k Discussing

View More