
Square
Following
Hot
News
Notifications
Profile
Share your thoughts
placeholder
Article
#BTCBackAbove80K #ShareWeekly

BITCOIN FALLS BACK BELOW $80,000: IS THIS A HEALTHY RETEST OR THE START OF ANOTHER CORRECTION?

Bitcoin's recent recovery above $80,000 has lost momentum, bringing the market back to an important technical decision point. After rebounding from its recent low, BTC briefly climbed toward $80,949, raising hopes that buyers were preparing for another bullish move. However, the latest price action suggests that sellers are still defending higher levels, and the market has not yet established a convincing recovery.

Current Bitcoin Market Overview

As of the lates
BTC-0.67%
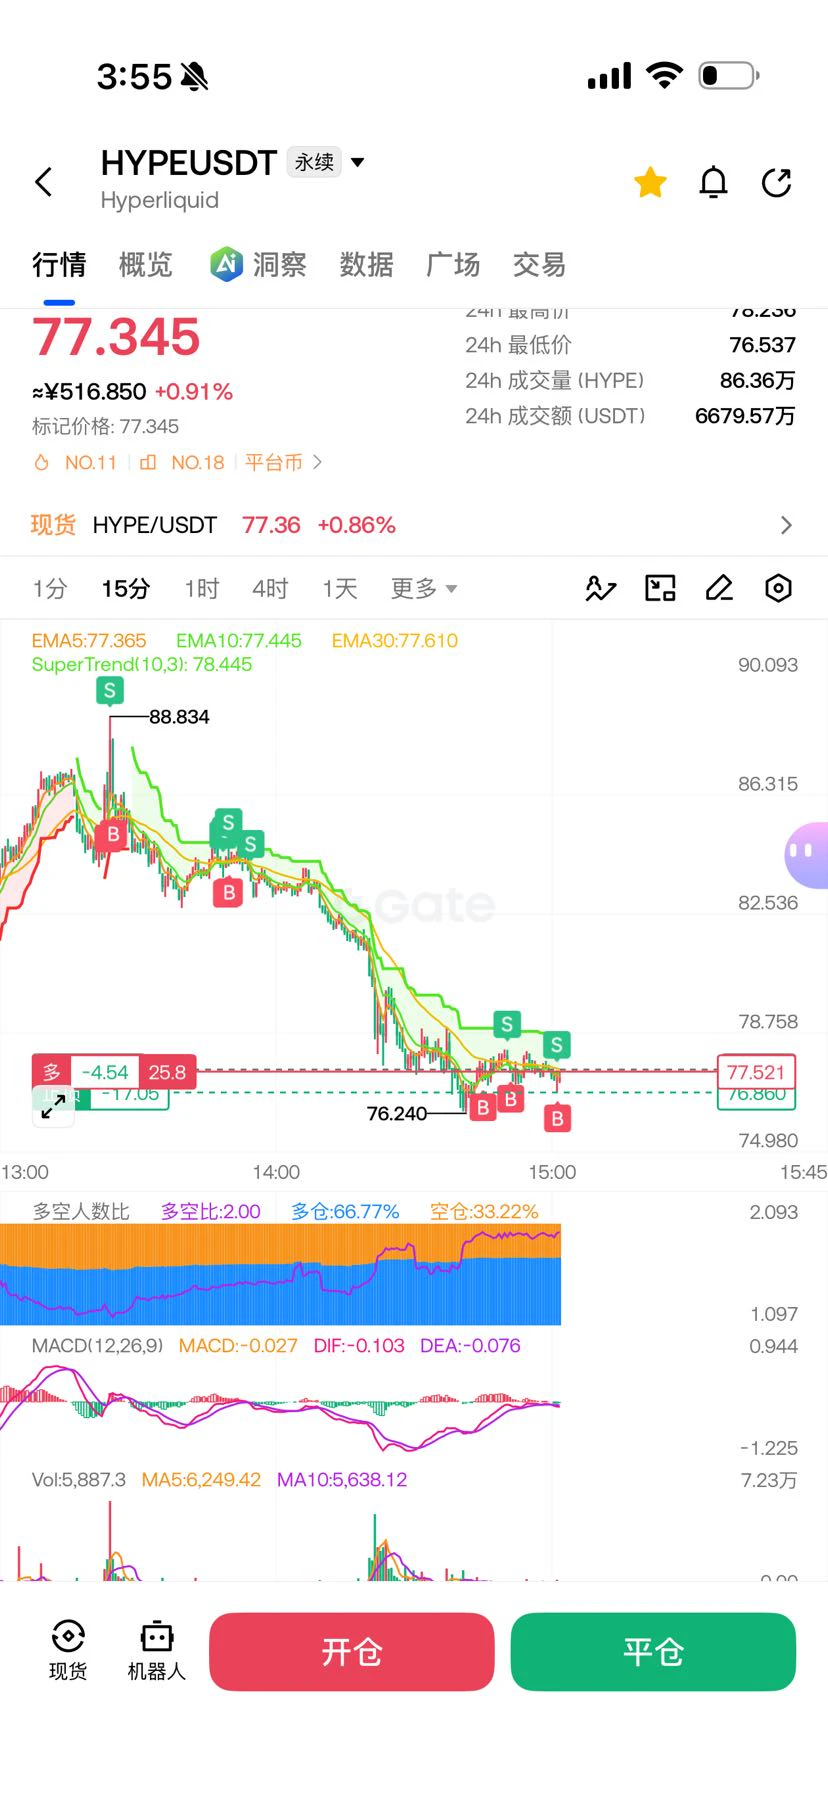
#$HYPER
This is a very attractive spot, so I decided to take a position

1-hour MACD crossover, the previous starting point. Maybe we can take some here for a small bounce

Target profit: 30%
post-image
HYPER+3.29%
Trenches
BTC
B
bade
b
BTC
C5xp...pump
Market Cap
$.
Change
.
24h Vol
$.
Holders
.
ZIG
Z
bade
b
ZIG
0x8c...1145
Market Cap
$.
Change
.
24h Vol
$.
Holders
.
GM
G
bade
b
GM
0x13...7777
Market Cap
$.
Change
.
24h Vol
$.
Holders
.
STONK
S
bade
b
STONK
6GmA...UNgx
Market Cap
$.
Change
.
24h Vol
$.
Holders
.
DESSA
D
bade
b
DESSA
npz2...pump
Market Cap
$.
Change
.
24h Vol
$.
Holders
.
Why Can a Trading Strategy With a High Win Rate Still Lose Money?

In cryptocurrency trading, many people pay close attention to their win rate. Winning eight out of ten consecutive trades looks quite impressive. But if the account is still losing money overall, the problem may not be the win rate, but the amounts won and lost on each trade.

Suppose a trader makes 10 trades, with 8 winning trades that each earn 10 USDT and 2 losing trades that each lose 50 USDT.

The 8 wins bring in 80 USDT, while the 2 losses result in a loss of 100 USDT. Even without considering fees and funding rates, the
post-image
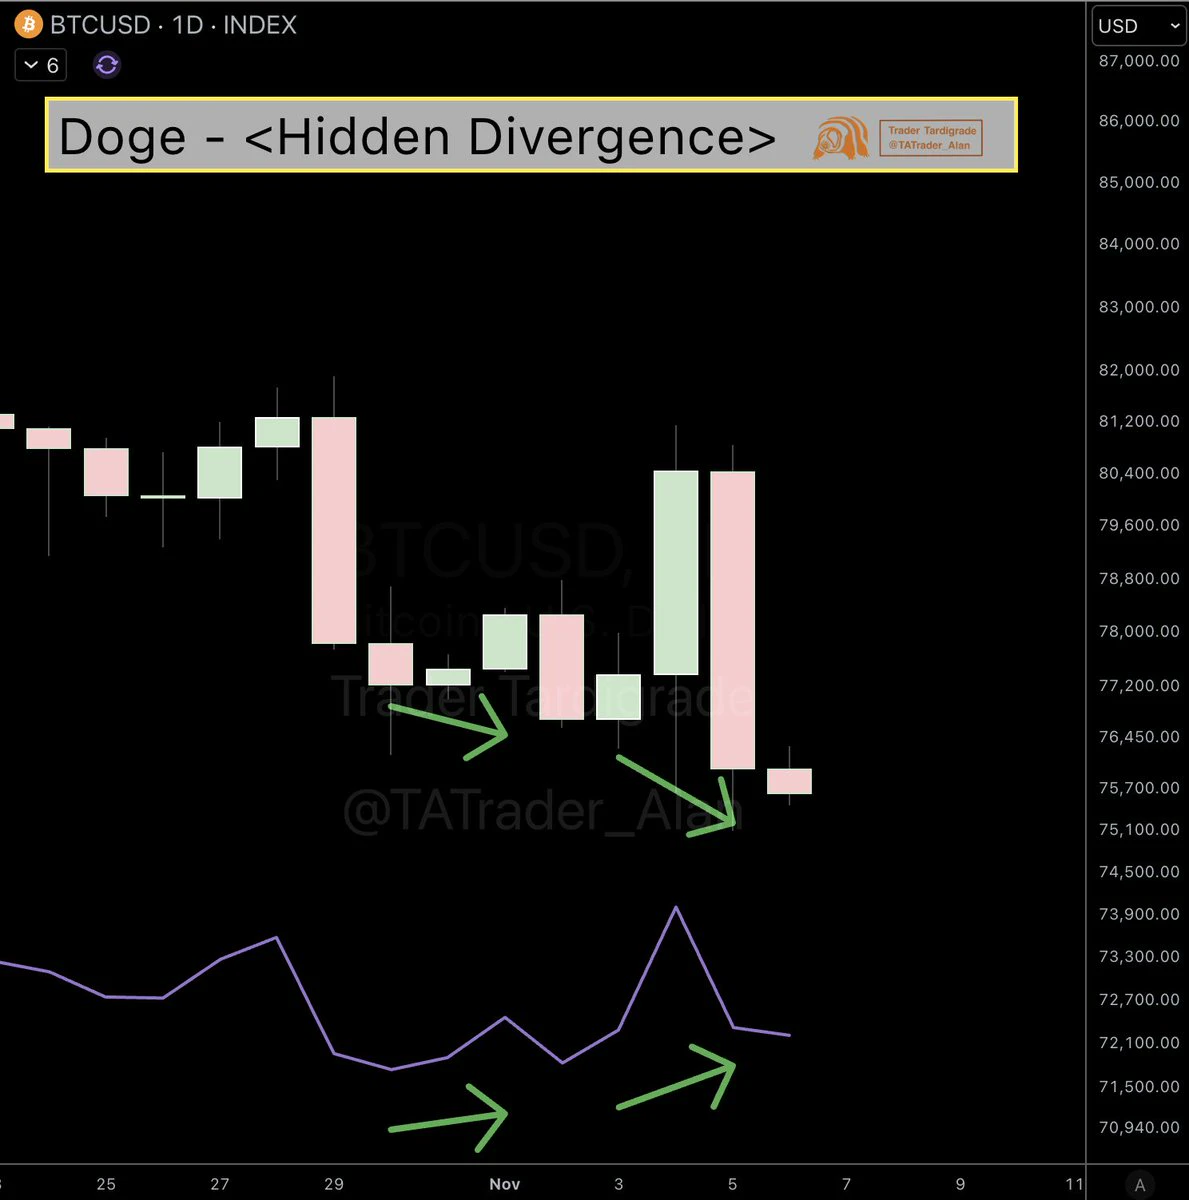
$DOGE just printed a 2nd hidden BULLISH divergence in a row.
Price was seeking a new low, while RSI rejected to behave the same, and the lows were trending ☝️.
Bottom could be close. Trending setup. DYOR 💥
post-image
DOGE-0.22%
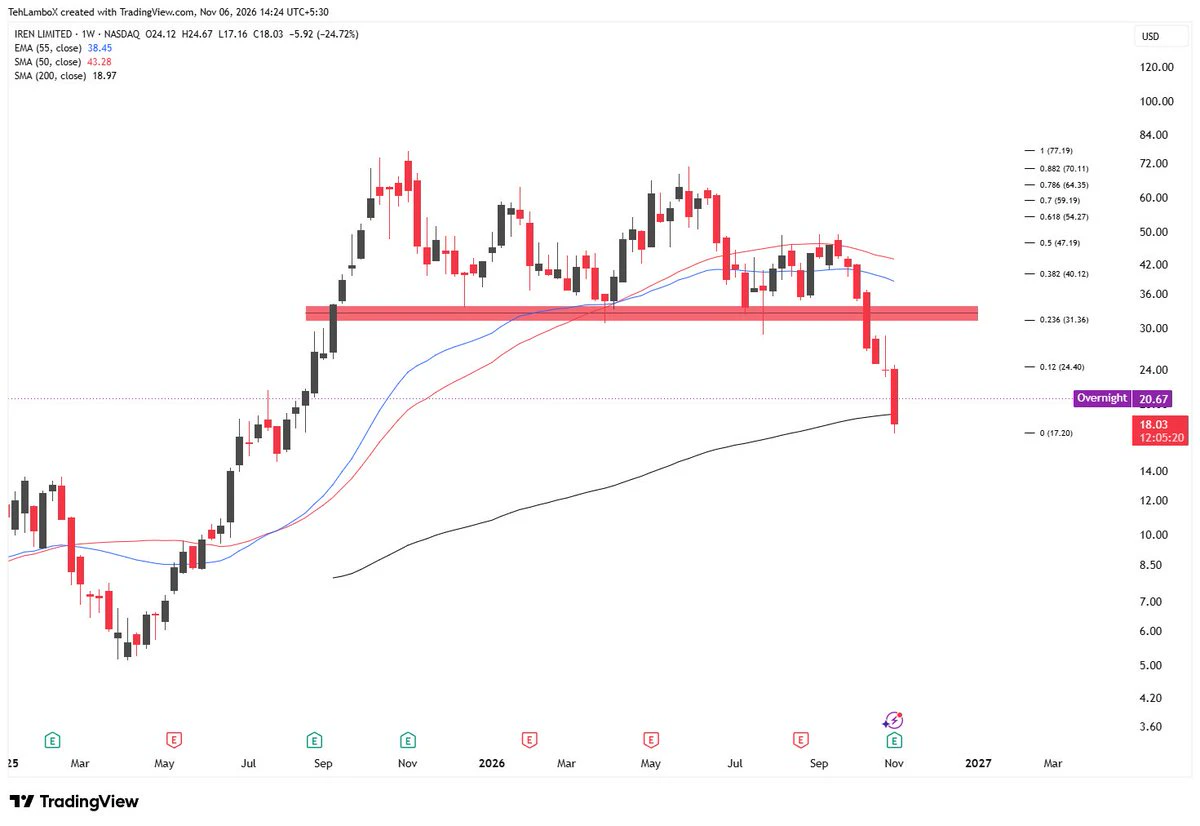
$IREN fell once that support broke on W1 and has since tested the SMA200.
Now it has bounced post the ER and can continue the bounce, although the results are not Double BEAT, they are first positive in past 4 quarters.
24.40 and 31.30 are the levels I am looking at..
post-image
IREN-17.04%
After yesterday’s plunge, many people are probably stuck in losing positions, unsure what to do!
They can’t bear to cut their losses, but holding on means continued pressure; even the slightest market fluctuation makes them panic.
Getting out of a losing position has never been about waiting blindly for a reversal. The key is to assess the current market and make an appropriate plan.
Stay calm and find the right rhythm, and you may have a chance to break free from this predicament. #美股史诗级抛售 $BTC ‌
post-image
BTC-0.65%
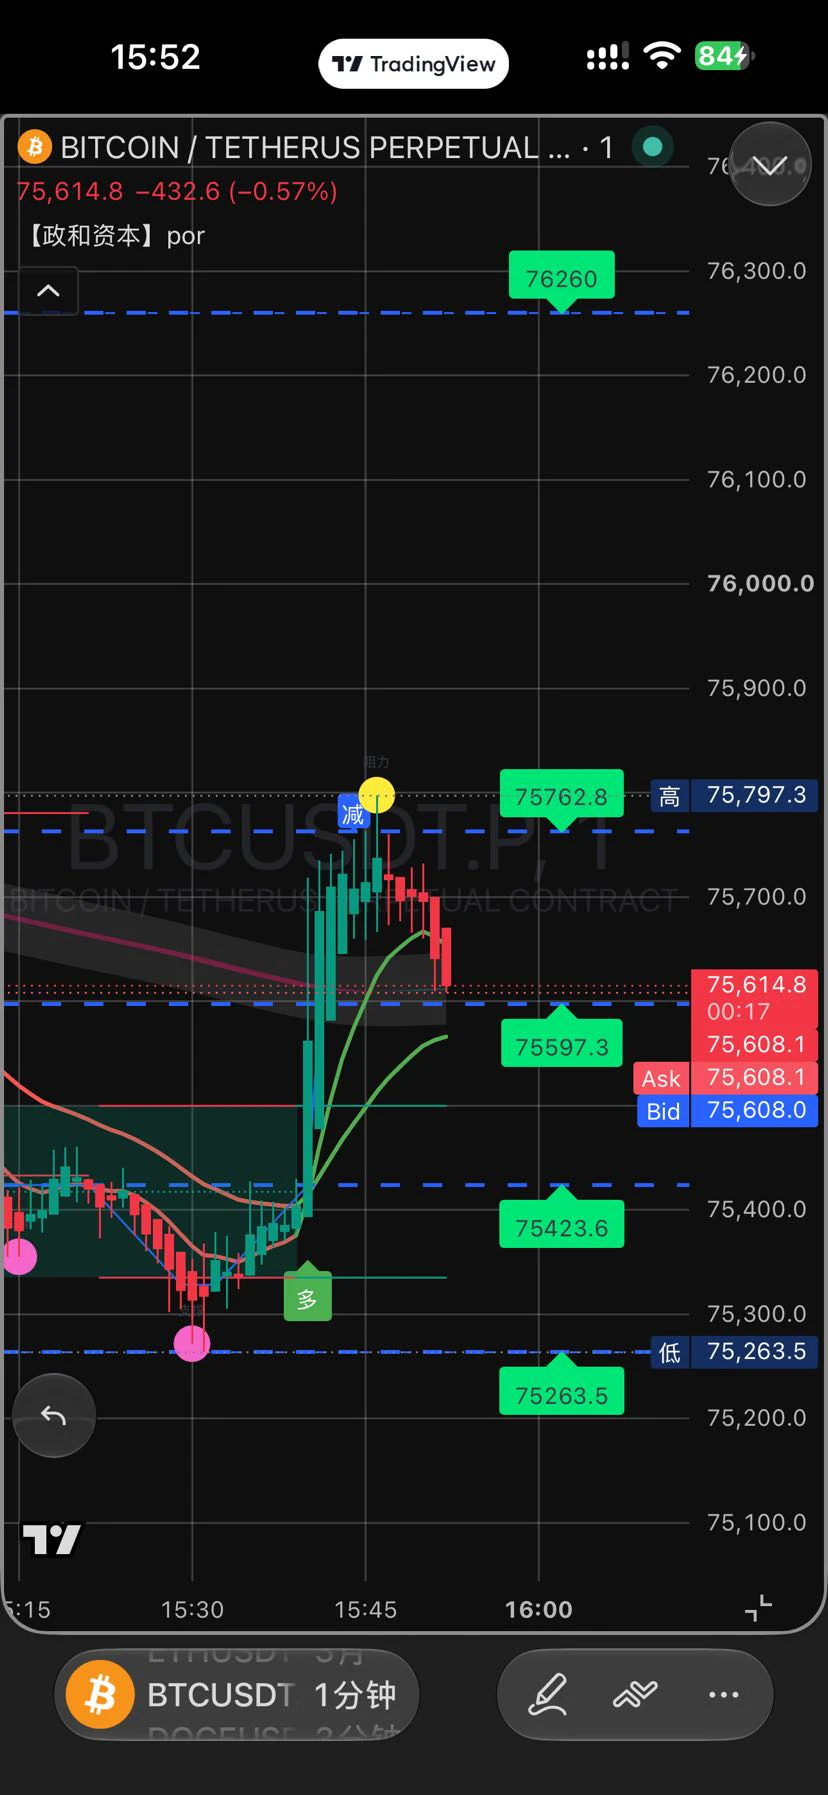
November 6, 2026 (Friday) BTC Futures Strategy for Today (based on the current range of approximately $75,300–$75,700)
Core view (bearish bias, cautious on rebounds)
BTC quickly fell from around $80,500 to around $75,500, breaking below recent support, with weak short-term momentum. Today, prioritize watching for a rebound to stall as a short opportunity, or consider going long only after a retest of lower support. Keep positions light.
Specific Strategies
1. Short the rebound (primary strategy)
• Watch zone: $76,500–$77,500 (or near $78,000)
• Entry reference: If the price rebounds to aroun
post-image
BTC-0.65%
A good product also needs to be where users can find it
After someone buys an RWA, what else can they do with it? If they still have to search for protocols, find markets, and check whether the asset is supported, many may stop at simply holding it.
The Theorem integration mentioned by @GearboxProtocol addresses this specific problem: when users view the mGLOBAL asset page, they can find an entry point to Gearbox's leveraged markets. This integration is now live on Ethereum.
I think its significance lies in placing the strategy entry point where users research the asset. After reviewing the as
post-image
RWA-0.39%
How can we tell when market conditions have changed? Which signals are worth watching, and which are just short-term noise?

In the previous article, we discussed a question: Why might a trading strategy that once worked gradually lose its edge?

One important reason is that market conditions have changed.

But the real challenge is this: Markets fluctuate every day, so how do we know whether this is normal volatility or a genuine change in market conditions?

If we react too slowly, we may keep using a strategy that no longer suits current market conditions.

If we react too quickly, we may c
post-image
USDC markets predictions
live-cover
LIVE2,037
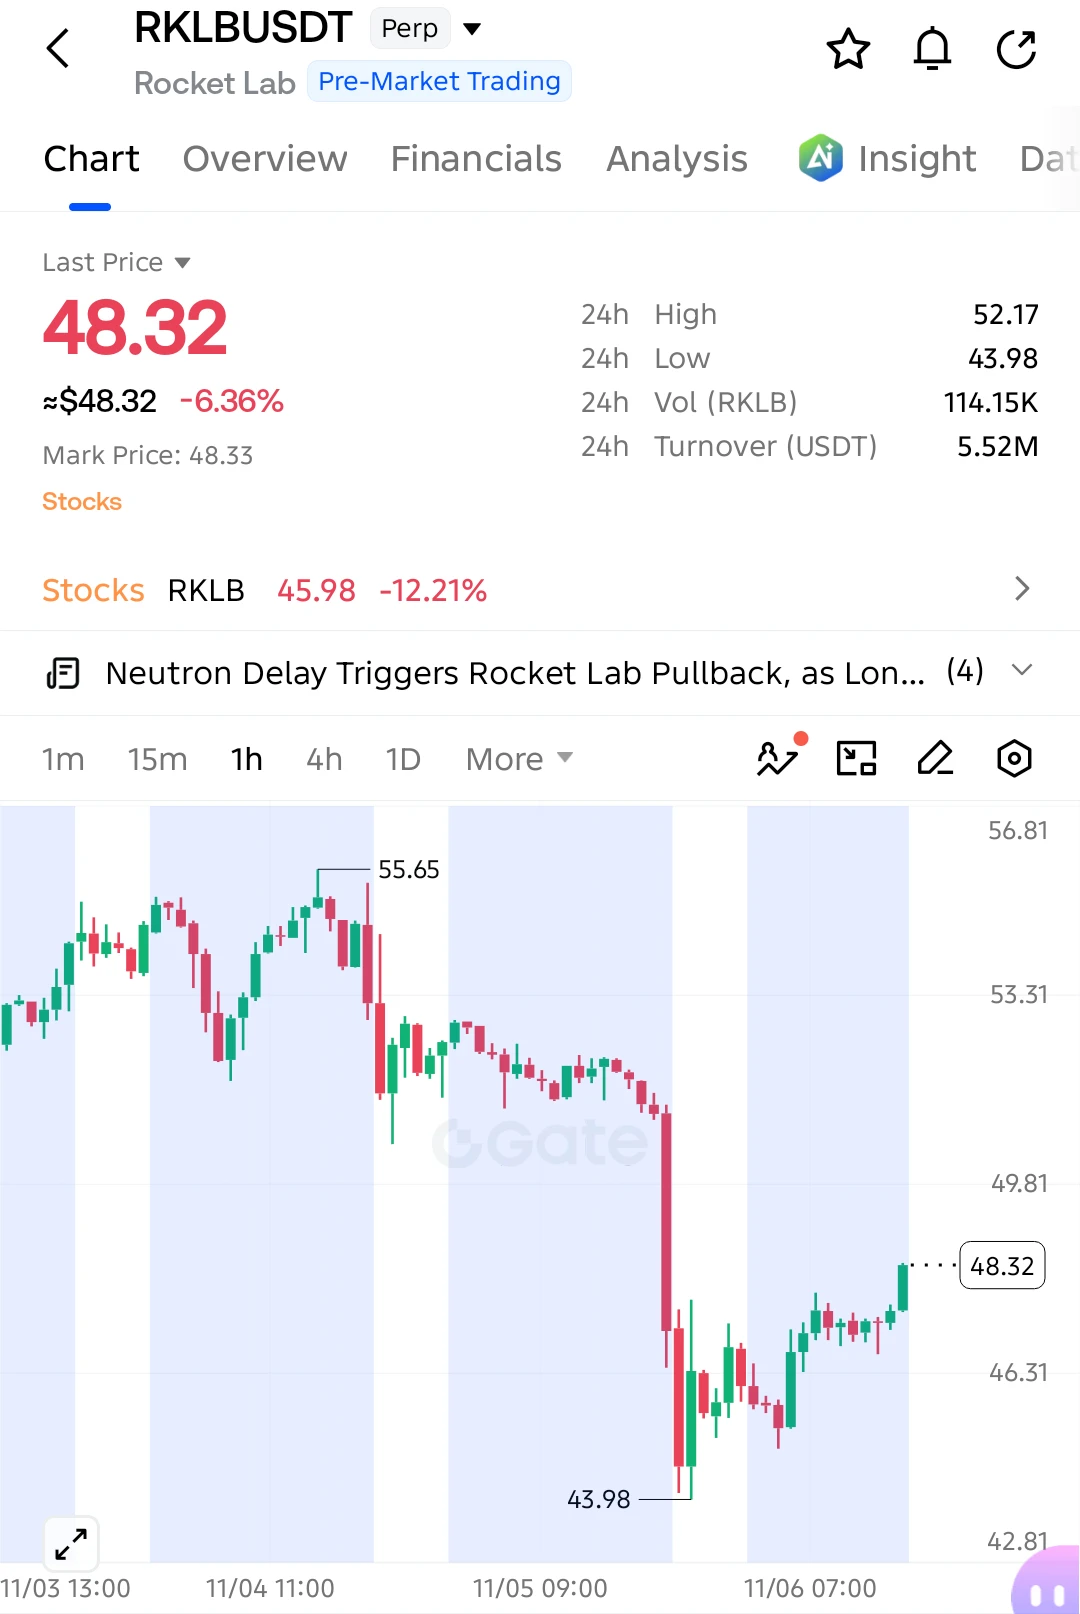
$RKLB LONG SETUP — BUYERS FIGHTING BACK!

$RKLB is recovering from 43.98, with buyers forming higher lows and pushing price toward the next resistance.

Entry: 48.32
SL: 46.70

TP1: 49.80
TP2: 51.20
TP3: 52.17
Final Target: 53.30

After a sharp sell-off, buyers are showing renewed strength. Price is gradually recovering, and a move above 49.80 could open the door toward 51.20–52.17. This remains a recovery trade rather than a confirmed trend reversal.

Invalidation: A sustained break below 46.70 weakens the bullish setup.
post-image
RKLB-0.46%
  • 4
  • 1
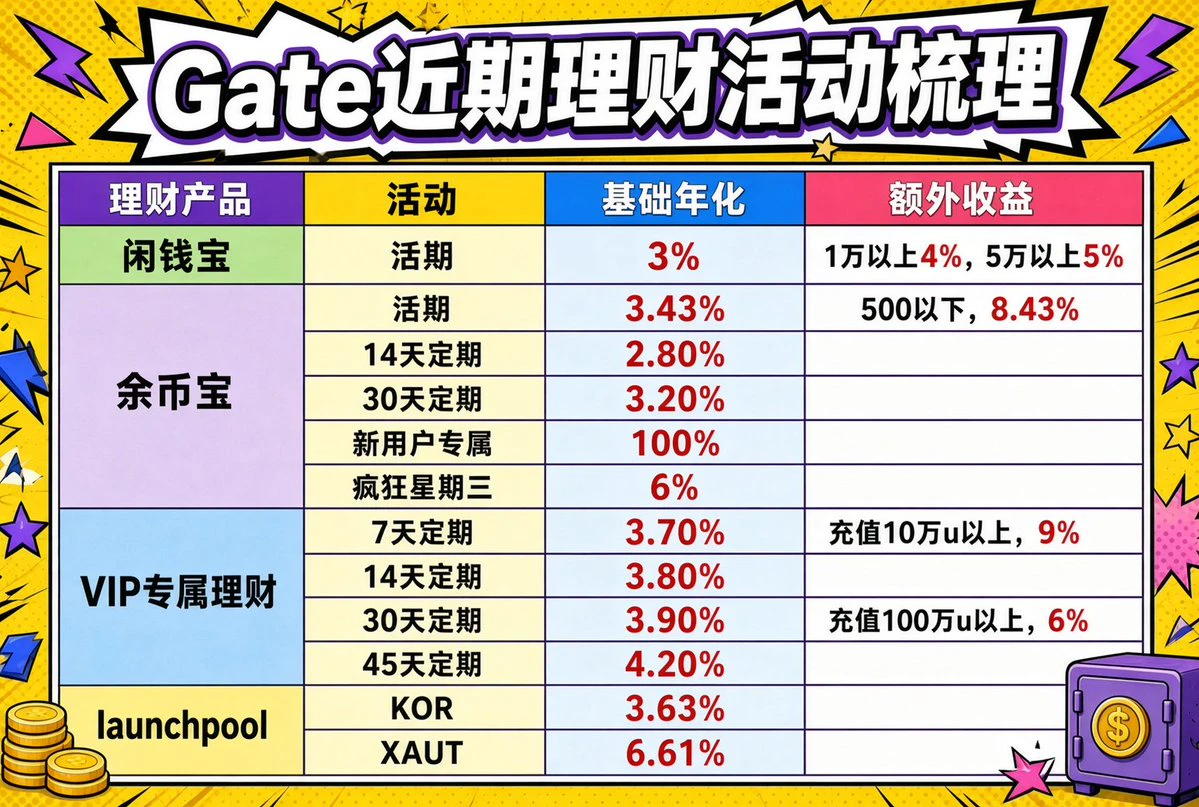
There have been lots of yield activities on Gate recently, including Coin Earn, Idle Treasure, VIP fixed-term products, Launchpool, and more. Here’s a quick overview. @Gate_zh
—————————————————————
1⃣Idle Treasure APR range: 3%~5%
Base APR is 3%; deposit 10k u for 4% APR (cap: 50k u); deposit 50k u for 5% APR (cap: 50k u)
2⃣Coin Earn APR range: 3.43%~8.43%
Base APR is 3.43%; 8.43% for balances of 500 u or less (higher VIP levels come with higher limits)
14-day fixed term at 2.8%, 30-day fixed term at 3.20%
3-day offer exclusive to new users at 100%; Crazy Wednesday: 6% for one day
3⃣VIP-excl
post-image
DNA-3.76%
XAUT+0.30%
ETH-1.26%
BTC-0.67%
They said new lows were coming, but is the bottom in? Not necessarily. 2x December may provide a signal$BTC $ETH ‌
post-image
BTC-0.65%
ETH-1.23%
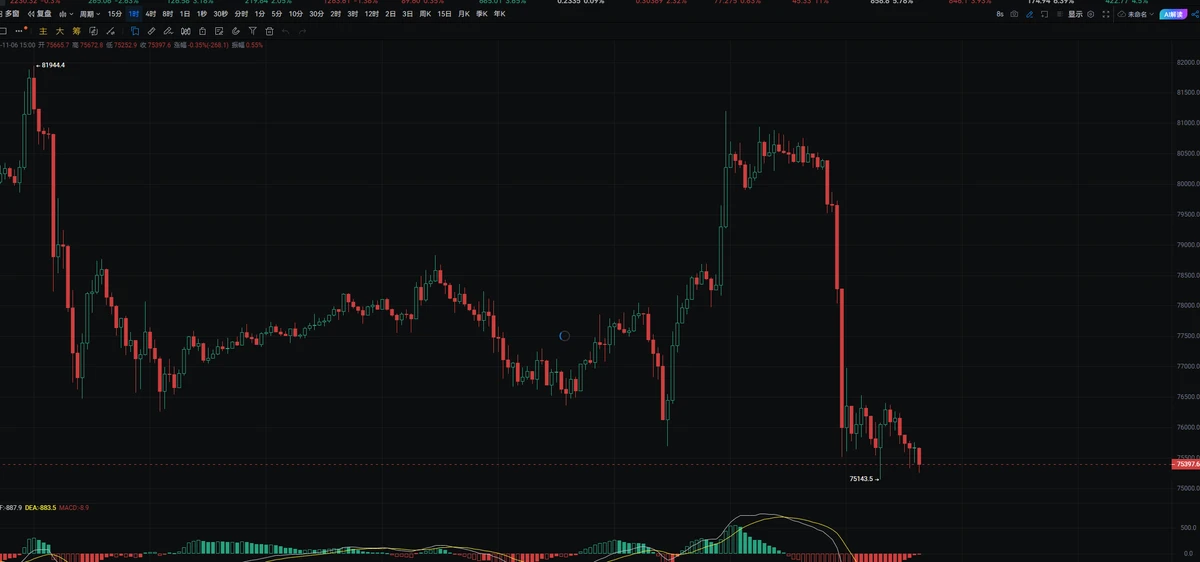
#BTC The current price is 75720. After a sharp pullback, the market is now repeatedly testing key support. The rally above 80400 was followed by a retreat, and the bulls’ attempt to rebound quickly lost momentum. After concentrated selling pressure was released, market sentiment clearly weakened, and the short-term market has entered a weak recovery phase. The first resistance above is around 78000, an area of heavy trading activity in the past and the dividing line between bulls and bears in this downturn. To regain the initiative, the price must hold above this level with a corresponding inc
post-image
BTC-0.67%
  • 5
  • 2
ALL TIME HIGH
SMASHED
ONWARDS AND UPWARDS
post-image
Follow top streamers and grow together!
  • 2
Same pattern
Slow grind
Flash dump
Slow grind up in the coming year
8800-8900
Is the next macro target.. The 2008 fib
#bitcoin
BTC-0.67%
Exchanges forced $910.7M of leveraged crypto bets shut on Nov 5, and those betting on higher prices carried 89.4% of it, $BTC and $ETH most of all. The heaviest day in our current window was Oct 8 at $946.1M.
BTC-0.65%
ETH-1.23%
What Is a Stop-Loss Order? Why Is Setting a Stop-Loss Important, Yet No Guarantee You’ll Exit at the Expected Price Every Time?

In cryptocurrency trading, no one can always accurately predict price movements. The purpose of a stop-loss is not to ensure that a trade never loses money, but to limit risk in advance when the market moves against expectations and prevent losses on a single trade from continuing to grow. However, a stop-loss is not absolute protection; in extreme market conditions, execution slippage can still occur.

First, what is a stop-loss order?

A stop-loss order is a tradin
post-image
U.S. Stocks Plunge After the Midterm Elections, Led by AI Stocks, Dragging BTC Down Too! When Will T
live-cover
LIVE4,876
Load More

Join 40 M users in our growing community

⚡️ Join 40 M users in the crypto craze discussion

💬 Engage with your favorite top creators

👍 See what interests you

Trending Topics

USStocksFaceHistoricSelloff

4.79k Views3.65k Discussing

U.S. stocks suffered a sharp selloff on Thursday, with the Nasdaq closing down more than 5% and the Philadelphia Semiconductor Index falling over 12%. AI and chip stocks including $NVDA and $AMD were hit especially hard. Markets are reassessing AI valuations, data-center spending and future returns. Is this just short-term deleveraging, or the start of a deeper correction in the AI trade? Which sectors are you watching next?

GateLaunchesPoSECProofOfSecurity

14.95k Views591 Discussing

USNonfarmPayrolls

13.18k Views4.05k Discussing

View More