Square
Following
Hot
News
Notifications
Profile
Share your thoughts
placeholder
Article
BTC market less and less like safe haven?
live-cover
LIVE2,221
BTC MARKET UPDATES.
live-cover
LIVE2,915
Trenches
mihao
m
bade
b
mihao
4Cxj...pump
Market Cap
$.
Change
.
24h Vol
$.
Holders
.
AGT
A
bade
b
AGT
0x5d...e274
Market Cap
$.
Change
.
24h Vol
$.
Holders
.
FOOD
F
bade
b
FOOD
FTu5...pump
Market Cap
$.
Change
.
24h Vol
$.
Holders
.
IDOL
I
bade
b
IDOL
0x3b...ab07
Market Cap
$.
Change
.
24h Vol
$.
Holders
.
AI
A
bade
b
AI
2T56...pump
Market Cap
$.
Change
.
24h Vol
$.
Holders
.
Why can large trades still cause slippage when liquidity is sufficient?

Many traders believe that choosing a high-volume, liquid cryptocurrency can help them avoid slippage. In reality, sufficient liquidity can reduce some execution risks, but it does not mean orders of any size will be filled at the expected price.

The key point is that good overall market liquidity does not mean there will be enough executable quantity at the exact moment and price range when you place your order.

First, market liquidity is not the same as liquidity at a single price.

A trading pair may have high daily t
post-image
Why Is the Liquidation Price Usually Closer to the Entry Price at Higher Leverage?

In crypto futures trading, leverage allows traders to open a larger notional position with less margin, but it also amplifies the impact of price fluctuations on account equity.

Many people know that higher leverage carries greater risk, but may not understand why: why can even a small price move put a highly leveraged position at risk of liquidation?

First, leverage changes the relationship between margin and position size.

Suppose you use 100 USDT as margin, in a simplified scenario that excludes fees and
post-image
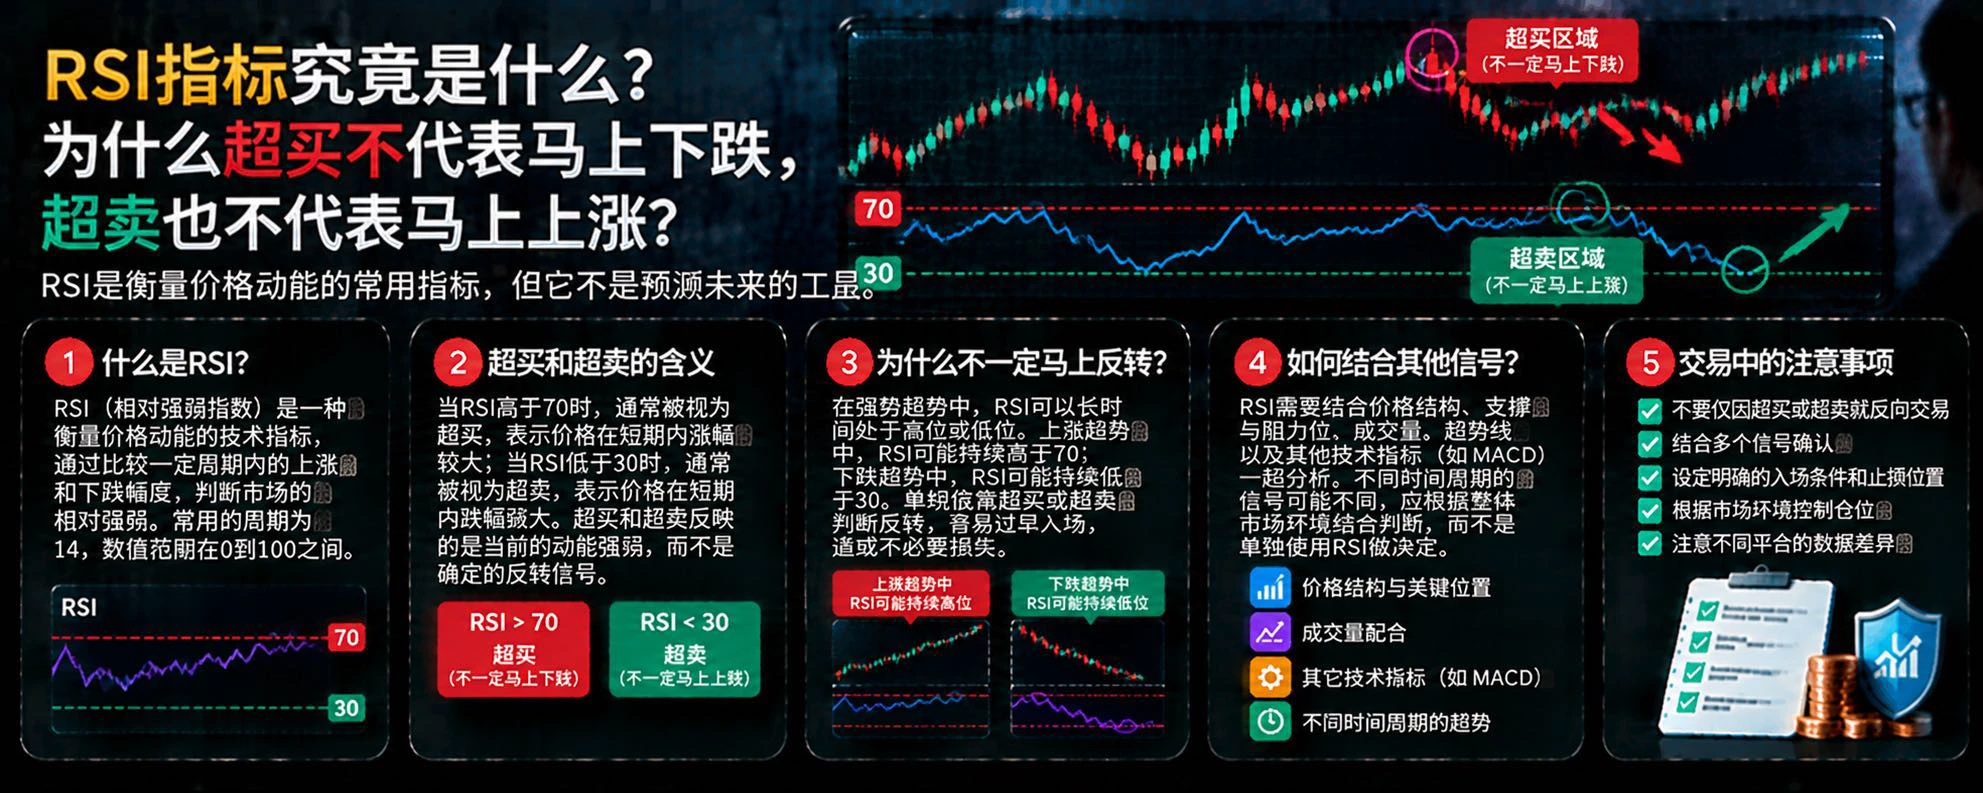
In cryptocurrency trading, many people watch BTC candlestick charts every day but don't know how to tell whether the market is currently in an uptrend or a downtrend. In fact, there is a very common technical indicator that can help us see the market's direction more clearly: the Moving Average, or MA.

So, what do MA20, MA50, and MA200 represent?

First, the MA20 short-term moving average. It reflects recent price movements and is relatively sensitive to short-term market conditions. When BTC trades consistently above the MA20 and the average slopes upward, it usually indicates relative short
post-image
BTC-0.67%
$EURUSD ‌
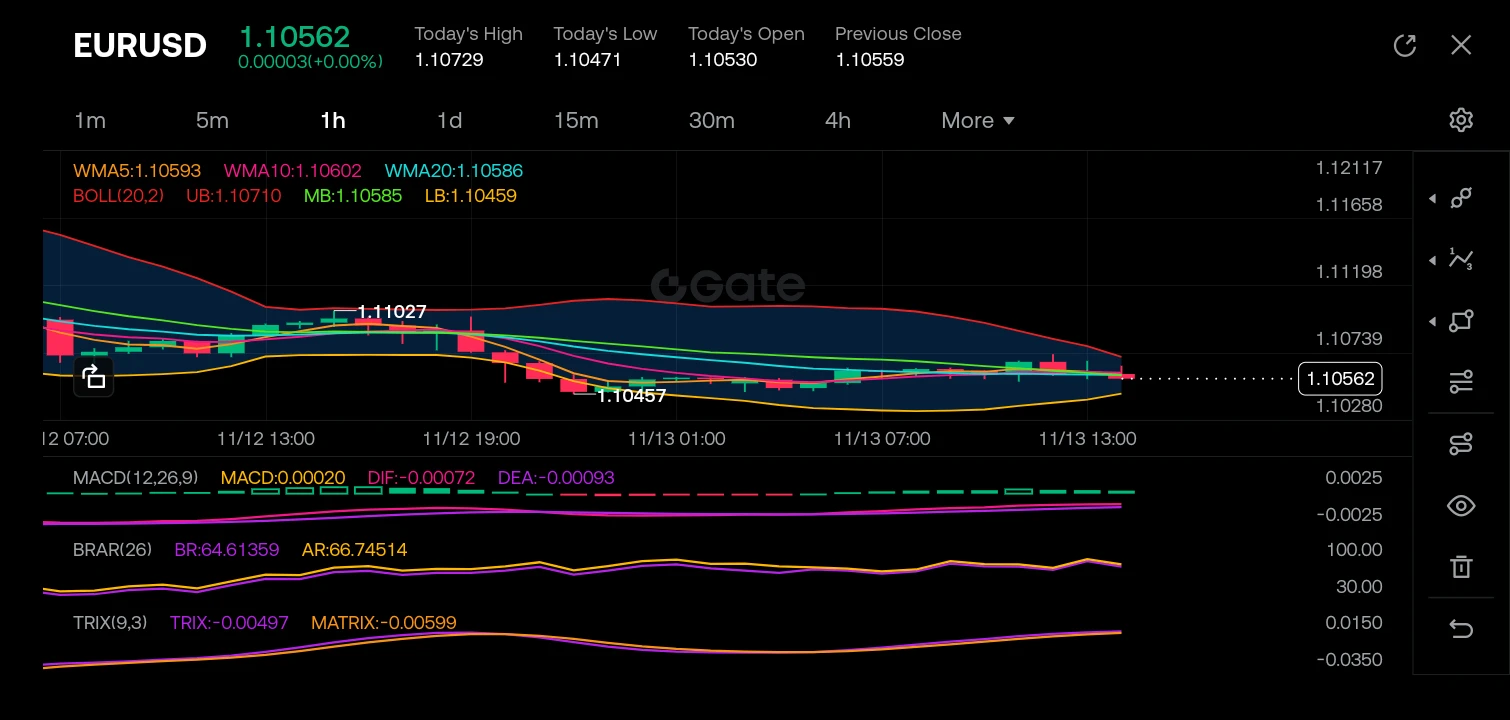
Looking at the 1-hour timeframe, the market structure has recently shifted from a bearish impulse to a consolidation phase. After a sharp drop from the highs near 1.11027 down to the 1.10457 liquidity grab, price has stopped making lower lows and is currently forming a base. The structure is attempting to transition into a bullish correction or reversal as price pushes back above the short-term moving averages (WMA5 and WMA10) and tests the middle Bollinger Band.

The K-line action shows a series of small-bodied candles with mixed colors, indicating indecision and a compression in v
post-image
EURUSD+0.00%
  • 5
How smoothly fiat channels work often depends on a platform’s compliance credentials. That’s the first thing banks and payment institutions look at when choosing partners.

So when I saw that Gate had obtained MiCA and Payment Institution (PI) licenses, received FSA approval to operate in Japan, completed AUSTRAC registration and launched its Australian platform, and obtained a VARA license to officially establish itself in Dubai, my first thought was: customers in these regions now have an additional layer of protection when moving funds in and out.

On top of that, Gate Money now supports c
post-image
$AKE This market maker has really left me at a loss for words. I went in with $10,000 at 5x leverage, and they somehow dragged me into a $20,000 loss. With the daily chart looking like this, who would dare short? At this point, is there any way for the bears to survive? I give up. I can't hold on anymore—I’m cutting my losses and getting out.
$BARD I told you this morning: hold steady and don’t let go. There’s definitely going to be a 200-point explosive rally this week that buries all the shorts. With a $1,000 position at 10x leverage, I’ve already raked in $1,000 just from funding fees, an
post-image
AKE+6.07%
BARD-1.24%
ETH-1.26%
  • 2
$ZEC Strongly bullish: ZEC is nearing a key support zone after a sharp pullback. A bullish rebound could drive the price back toward higher resistance levels—if buyers regain control of the market, substantial profits may lie ahead. Long $ZECEntry: 930–945Stop-loss: 875Take-profit 1: 970Take-profit 2: 995Take-profit 3: 1,020Take-profit 4: 1,045Trade here $ZEC : 👇
post-image
ZEC+1.16%
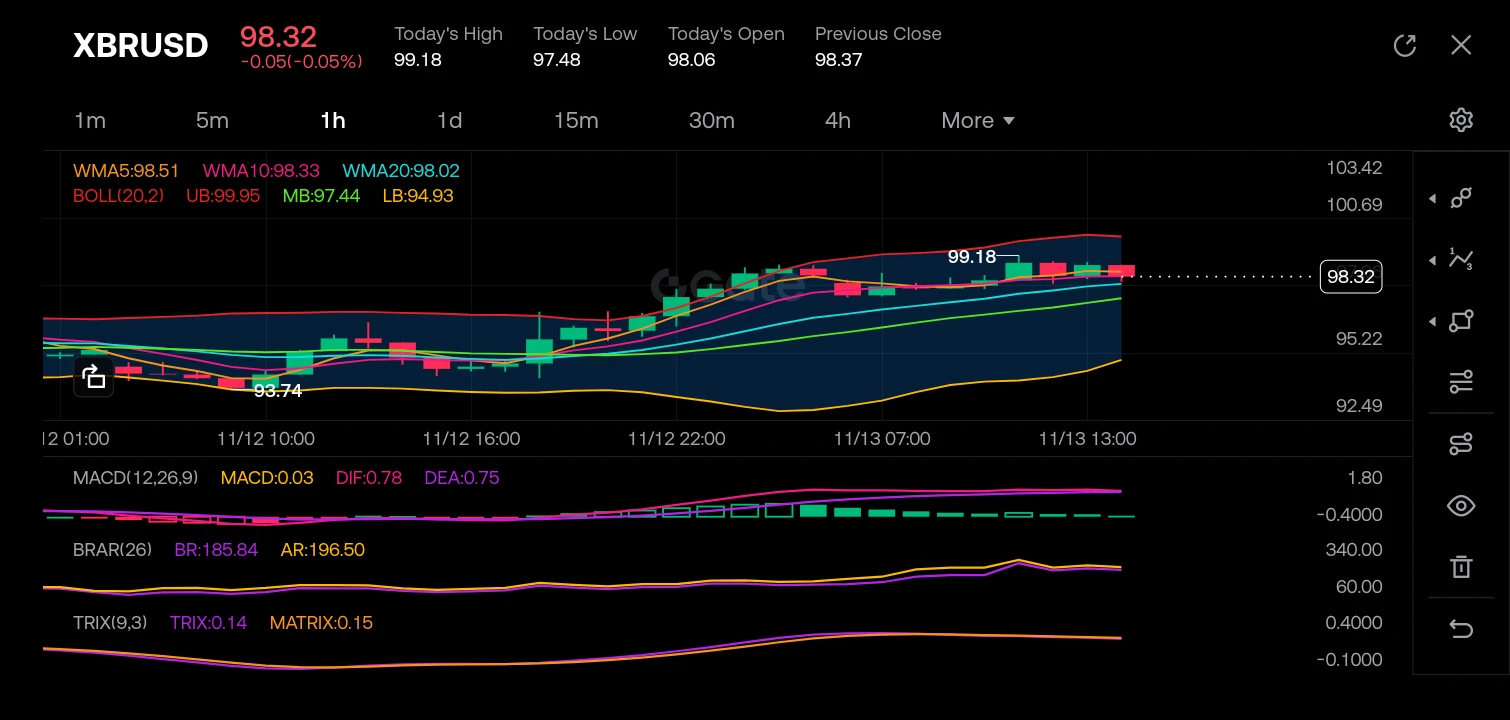
$XBRUSD
Looking at the XBRUSD (Brent Crude) 1-hour chart, the market structure has clearly shifted from a bearish downtrend to a bullish reversal structure. Price successfully bottomed out at 93.74 and has since established a series of higher highs and higher lows. The K-line analysis shows strong bullish momentum, with the price action currently riding above the WMA5 (98.51), WMA10 (98.33), and WMA20 (98.02), while the Bollinger Bands have expanded upward, confirming the volatility and trend direction. The MACD is well into positive territory (DIF 0.78, DEA 0.75), though the histogram is fla
post-image
XBRUSD+0.00%
  • 1
  • 2
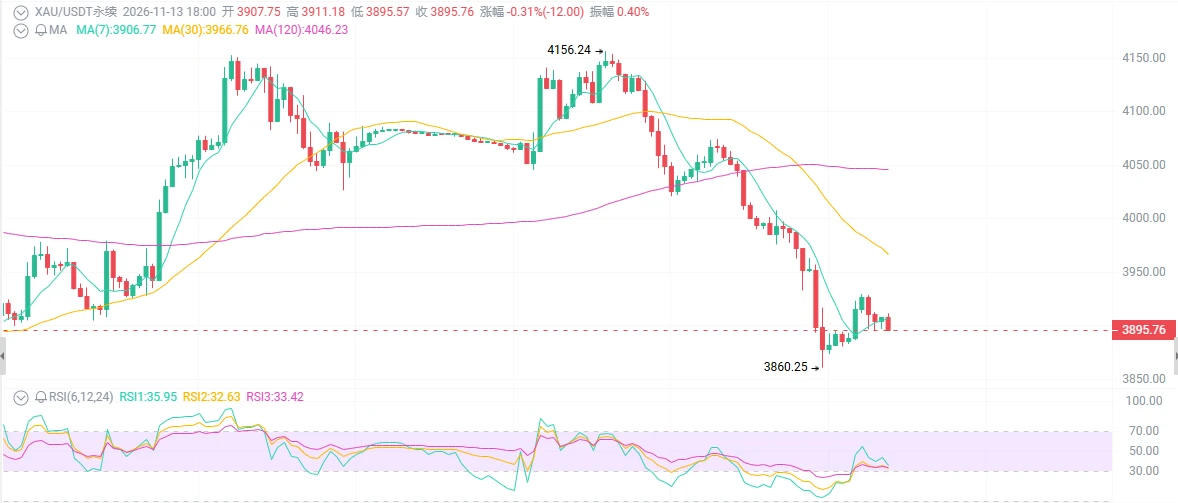
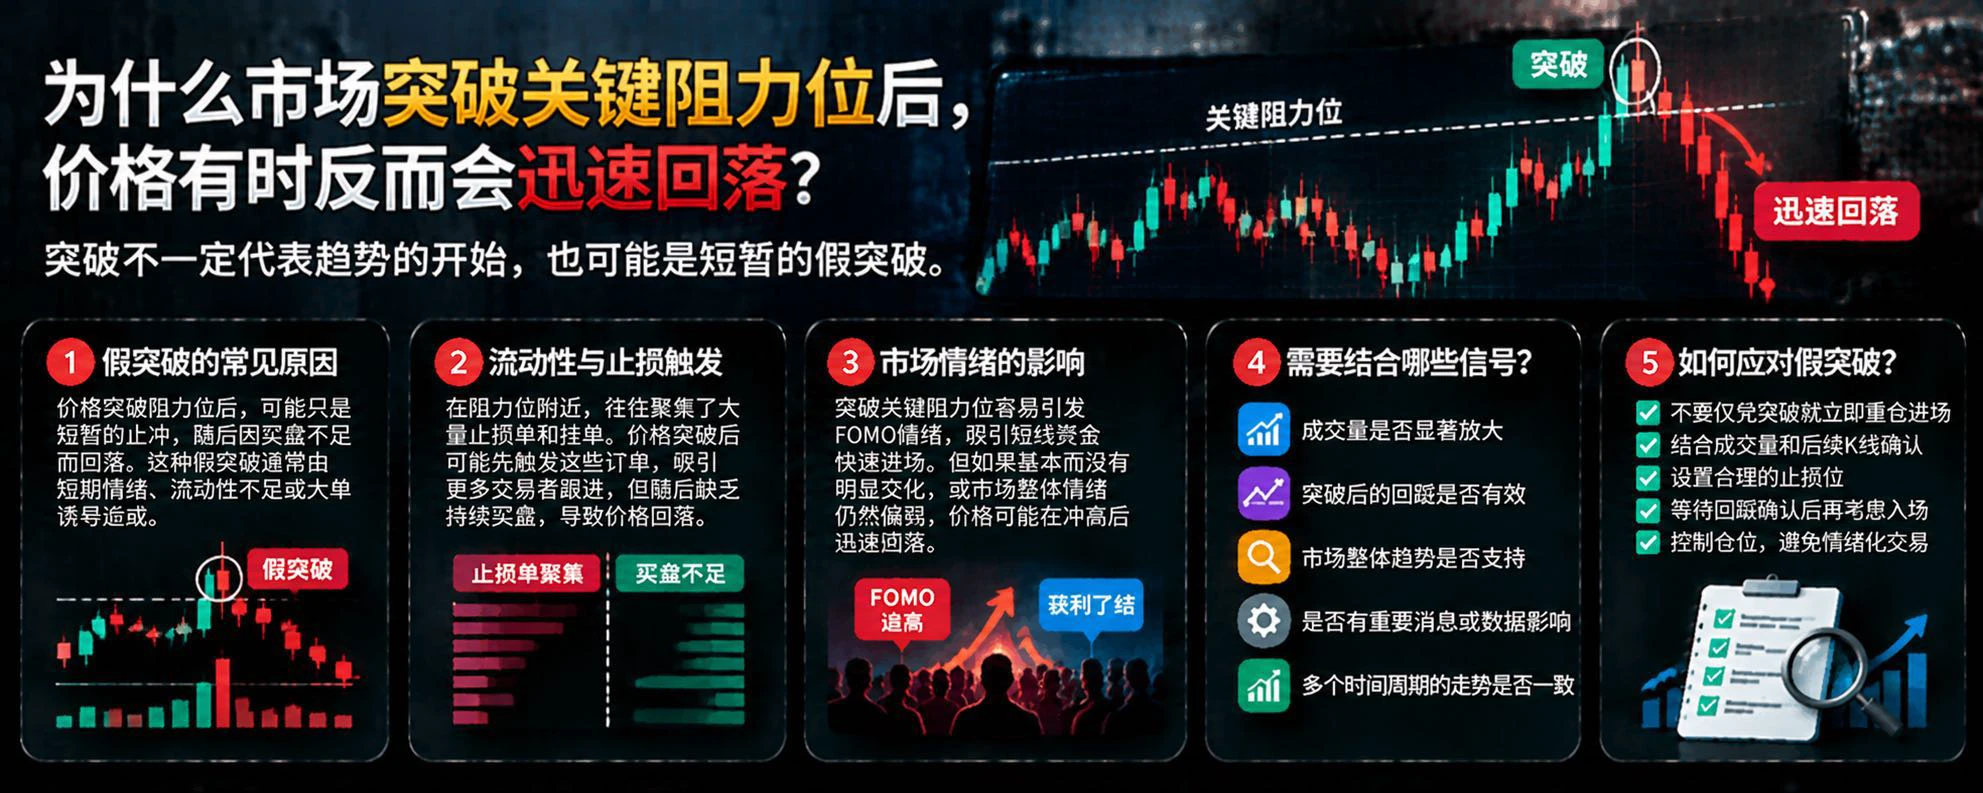
Would you still dare to buy the dip in gold at 3852?
Central banks bought 321 tons of gold in Q3, yet prices fell to a one-year low. You think 3852 is the bottom, but institutions are waiting for you to take the other side. Thursday’s long lower wick wasn’t a lifeline—it was a fishhook.

First, the surface picture: prices fell all week, then finally rebounded on Friday.

From a high of 4140, prices plunged all the way down, hitting a low of 3852 on Thursday—the lowest since October 2025. Dip buyers came in on Friday, pushing prices back into the 3890-3920 range.

The weekly candle will most li
post-image
BTC-0.67%
ETH-1.26%
XAU+0.38%
NVDA-4.49%
In cryptocurrency trading, many people watch BTC candlesticks every day but don’t know how to tell whether the market is currently in an uptrend or a downtrend. There’s actually a very common technical indicator that can help us see the market’s direction more clearly: the moving average (MA).

So what do MA20, MA50, and MA200 represent?

First, MA20 is the short-term moving average. It reflects recent price changes and is relatively sensitive to short-term market movements. When BTC trades consistently above MA20 and the line slopes upward, it usually indicates relative short-term strength.

post-image
BTC-0.67%
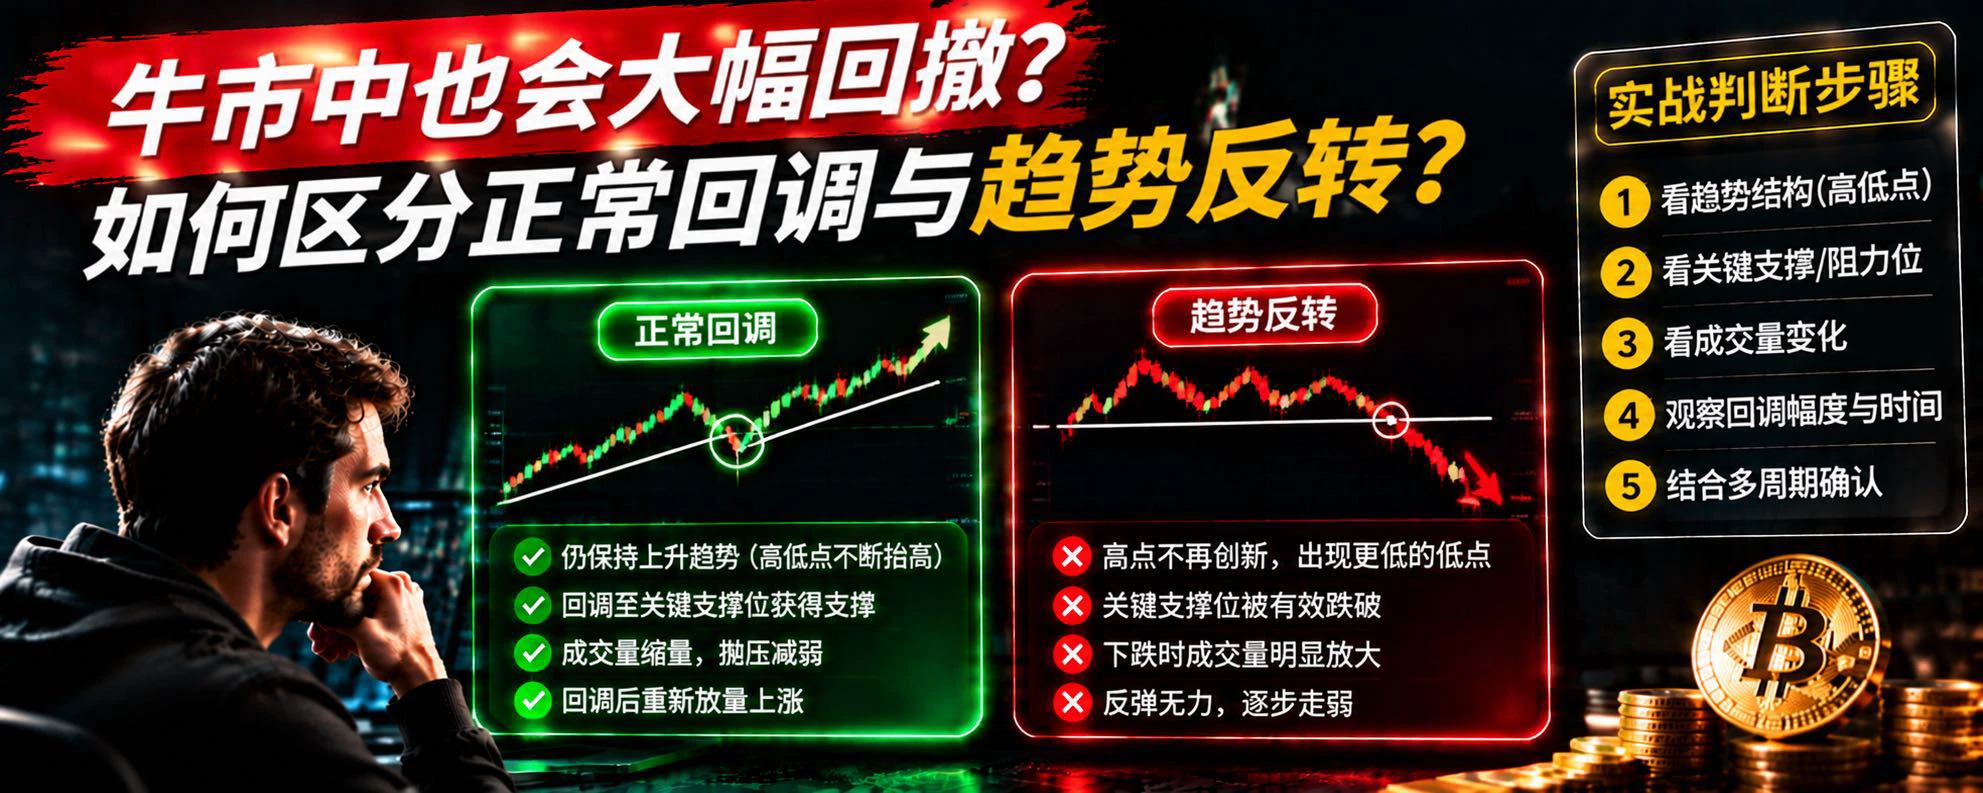
Can Sharp Pullbacks Happen in a Bull Market? How to Distinguish a Normal Correction from a Trend Reversal?

In the cryptocurrency market, many traders have had this experience: BTC rises continuously for a while, then suddenly takes a sharp dip. Some see it as a normal correction and keep holding; others think the bull market is over and rush to sell.

But how should you tell the difference?

First, watch the market structure. In a healthy uptrend, prices usually form progressively higher highs and higher lows. Even if a pullback occurs, the uptrend structure may still be intact as long as key
post-image
BTC-0.67%
What is the difference between isolated and cross margin? Why can the same market conditions affect accounts in completely different ways?

In crypto futures trading, many people focus on price, leverage, and liquidation prices, but overlook another equally important question: whether they are using isolated margin or cross margin.

These two modes determine how margin is allocated and how an account’s funds may be affected when an individual position incurs a loss.

First, what is isolated margin?

Isolated margin manages the margin allocated to a particular position relatively independently.
post-image
What Does It Mean When Price, Trading Volume, and OI All Rise?

In crypto derivatives markets, traders often watch for a particular combination: prices rise, trading volume increases, and open interest (OI) also rises.

Some see this as a sign of a strong rally, while others worry that the market is accumulating too much leverage. How should this combination be interpreted?

The key is that these data points can provide insight into market participation, but they cannot by themselves prove that prices will continue to rise.

First, what does a rising price mean?

A rising price means that the
post-image
🎓 From Starting a Business Alone to Speaking at Oxford, Dr. Han Shares New Opportunities in the AI Era

Gate Founder and CEO Dr. Han was invited to speak at the Oxford Union, where he delivered a “Start Alone” keynote reflecting on Gate’s 13-year entrepreneurial journey.

He also shared an idea worth noting: Boss + AI. 🤖

AI is changing how people access information, learn, and work, giving solo entrepreneurs greater execution capabilities.

But while AI can boost efficiency, sound judgment about direction and team building still matter.

💬 If you were starting from scratch with AI today, w
  • 2
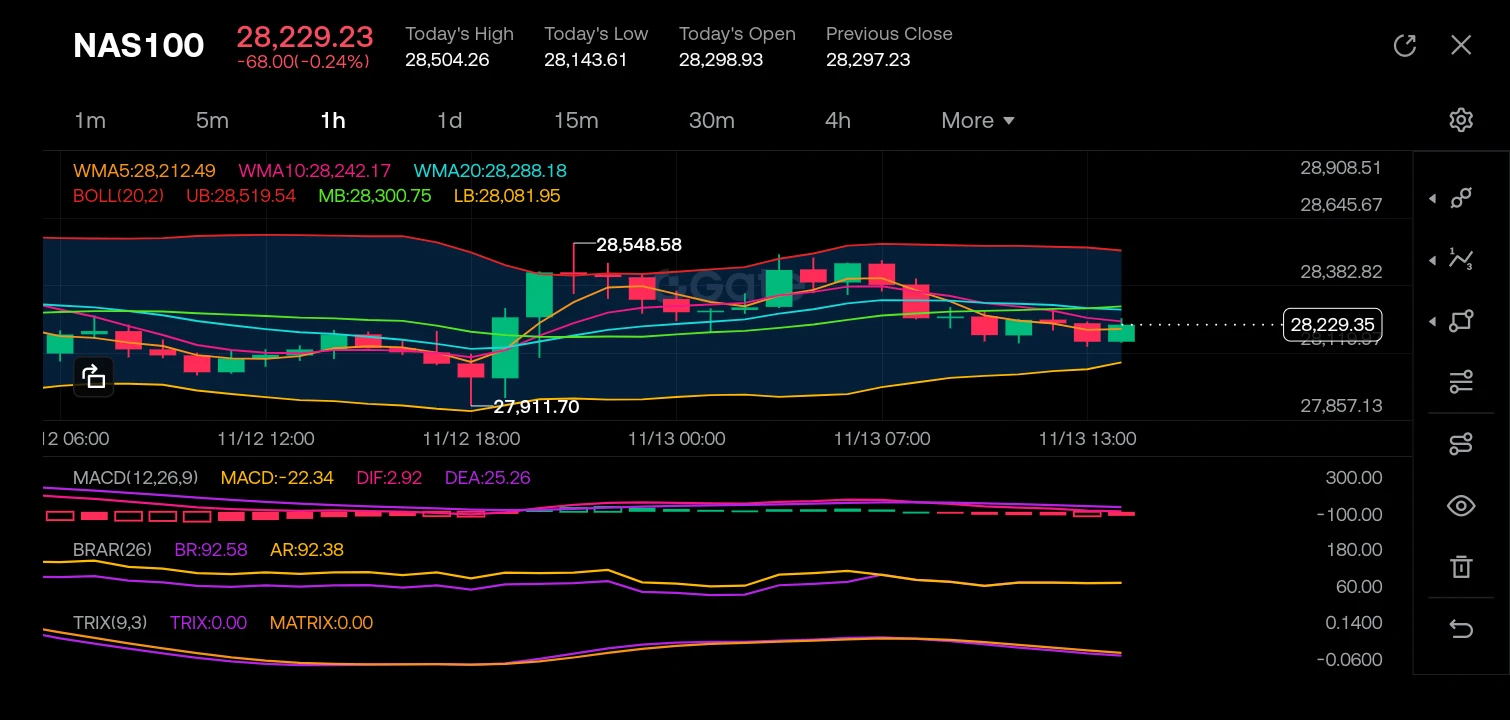
$NAS100 ‌
Looking at the 1-hour chart, the market structure has shifted from a bearish downtrend into a consolidation phase, having established a solid support base around the 27,911.70 level and a local resistance peak at 28,548.58, though the current price action is struggling to maintain the highs near the 28,300 level where the midline of the Bollinger Bands is acting as dynamic resistance.

The recent K-lines are showing indecision with alternating red and green candles hugging the middle Bollinger Band (MB: 28,300.75), and we are currently seeing small-bodied candles forming a potential
post-image
NAS100+0.00%
  • 3
  • 2
In cryptocurrency trading, many people spend a great deal of time studying candlestick charts, indicators, and trading strategies, yet overlook a harder problem: their own emotions.

Why do some traders have a decent trading system but still keep losing money? Often, the problem isn’t the market, but emotions affecting their execution.

First, FOMO (fear of missing out). They see BTC suddenly rise and, afraid of missing an opportunity, chase the price regardless of its level—only to see a pullback just after entering.

Second, greed. They’ve already reached their take-profit target, but want t
post-image
BTC-0.65%
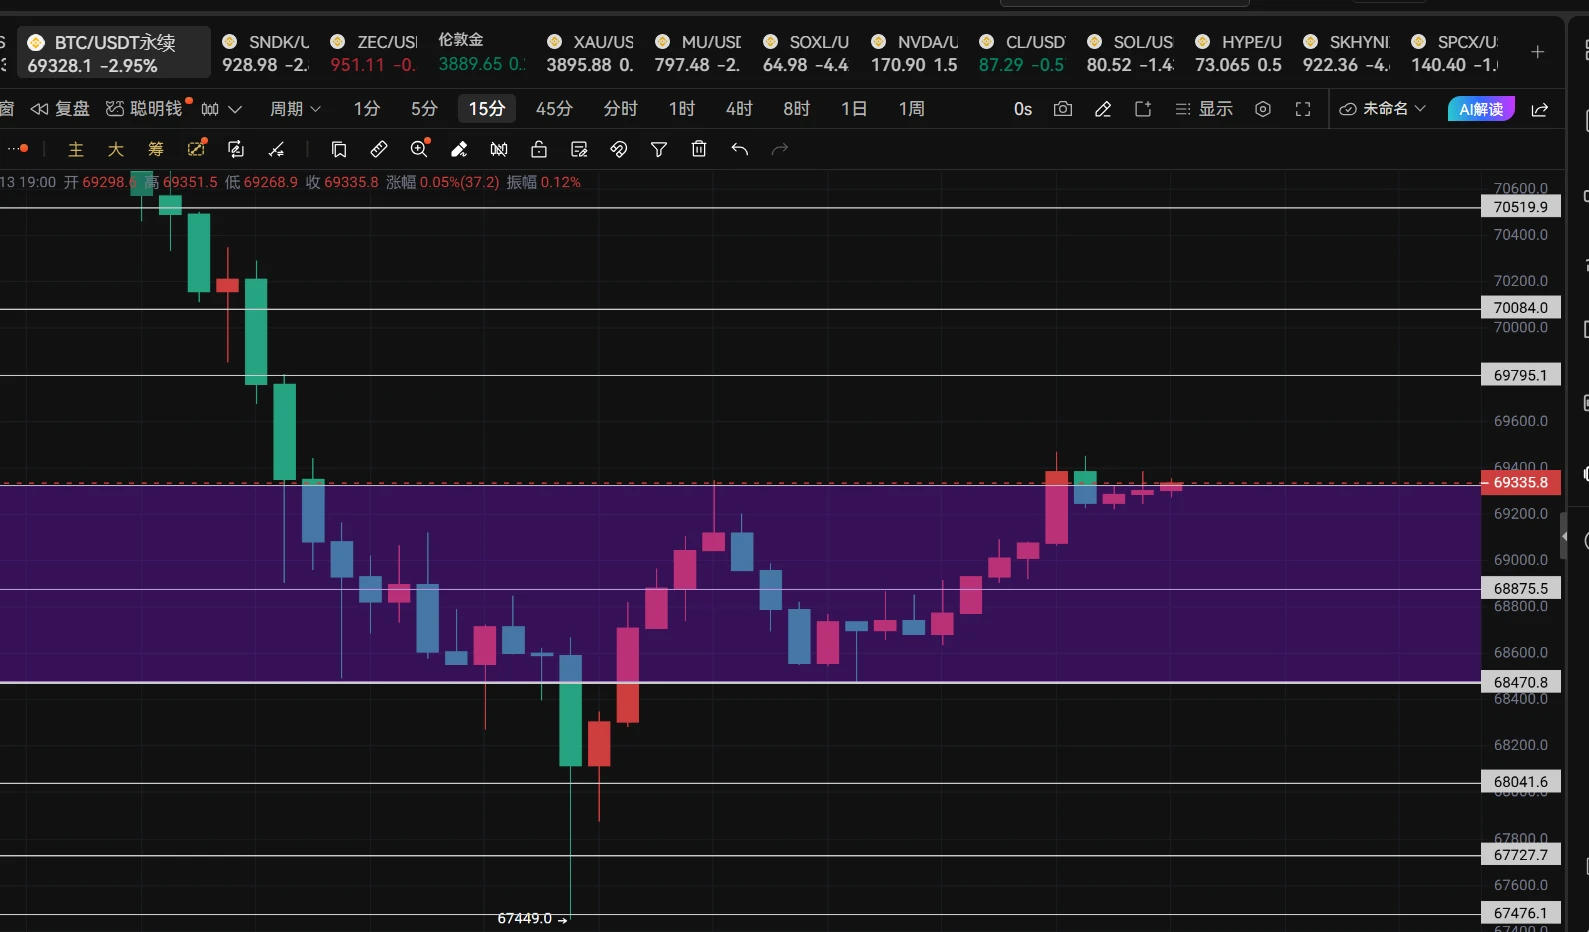
BTC’s weekly chart has posted seven consecutive bearish candles. Has it bottomed yet?

BTC’s morning sell-off exceeded expectations, driven by multiple negative factors converging: inflation data boosted rate-hike expectations, and Treasury yields rose. Jensen Huang’s departure also weighed on AI and overall risk sentiment, while Democrats winning both chambers fueled expectations of tighter crypto regulation. Continued outflows from spot ETFs, coupled with thin liquidity in the early hours, triggered concentrated liquidations of leveraged longs, magnifying the decline.

BTC rebounded after di
post-image
BTC-0.65%
  • 1
What Is the Difference Between Mark Price, Last Traded Price, and Index Price? Why Do They Affect Contract Trading?

In crypto contract trading, some people see that the last traded price has not yet reached their expected level, but their account is already showing a large unrealized loss or even nearing liquidation. Others find that the price on the candlestick chart does not exactly match the price the platform uses to calculate risk.

One important reason is that the last traded price, index price, and mark price are not the same thing.

First, the last traded price: the price of the marke
post-image
Load More

Join 40 M users in our growing community

⚡️ Join 40 M users in the crypto craze discussion

💬 Engage with your favorite top creators

👍 See what interests you

Trending Topics

JensenHuangResigns

516.7K Views8.1K Discussing

Jensen Huang has resigned as NVIDIA CEO and stepped down from the board. CFO Colette Kress will serve as interim CEO while NVIDIA considers internal and external successors. $NVDA fell more than 10% in premarket trading following the announcement. With one of AI’s most influential leaders stepping aside, markets are now reassessing NVIDIA’s leadership stability, AI strategy, and long-term valuation.

GateIPOAccessAnthropic

280.8K Views2.6K Discussing

Dr.HanOxfordUnionSpeech

144.6K Views470 Discussing

View More