Share your thoughts
placeholder
Article
Quietly: SOL is posting its worst September in 5 years, down 3.0% while the 2021 same month rallied 30.6%.
post-image
SOL-1.60%
Market update
live-cover
LIVE1,385
I had just switched the app to the background when it suddenly plunged—what, is it playing hide-and-seek with me? I wasn't even ready to celebrate, and my account had already shouted “feels good” for me.
When I checked the charts after lunch, the market was still pretending to be strong. $GWEI Trading volume was low, the push upward lacked momentum, and it reeked of a bull trap. I figured nobody would follow through on the upside, so the signal at the time was bullish with a bearish bias. Waiting for it to expose its weakness is much more comfortable than chasing it.
From 0.029983 to 0.021956
post-image
GWEI-3.67%
DOGE-1.57%
XRP-2.47%
I wasn't even expecting to break even, but it went straight into profit for me. This service is incredibly on point. 🥹
A few afternoons ago, the market was still choppy, and $ZORA was quickly bought up every time it pulled back, with volume quietly picking up. I opened a long around 0.00627, with my take-profit and stop-loss levels planned in advance. When it plunged intraday, it really shook me—I almost panicked and closed the position. 😅
Just refreshed: 0.00787, with +626.21% secured. Honestly, it feels amazing—the sleepless nights earlier were all worth it.
Managing risk in advance is ca
post-image
ZORA-2.36%
ETH-0.13%
BNB-0.74%
$ZEC is showing an interesting recovery on the 15M chart.
After dropping to around $1,054, price started building higher lows and pushed back above $1,089, now trading near $1,109.
The key area I’m watching is $1,128–$1,143. A clean breakout above this zone could strengthen the short-term bullish structure.
But if price loses $1,089, the recovery could start losing momentum.
For now, patience matters more than chasing the move. Let the next breakout or rejection confirm the direction.
ZEC/USDT — 15M
DYOR. NFA.
post-image
ZEC-9.76%
  • 3
  • 2
BSC is for real easy mode
For those that are still trading on SOL, what the fuck are you even doing to still be on that rapist chain in this market
post-image
SOL-1.60%
I’m really envious. In August, global gold ETFs attracted $18 billion, the second-largest monthly inflow in history.
Total assets rose 16% to $615 billion, while holdings increased by 121 tons to 4,189 tons, hitting a new all-time high.
During the same month, the ETF $BTC kept swinging back and forth between inflows and outflows.
Safe-haven money is really pouring in. When will it be our turn to get a taste in the crypto space?🥹
post-image
BTC-1.45%
I didn’t do anything—just went to the bathroom, and when I came back, the candlestick chart had already done the work for me. A few days ago, before bed, I was still reviewing $DOGE ’s rebound. The more I looked at it, the more it seemed like a low-volume fake move, so I left the short position there and let it perform on its own. Before the market had fully started moving, the key level above was already obvious.

The resistance above was clear. Every push upward fell just short, with insufficient support as sell orders kept pressing down layer by layer. I followed with a high-level shorting
post-image
DOGE-1.57%
XRP-2.47%
LAB-7.30%
Is LINK about to break out while everyone is sleeping on the daily trend?

$LINK /USDT - LONG

Trade Plan:
Entry: 11.422 – 11.476
SL: 11.110
TP1: 11.703
TP2: 11.873
TP3: 12.128

Why this setup?
Why now? The daily trend is bullish, the 1h price sits at 11.449, the 15m RSI is 40.43, the 1h ATR is 0.108738, and the entry zone is 11.422 to 11.476. The bullish daily trend sets the stage, while the 1h price at 11.449 marks the exact entry reference. The 15m RSI at 40.43 shows room to run before overbought, and the 1h ATR of 0.108738 defines realistic volatility for targets. The entry zone between
post-image
LINK-2.96%
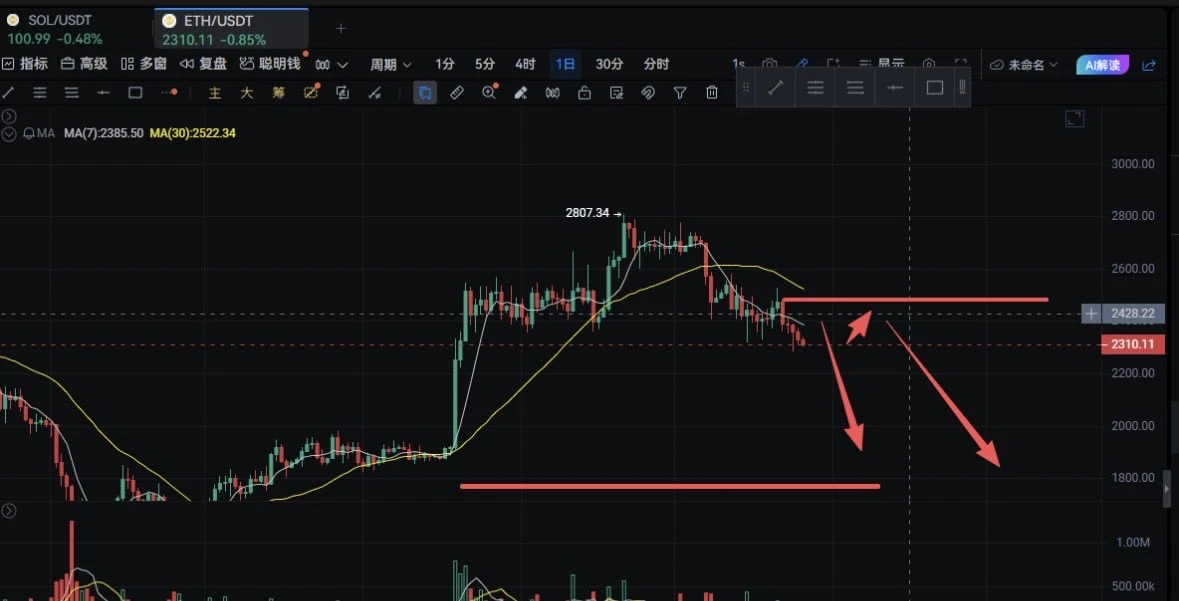
ETH swing-trade profit secured
Just now, ZEC took profit at 1090, and ETH's take-profit level was 2474. Since the entry price was 2444, I planned to exit after 30 points. It successfully hit take profit, but took a little longer, so you need to withstand the pressure and hold on.
$ETH Entered at 2444 👉 took profit at 2474
Secured 30 points of profit and pocketed $800
There is still an upward trend, but ETH has reached resistance around 2480. If BTC breaks through 776, ETH will very likely surge toward 2500, so the best outcome would be to wait for ETH to pull back to around 24
ETH-0.13%
💰 $FF   /USDT
🔻 SHORT
✳️ ENTRY (Use DCA STRATEGY) : 0.168, 0.17, 0.173
🎯 TARGETS - 0.165, 0.16, 0.1534, 0.145, 0.13, 0.1180
🀄️ LEVERAGE -  cross 15x
🔴 STOPLOSS - 0.175
FF+8.09%
CPI to be released tonight is the btc turning point here ?
live-cover
LIVE1,923
#GateTop4MainstreamCEX
The next battle in crypto is no longer simply about who can attract traders. It is about who can earn their trust at scale.
Gate’s position among the top four mainstream centralized exchanges is therefore more than a ranking headline.
It represents a broader shift in how the crypto industry is evaluating exchanges.
For years, centralized exchanges competed primarily on trading volume, token listings, fees, leverage, and user acquisition.
Today, the equation is changing.
Users increasingly care about something much deeper:
Liquidity + security + transparency + product dep
post-image
You can check out Gate’s latest campaign, with two activities running at the same time.
This CandyDrop has a prize pool of 851,200 CNPY. The tasks are pretty simple, and you can participate in the rewards after spending a few minutes completing them.
There’s also a BTC price prediction activity, which I think is a bit more fun. Predict BTC’s price at 20:00 on September 18 (UTC+8), and the top 200 participants with the most accurate predictions will receive additional rewards.
I’ll leave my prediction here: 80110
The campaign link is below. If you’re interested, go check it out yourself:
#GateB
post-image
CNPY+29.08%
BTC-1.20%
Why is SYMBOL holding 713.8 like it has nowhere else to go?

$BNB /USDT - LONG

Trade Plan:
Entry: 712.7 – 714.9
SL: 700.4
TP1: 723.9
TP2: 730.6
TP3: 740.7

Why this setup?
Why now? The 1h price is pinned at 713.8, the exact entry reference, while the 15m RSI sits at 51.59, showing neutral momentum that could flip either way before the next move. The 1h ATR of 4.309192 tells us volatility is compressed enough for a sharp breakout, and the daily trend being range-bound means a clean direction is overdue. The entry zone between 712.7 and 714.9 aligns perfectly with this pinning, giving a tigh
BNB-0.74%
Prediction markets have an extremely broad scope. In theory, traders with knowledge of the oil industry can express their views by going long or short crude oil contracts, but in reality, many event outcomes cannot be forecast through mainstream commodity markets or stock markets, making such scenarios particularly well-suited to prediction markets.
post-image
Guys, this is why you should always keep 100U in your wallet to gamble on shitcoins. He only spent 104U and turned it into $76,000 on $OTC , a total return of 700x! 🚨
This SOL wallet bought $OTC and cashed out as it rose: $52,000 in realized gains, plus $20,000 in unrealized gains, totaling approximately ¥550,000.
This wallet’s strategy is to take profits while keeping a position: first recovering part of the profits while retaining the remaining position to continue seeking upside.
You can monitor his wallet address yourself:
post-image
SOL-1.60%
Honestly, selling every $BTC pump here might be one of those trades you regret later
BTC can chop around and do absolutely nothing for weeks…
Then one big liquidity push comes in and suddenly:
$80K breaks
Shorts start getting cooked
Momentum kicks in
$90K comes back into play
And if $100K gets reclaimed and actually holds?
That’s no longer the ceiling.
That could become the floor.
I’m not saying it happens tomorrow.
Just saying… I wouldn’t want to be aggressively short when BTC decides to wake up.
post-image
BTC-1.20%
Why is everyone suddenly shorting $LTC /USDT right now?

$LTC /USDT - SHORT

Trade Plan:
Entry: 52.97 – 53.21
SL: 54.26
TP1: 52.21
TP2: 51.63
TP3: 50.75

Why this setup?
Why now? The 1h price is sitting at 53.09 inside a tight range, and the 15m RSI is already at 57.21, meaning short sellers are stepping in while momentum is still neutral. The 1h ATR of 0.487843 shows volatility is compressed enough to allow a precise entry between 52.97 and 53.21. The daily trend is range, so this short setup targets a move toward TP1 at 52.21 and TP2 at 51.63, with the invalidation level set firmly at 53.
LTC+0.72%
Today's breakfast for a lean physique: two eggs, one steak, and a cup of coffee.
post-image
Load More

Join 40 M users in our growing community

⚡️ Join 40 M users in the crypto craze discussion

💬 Engage with your favorite top creators

👍 See what interests you

View More