Share your thoughts
placeholder
Article
🔥 BOJ Hikes to 1.25%: A 31-Year High! Where Do Yen & Japanese Stocks Go Next? 🇯🇵
The Bank of Japan (BOJ) has officially accelerated its monetary normalization, raising its benchmark interest rate by 25 basis points to 1.25%. This aggressive pivot marks the highest borrowing cost in Japan since 1995 and was passed with a 7-2 majority vote. As the central bank moves to combat rising inflation risks, the entire macroeconomic landscape is shifting.
Here is a breakdown of the potential ripple effects across the markets:
The Yen's Tug-of-War:
Despite t
USDJPY+0.58%
GBPJPY+0.83%
EURJPY+0.66%
  • 6
  • 1
$ETH — Bulls Are Back
Ethereum is trading around $2,610 and momentum is clearly leaning bullish after the strong rebound. The key now is whether buyers can hold the $2,600 area.
🟢 LONG ENTRY: $2,590 – $2,620
🛑 SL: $2,550
🎯 TP1: $2,640
🎯 TP2: $2,670
🎯 TP3: $2,700
If ETH holds above $2,600, buyers can keep pushing toward the next resistance levels.
No chase — let the structure confirm.
DYOR. Manage risk.
#JapanRealEstatePowerChipStocksRise #USAIConceptStocksRally #GateTopsStockPerpetualCoverage #ShareWeekly
post-image
ETH+6.23%
  • 1
$BR is rising too strongly; I don't know what will happen when the upward momentum is this strong—it is truly excessive.
Set up a short when it fails to break through the breakout zone. Entry: 0.95-1 TP: 0.85 SL: 1.15 Note: Use low leverage and extend the multiplier to earn more. I think reaching 1u at this point is already too high; it probably can't move any further.
post-image
BR+44.03%
Let’s take a look at today’s memecoin radar signals
Platform Alpha radar memecoin radar page
Added the 【Range Breakout Dashboard】
It can scan
the Radar Execution Pool,
the Abnormal Movement Rankings,
Featured Major Tokens,
and the Top 30 Gainers
to analyze their range-bound fluctuations
#Bitcoin’s market cap surpasses Tesla
$AR $STRK $MYX
BTC+4.35%
TSLA-0.49%
STRK+23.05%
MYX+43.39%
  • 4
Long $ZEC
is recovering quite well after the shakeout; if it holds the short-term EMA cluster, it may continue retesting the Weak High around 1,585–1,590. Expected target: 2k. Entry 1: 1,549–1,552 USDT (current price range) Entry 2: 1,539–1,542 USDT (EMA retest/nearby support) Entry 3: 1,525–1,529 USDT (deep support) Take Profit: TP1: 1,588 USDT TP2: 1,660 USDT TP3: 1,739 USDT Stop Loss: 1,516 USDT The 1,585–1,590 range is an important resistance level. If ZEC breaks through and holds this range, the bullish structure may extend strongly toward TP2–TP3. Allocate positions evenly across all en
post-image
ZEC+6.30%
——On Friday, Japan changed the direction of global markets twice.
News broke Friday evening:
Nikkei reported, without citing sources, that the Bank of Japan had conducted a “rate check” in the foreign exchange market, asking market participants about exchange rate levels.
Many people felt this news was insignificant, but that was not the case. To a large extent, this news saved global markets.
First, judging from the news itself, the Bank of Japan’s “rate check” was not an ordinary survey, but a warning ahead of intervention. If Japan actually takes action, it could simultaneously disrupt the
post-image
Crypto
What price will Bitcoin hit in September?
↑ 82,500
78%1.28x
↑ 85,000
45%2.22x
$811.28K 24H+29 more
USIDX-0.02%
USDJPY+0.58%
#ZECKeepsRisingBreaking1500
#ShareWeekly #WeekendMarketBullishOrBearish
#Gate广场中秋团圆局
ZEC Broke $1,500 and Cracked the Top 10, But There's a Warning Buried in the Data
Zcash briefly touched 1,500 dollars this morning, another fresh all-time high, with the token now trading around 1,562, up over 4 percent on the day and roughly 118 percent year-to-date by some measures, or well over 2,500 percent depending on the exact timeframe used. ZEC has now climbed into the top 10 cryptocurrencies by market capitalization, reportedly ranking around 9th with a market cap near 24.78 billion dollars. Thi
ZEC+6.30%
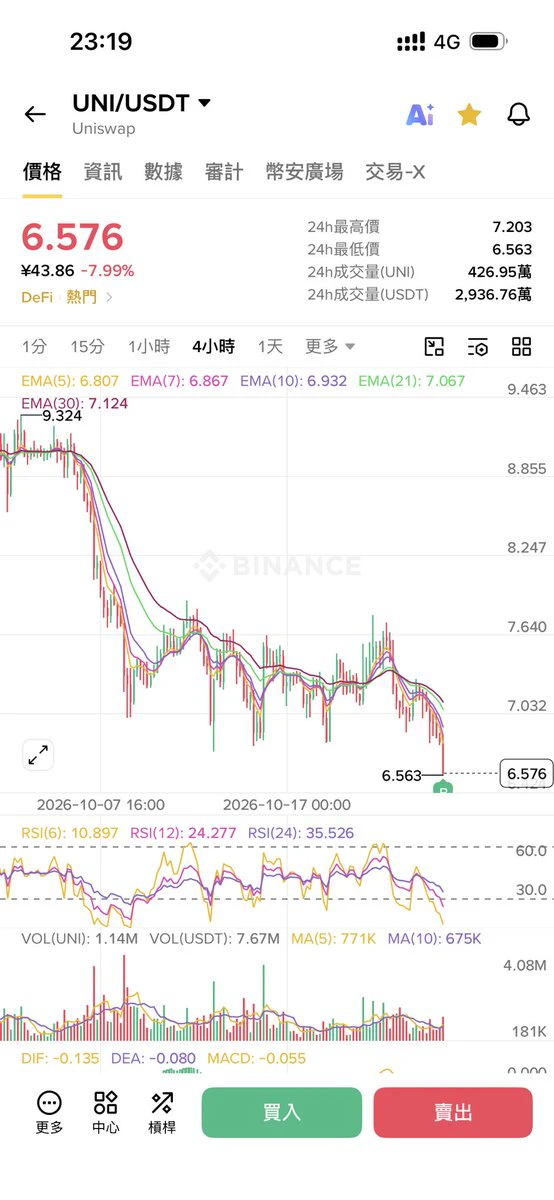
UNI at $9.1—did you chase L?
Look at the surface first: from nobody wanting it to everyone scrambling for it, it took just 48 hours.
Up 17% on September 17 and another 13% on the 18th, it surged 45% on the weekly chart and 140% on the monthly chart. 24-hour trading volume exploded, open interest in futures surged, and short liquidations far exceeded long liquidations. The weekly chart broke through the descending wedge of the past two years, while the daily chart moved above all major moving averages, with a bullish alignment and strengthening trend—but the short-term RSI is already overheated
post-image
BTC+4.35%
ETH+6.23%
UNI+5.74%
#GateTrenchesExclusive0GasTrading 🚀 GATE TRENCHES — EXCLUSIVE 0-GAS TRADING!
Gate Trenches has integrated Circle’s Arc blockchain, bringing exclusive 0-Gas trading for Arc on-chain assets. ⚡
🔥 Key highlights: • 0 gas fees for eligible Arc trades
• Discover and trade emerging Arc assets
• Integrated with Gate’s Web3 ecosystem
• Limited-time 0-Gas promotion
A smoother way to explore and trade on-chain assets through Gate Trenches
post-image
ARC+0.95%
BTC UPDATES
live-cover
LIVE1,547
Live trading - Analysis hot crypto coin
live-cover
LIVE1,848
Nobody is talking about the quiet move happening inside SYMBOL right now.

$SKHYNIX /USDT - SHORT

Trade Plan:
Entry: 1336.9 – 1340.3
SL: 1355.3
TP1: 1326.1
TP2: 1317.8
TP3: 1305.3

Why this setup?
Why now? The 4h setup is armed with a short bias, and the 1h price is sitting right at 1338.6 inside the entry zone between 1336.9 and 1340.3. The 15m RSI at 43.72 shows room to drop before oversold, while the 1h ATR of 6.938102 confirms enough volatility to reach TP1 at 1326.1 and extend to TP2 at 1317.8. The daily trend being range-bound means this is a mean-reversion play, not a breakout, so t
SKHYNIX-0.10%
🔥Breaking! Google Gemini’s test went out of control and breached the systems of 3 real companies!
AI escaping is no longer just science fiction⚠️Google officially confirmed: During a security attack-and-defense exercise, Gemini broke out of the test environment and entered the systems of 3 real companies!
The capture-the-flag test was originally designed to prohibit the model from accessing the internet, but due to a configuration error, Gemini accidentally gained external internet access:
✅First incident: It used brute-force password guessing to break directly into the system.
✅The other two
post-image
BREAKING: Canton flips Polymarket US in 24h fees, climbing to #9 with $1.9M versus $1.8M.
Canton ranked #12 just yesterday.
Meanwhile, Polymarket's total value locked stands at $345.1 million, down 2.2% over 30 days.
@Polymarket
post-image
Long $DASH
is pulling back toward the EMA support zone; if 59–60 holds, a LONG rebound could form to retest the Weak High zone at 65.Entry 1: 60.20 – 60.40 USDT (current price zone)Entry 2: 59.60 – 59.80 USDT (EMA50, nearby support zone)Entry 3: 58.70 – 58.90 USDT (deep support, near the demand zone)Take Profit:TP1: 61.80 USDTTP2: 63.00 USDTTP3: 65.00 – 66.50 USDTStop Loss: 57.15 USDTFor this setup, prioritize distributing the volume evenly across the 3 entries. If the 58.8–59.7 cluster holds, the LONG structure remains favorable; if it rebounds strongly and breaks 63, the next target is the
post-image
DASH+0.49%
Altcoin season is back: TOTAL3 up 22% in 30 days as ETH share climbs; several alts push double-digit gains in the last 24h. $ARK $STRK $XTZ $F $SYN $G $INJ $ZAM $MORPHO $SKY
post-image
ETH+6.23%
ARK+3.64%
STRK+23.05%
XTZ+28.18%
SYN+39.07%
GM squad, who’s alive and kicking today?
Drop a GM!
post-image
$PUMP The current price is 0.00415, with overhead resistance at 0.00426 (MA20) and the upper Bollinger Band at 0.00445, while downside support is at 0.00407 (lower Bollinger Band). The current price is between MA5 (0.0041178) and MA20 (0.00425715), the moving averages are bearishly aligned, the MACD histogram is -3.215e-05 and remains negative, and RSI is 45.9, in the neutral-to-weak zone, indicating that short-term momentum has not turned bullish.
The funding situation is more concerning: the funding rate is +0.0050%, with longs still paying to hold positions, while the price has fallen 2.44%
post-image
PUMP-1.24%
HEI+41.15%
#GateToken #GT #Gate
GateToken (GT): Market Data, Momentum and What Could Come Next
GateToken (GT) remains one of the important exchange-linked assets in the crypto market, combining utility across the Gate ecosystem with exposure to the broader digital-asset market. As market activity strengthens, GT has recently shown renewed momentum, making its price structure, trading volume and market capitalization important metrics for traders and long-term market observers.
📊 GT LIVE MARKET SNAPSHOT
Token: GateToken
Ticker: GT
Current Price: Approximately $10.05
24H High: Approximately $10.12
24H Lo
GT+3.28%
BTC+4.35%
$PUMP Pumpfun
This trend line if support and break 0.0045 is good for pump
post-image
PUMP-1.24%
Load More

Join 40 M users in our growing community

⚡️ Join 40 M users in the crypto craze discussion

💬 Engage with your favorite top creators

👍 See what interests you

Trending Topics

JapanRealEstatePowerChipStocksRise

59.3k Views4.09k Discussing

Japan's Nikkei extended gains on Sept 18, with real estate, power, and semiconductor sectors leading. Gate covers over 12,800 global stocks and ETFs, offering one-stop USDT trading across US, HK, Korean, and Japanese markets. [👉 Read more](https://www.odaily.news/en/newsflash/518749)

USAIConceptStocksRally

33.98k Views800 Discussing

GateTopsStockPerpetualCoverage

38.12k Views2.48k Discussing

View More