Square
Following
Hot
News
Profile
Share your thoughts
placeholder
Article
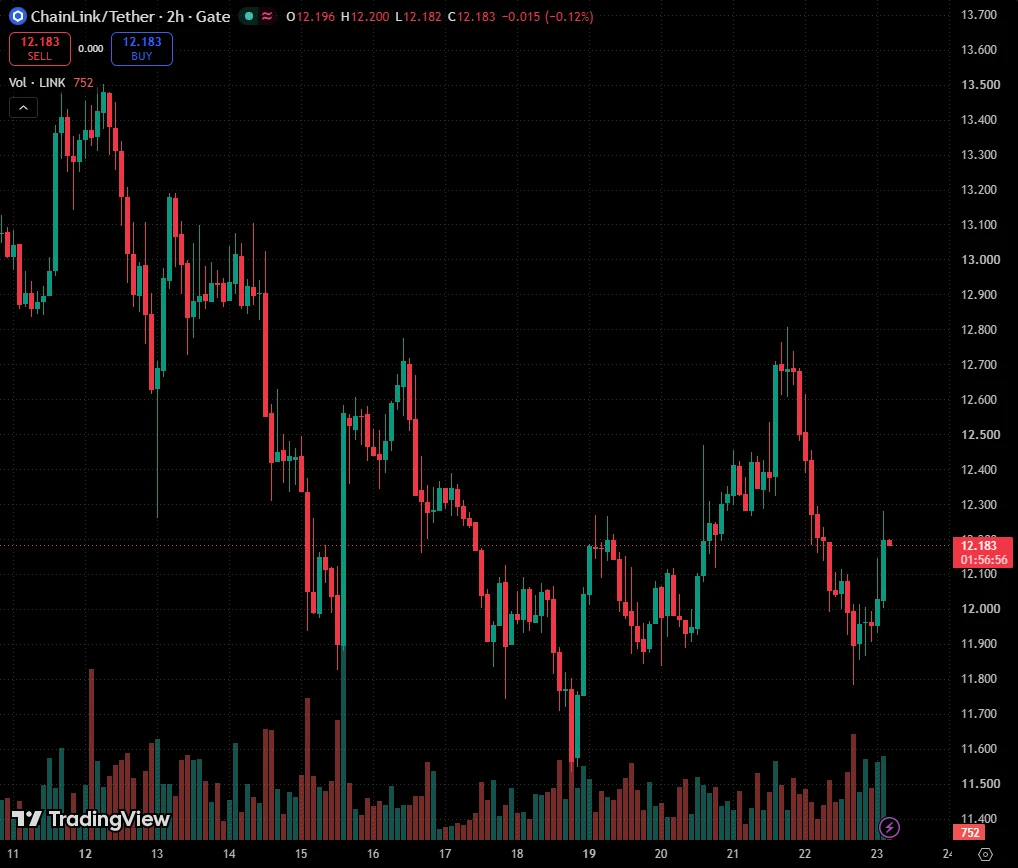
$LINK LINKUSDT 2H: Creek break, retest and sweep of prior lows
LINK broke above its downtrend line, came back to test it, and swept the prior lows. I'm watching the 2H to confirm that the test is over.
The bigger picture
The fall into the 19 Oct low formed an ending diagonal, a wedge shape that often marks the end of a move. Price then broke above the Creek, the downtrend line that capped the fall. Since the break, price has come back to test that line from above.
What just happened
Price rose to a high on 22 Oct, then fell back to the Creek and the Prior Lows line at 11.907. Several earlier l
post-image
LINK-0.04%
☀️ GM, the market has shifted gears. Are you ready to shift?
The Nasdaq fell 2.6% in the previous trading session. BTC is currently around $81.5K, and Brent crude remains near $113.
Today, let’s not guess whether prices will rise or fall. Let’s talk about what you’d adjust first.
🛡️ Positions: stay the course or reduce risk?
🔎 Assets: keep watching the same ones or update your watchlist?
⏳ Timing: act according to plan or wait for a clearer signal?
🎁 Share your trading plan on Gate Square and get a red packet reward just for posting. Larger red packets will also drop at random.
👇 Write dow
post-image
NDAQ+7.38%
BTC-1.25%
Trenches
Kimchi
K
bade
b
Kimchi
CSoc...pump
Market Cap
$.
Change
.
24h Vol
$.
Holders
.
kimchi
k
bade
b
kimchi
B1Y2...pump
Market Cap
$.
Change
.
24h Vol
$.
Holders
.
AGT
A
bade
b
AGT
0x5d...e274
Market Cap
$.
Change
.
24h Vol
$.
Holders
.
McRib
M
bade
b
McRib
8idE...pump
Market Cap
$.
Change
.
24h Vol
$.
Holders
.
ZIG
Z
bade
b
ZIG
0x8c...1145
Market Cap
$.
Change
.
24h Vol
$.
Holders
.
Same 1000U, wildly different outcomes: Last night, $AKE was still bottoming out at 0.0212; this morning, it shot straight up to 0.0365, surging 50.34% in 24 hours on $190M in trading volume. It’s crystal clear who was on board and who was left holding the bag.
Round one: chasing the rally vs. waiting for a pullback. The price is now 0.0364, just 0.0001 below the 24-hour high—basically perched on a needle’s tip. If you chase in, where do you put your stop-loss? At 0.033, that’s a 9% loss; at 0.030, it’s 17%. Put in 1000U and you’re down 170U right away, which can wreck your mindset. The pros’ m
AKE+49.77%
$AKE This shitcoin is really disgusting
post-image
AKE+49.77%
  • 1
Why does the exchange show a profit, but after deducting all costs, the amount you actually earn is much smaller?
When reviewing their trades, many traders focus only on the difference between the buy and sell prices, while overlooking an important issue:
Paper profit does not necessarily equal actual net profit.
Especially in the cryptocurrency market, trading frequency, order types, holding periods, and market liquidity can all affect the final result.
To know whether a strategy can actually make money, you need to account for at least the following five types of costs.
1. Trading fees: Ever
post-image
  • 1
🚨 $XMR COULD BE READY FOR A MASSIVE RALLY — ARE YOU POSITIONED?
XMR’s Monero is showing relative strength against many top coins,
LONG-TERM TARGETS: $1,000 $1,500
Are you buying $XMR before the next potential rally?
Share your strategy in the comments.
$XMR ‌#GateWCTCS9GlobalTradingCompetition
post-image
XMR+0.00%
When $SHAV coin was trading at $10k Mcap , I thaught , It won't do anything lol
Now it did 300x too fast
Same thing will happen in $LUCIA Caminos , it is famous girl in GTA 6 & ll trade above $1M Mcap soon from 5k Mcap
Ca : EbiNPjCJnP9vUvcy8mrCnYVjLjKXiNtxgNbPdZnxpump
Director, aren’t you afraid to keep telling it like it is?😂
Bitcoin ETFs See Two Consecutive Weeks of Net Outflows!
live-cover
LIVE1,548
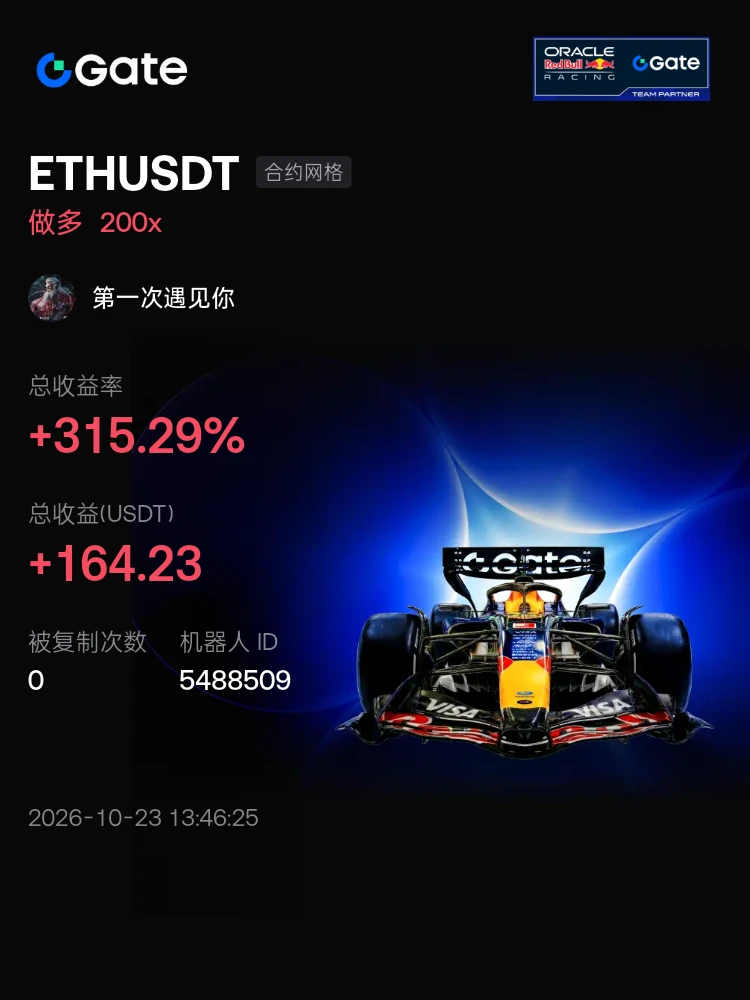
#交易机器人 I'm using an ETHUSDT futures grid bot on Gate—join me and copy my trades
post-image
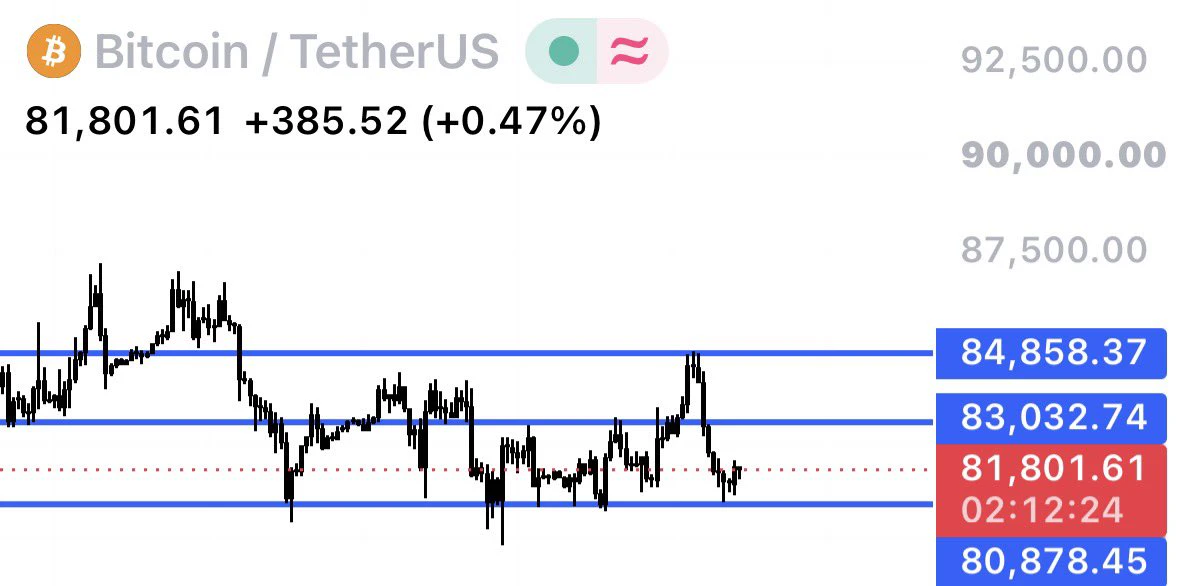
today i’m expecting a bounce on $BTC either to 84k or 83k after yesterday’s huge sell pressure
i’ve seen a breakout on the range on 15m TF, so i’m taking a long here
sl @ $81,500
1st tp @ $83k, 2nd tp $84k
post-image
BTC-1.25%
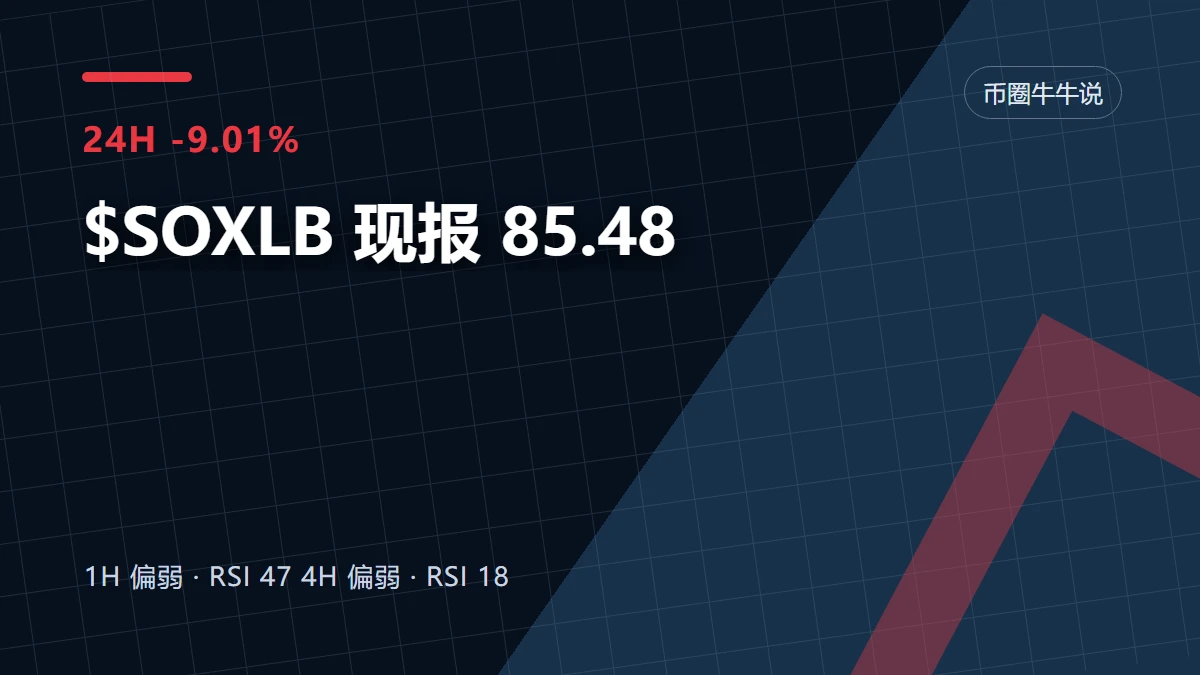
$SOXLB 24 hours down 9.01% to 85.48, but it has not shown a high-volume decline followed by stabilization. The 1-hour and 4-hour charts are both weak; oversold and bottoming are not the same thing.
The 24-hour high was 94.26 and the low was 78.17. Support on the 1-hour chart is 78.17, resistance is 94.26, and trading participation is 0.50x. A large decline only shows that selling pressure occurred; it does not mean the price is cheap, much less that anyone is really defending support.
I’d rather treat rebound demand as just that—not call oversold conditions a bottom. Do you treat oversold cond
post-image
#80,000 is the institutional cost basis line
According to reports from scouts on the ground
The average cost basis for US spot BTC ETFs and publicly listed companies' treasuries
is between 80,000 and 81,500
If the daily close falls below 80,000, institutions as a whole will be in unrealized losses
The next reference level is around 77,600
post-image
BTC-3.69%
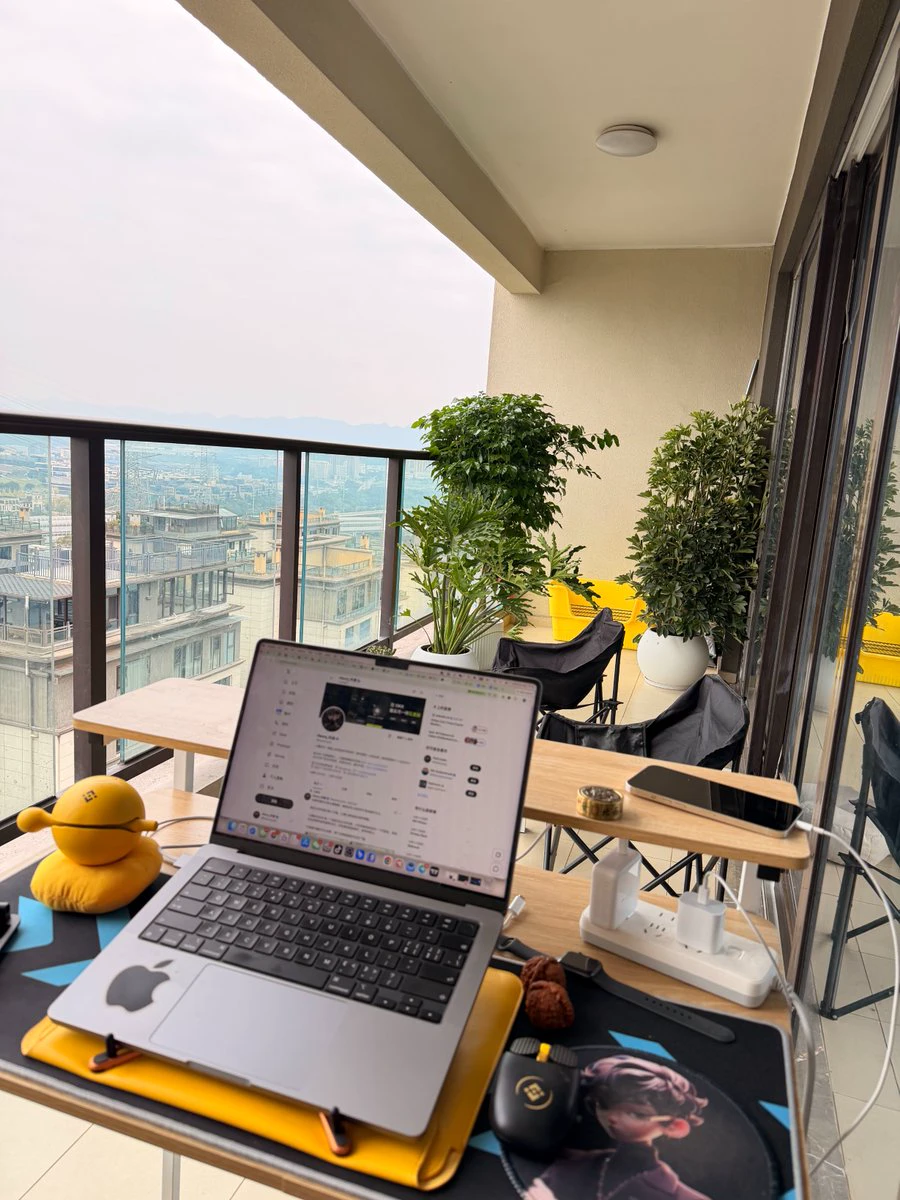
This is my work environment. What about you?
post-image
TSLAB made a strong move higher earlier on the one-hour timeframe, surging to 395.11 before quickly pulling back on heavy volume—a typical rally-driven profit-taking move. The current price is above the Supertrend indicator at 372.36, temporarily holding trend support in the short term. The market is in a corrective consolidation phase after a sharp drop, with rebound volume clearly lower than during the main rally and bullish momentum weakening.
The order book shows heavy selling pressure around 388. The 24-hour high-low range forms a short-term box, while BTC market sentiment is highly volat
post-image
BTC-1.25%
ETH-1.38%
🔹Musk Explores a Potential SpaceX-Tesla Merger! Could Combining the Two Giants Reshape the Future o
live-cover
LIVE2,436
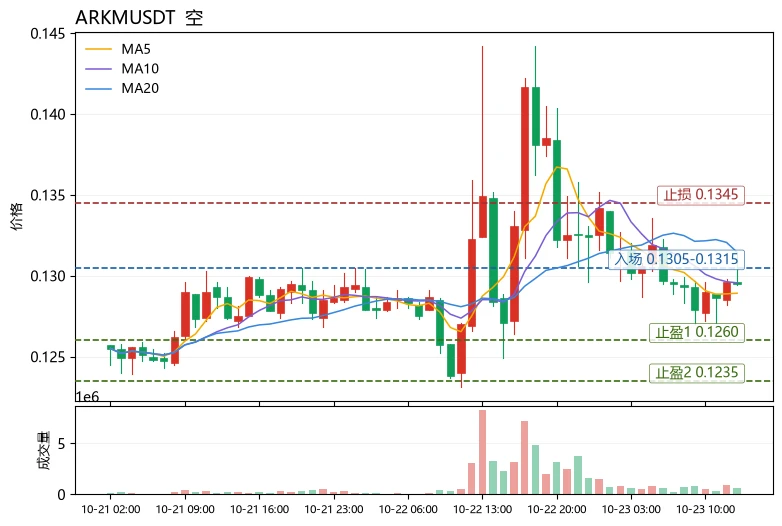
$ARKM Conclusion first: bearish; a rebound is an opportunity to reduce positions, not a reason to add. Volatility is currently elevated (the 30-candle range is about 16.29%), while the price at 0.1295 remains below MA20=0.13145, and MA5=0.12892 is also below MA20, making the moving-average structure bearish. RSI=47.9 is in neutral territory, offering no oversold-rebound cushion, and the MACD histogram at -0.0004112 indicates continued bearish momentum. More importantly, the funding rate is +0.0025%, with longs still paying to hold positions, indicating that the risk of a long squeeze has not
post-image
ARKM-5.42%
QNT-3.83%
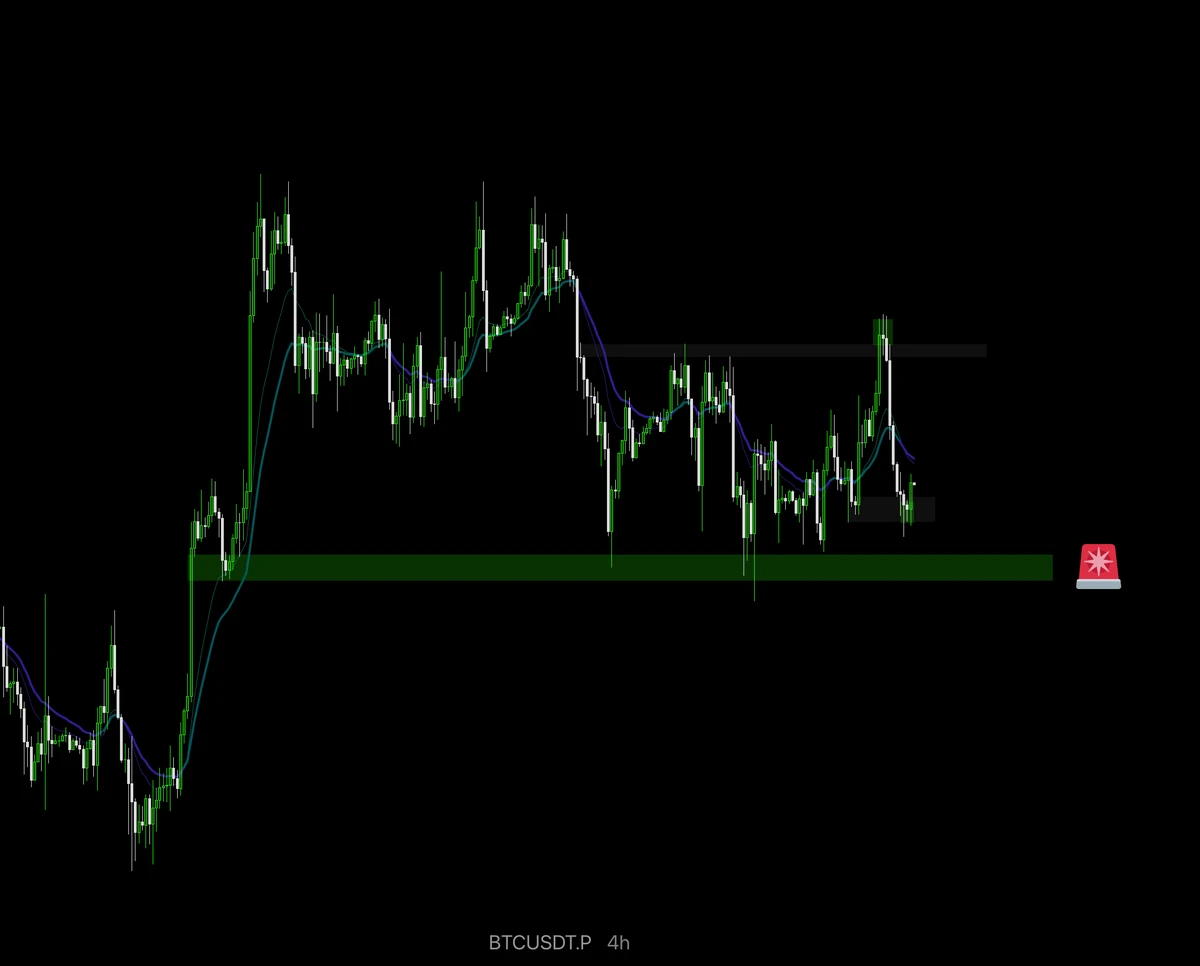
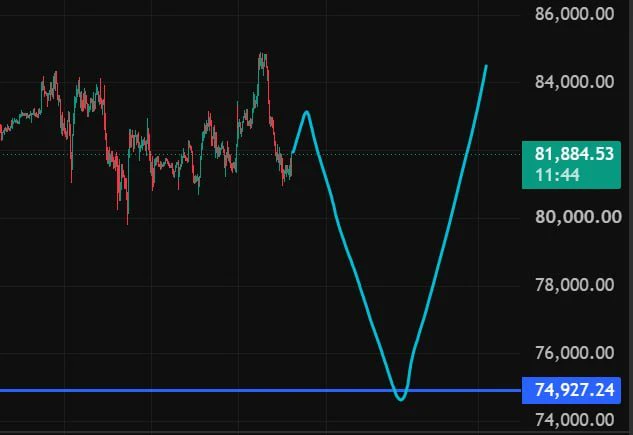
📉 $BTC Oscillating and pulling back near 81800, 4H candles remain bearish
The broader market pulled back yesterday; the rebound has run its course = an opportunity to short at higher levels⚠️
🔑 Key levels:
• 81000 offers brief support; a weak rebound is possible
• 82500-83000 is the zone to short; don't chase the rally
• 75000-76000 is the medium- to long-term long-entry zone
💡 Trading approach: The weekend rebound is weak; wait for a breakdown before entering. Prioritize ETH, which has a wider range. Consider altcoins only after they have fallen enough.
#BTC #ETH
post-image
BTC-1.25%
ETH-1.38%
$AGT I wonder which rich man's idiot son pumped this junk coin. It doesn't even have spot trading. 😓 actually staged a last-ditch rebound, then got slammed and plunged straight down.
post-image
AGT+18.47%
  • 3
Shrimp cakes are 5 yuan each. Is that expensive?
post-image
Load More

Join 40 M users in our growing community

⚡️ Join 40 M users in the crypto craze discussion

💬 Engage with your favorite top creators

👍 See what interests you

Trending Topics

USEarningsSeason

1.88k Views2.63k Discussing

The U.S. Q3 earnings season is in full swing, with major tech companies including Tesla and Meta reporting results. Market focus is shifting beyond revenue and profit toward AI spending, capital expenditure, margins and forward guidance. Which company’s earnings are you watching most closely?

GateWCTCS9GlobalTradingCompetition

392.95k Views7.55k Discussing

BTCDropsBelow81000

32.66k Views37.9k Discussing
View More