Share crypto content and earn up to 60% commissions through content mining.
placeholder
gatefun
$DASH ‌ — BREAKOUT ACTIVE! BULLISH STRUCTURE CONFIRMED!
Dash has officially confirmed a breakout — the setup is ACTIVE. Price is holding above strong support at $41.71, with resistance at $44.99 as the next major hurdle. Momentum is sitting at a solid 70/100, and the trend is moderate but steady. Volume is confirming buyer participation, and the structure is bullish. This is a clean setup with clear levels and manageable risk.
---
What I See:
· Support: $41.71 — strong.
· Resistance: $44.99 — next target.
· Entry Zone: $42.69 – $43.25.
· Take Profit: TP1 $46.74, TP2 $48.61.
· Stop Loss: $40.4
DASH5.65%
post-image
  • Reward
  • 5
  • 1
  • Share
GasMemeKing:
Wait for a pullback to 42.7–43.2 before entering; chasing now feels uncomfortable.
View More
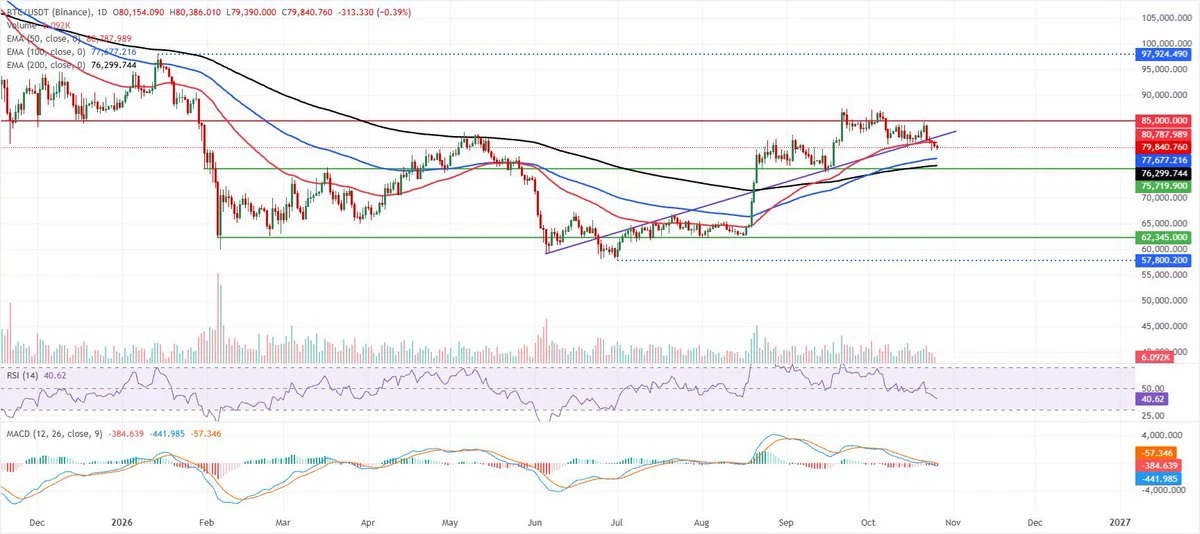
Last week’s weekly candle closed as a bearish pattern with a long upper wick, which is technically bearish. The short-term structure also confirmed that the highs are gradually moving lower, indicating that selling pressure above has not yet been fully absorbed.
However, the 77450—77000 support zone below is indeed quite solid. Previous declines to this area were bought back each time. The key point to watch during today’s U.S. session is whether this zone can hold.
If 77000 is decisively broken and even a rebound fails to reclaim this level, the probability of a completed top formation will i
BTC-1.05%
ETH-1.11%
View Original
post-image
  • Reward
  • Comment
  • Repost
  • Share
#U.S.StrikesIranBTCDips #U.S.StrikesIranBTCDips
Markets are reacting quickly as fresh geopolitical tensions between the U.S. and Iran create a wave of uncertainty. Bitcoin has dipped alongside broader risk assets, showing once again how fast sentiment can change when major global events hit the headlines.
For traders, the move is a reminder that crypto does not trade in isolation. During periods of uncertainty, investors may reduce exposure to higher-risk assets and wait for clearer signals before making new decisions.
The key now is to watch price action, trading volume, liquidity, and the wi
post-image
post-image
  • Reward
  • Comment
  • Repost
  • Share
Michael Saylor(@saylor) isn't a great trader either — always selling bitcoin:native low and buying it back high!
Over the past 2 months, he sold 6,916 bitcoin:native($429.35M) at $62,081, then bought back 4,603 bitcoin:native($369.7M) at a much higher price of $80,318.
That's an $84M loss!
BTC-1.11%
post-image
post-image
  • Reward
  • Comment
  • 1
  • Share
Liquidity finally rotated back into utility plays in August.
It was the result of different catalysts:
1/ Crypto Infrastructure: +50.8%
@chainlink institutional integrations + @LayerZero_Core’s ATLAS catalyst
2/ DeFi Lending & Yield: +34.4%
@Aave-led deposit recovery + more RWA/fixed-rate credit
3/ Exchanges & Brokers: +27.4%
Trading rebound + tokenized stocks/TradFi expansion
4/ DEX & Trading: +22.2%
@RobinhoodCrypto + @Uniswap stock volume + @HyperliquidX trading
5/ Stablecoins & RWA: +14.2%
USDC adoption + more tokenized funds and bank deposits
6/ Smart Contract Platforms: +13.6%
ETH/SOL in
post-image
  • Reward
  • Comment
  • Repost
  • Share
BTC returns to $78,000! The market rebounds after finding support, is it time to buy the dip?
gate liveLIVE
3,523
live-coin
  • Reward
  • 2
  • Repost
  • Share
FenerliBaba:
2026 GOGOGO 👊
View More
Higher vs Lower Timeframes: Which Trend Should You Trust?
Imagine Bitcoin looks strongly bullish on the 15M chart.
Higher highs.
Strong green candles.
Momentum is increasing.
You enter a Long...
Then you check the 4H chart.
Bitcoin is actually in a clear downtrend. 📉
So what happened?
Nothing unusual.
The 15M chart is simply showing a short-term move inside a larger trend.
This is called a timeframe conflict.
🔹 What Is a Timeframe Conflict?
A timeframe conflict happens when different timeframes show different market directions.
For example:
4H → Bearish
1H → Bearish
15M → Bullish
The lower
BTC-1.11%
post-image
  • Reward
  • Comment
  • Repost
  • Share
Onchain has been so hot so we've been bidding a lot of plays.
Here's a list of my gems so you don't miss any:
🔶 ROBINHOOD
➜ $WTH: Uniswap v4 hook that captures cross-pool arbitrage inside the same swap and rebates that profit to the traders and LPs who created the opportunity; basically a solution to MEV bots.
➜ $STATICS: Uniswap v4 DEX, fixed-basket, credit, and stablecoin system that lets users stake once, opt into selected assets, and earn fees from every pool those assets trade in.
➜ $HOOD10: On-chain index token, where every trade pays a tax in WETH that buys Robinhood Chain’s current to
UNI-2.28%
USDG-0.01%
USDC0.01%
post-image
  • Reward
  • Comment
  • Repost
  • Share
Tesla Optimus will be the biggest product Elon Musk and Tesla have ever created.
post-image
  • Reward
  • Comment
  • Repost
  • Share
Just a reminder for everybody that needs to hear it:
The trend is strong, momentum is strong, and there may still be a lot more upside.
But when the market gives you easy profits, take some.
The goal is to stay in the game while actually getting paid.
post-image
  • Reward
  • Comment
  • Repost
  • Share
August Traders Performance Breakdown
• 5,456,262 wallets analyzed
• Only 19.4% of wallets were profitable
• Just 1.1% of wallets generated 87.1% of all profits
Let’s break down what really happened.
August saw massive participation, but once again, the outcomes were extremely concentrated:
• 5.46M wallets were analyzed
• Only 1.06M wallets (19.4%) made any profit
• A massive 4.40M wallets (80.6%) ended in loss
So more than 4 out of every 5 traders lost money.
Now here’s where it gets really interesting.
Out of all wallets:
• Only 8,829 wallets (0.2%) made over 100 SOL
• These wallets alone gen
post-image
  • Reward
  • Comment
  • Repost
  • Share
I was just about to go to the forum and rant, but then I saw my balance and thought, forget it—the market is always right. While everyone else was fleeing, I found the overhead resistance particularly obvious. Every push upward kept falling just short, and the rebound was extremely weak, giving the shorts a signal. And how did it turn out? It really delivered, sliding rapidly downward. Opened at 17.372, watched it fall to 17.06, and pocketed +84.27%—everyone on the train should be waking up laughing. I’ve closed 70% of the position for now and moved the protection on the remaining 30% upward,
LAB-18.89%
DOGE-3.59%
View Original
post-image
  • Reward
  • Comment
  • Repost
  • Share
That’s enough for August
Absolutely terrible, but at least BSC is green now
When will I finally break even?
View Original
post-image
  • Reward
  • Comment
  • Repost
  • Share
My deeper tweets hardly get any engagement because people don't want to hear the truth
Of course they love it when I post green candles or bullish charts
Ironically those are my least important tweets
When Uale shortcuts in life U will always suffer on the back end..
$btc
BTC-1.11%
post-image
  • Reward
  • Comment
  • Repost
  • Share
No big-picture perspective, can’t hold on—these profits are as thin as paper, but I love them. I had my eye on it as it repeatedly oscillated intraday: every push higher fell just short, and no one was there to take it higher. This price action plainly had all the hallmarks of a bull trap. While everyone else was running, I stayed calm: no buying the pullback, no trading the rebound, just waiting for it to buckle under its own weight. I had just finished lunch and checked the chart when the price plunged straight from 0.03656 to 0.0254. I timed the short position perfectly and pocketed +1468.7
SOL-4.07%
ETH-1.11%
View Original
post-image
  • Reward
  • Comment
  • Repost
  • Share
This afternoon I made it very clear: sell the rebound and boldly go short at 78500—no need to hesitate. The logic is all laid out here, solely to show everyone what is real!
Looking back now, wasn’t it perfectly validated? From entry to take-profit, there was 660 points of room, achieved in one move.
$BTC #美军袭击伊朗BTC下挫
BTC-1.11%
View Original
post-image
post-image
post-image
  • Reward
  • Comment
  • Repost
  • Share
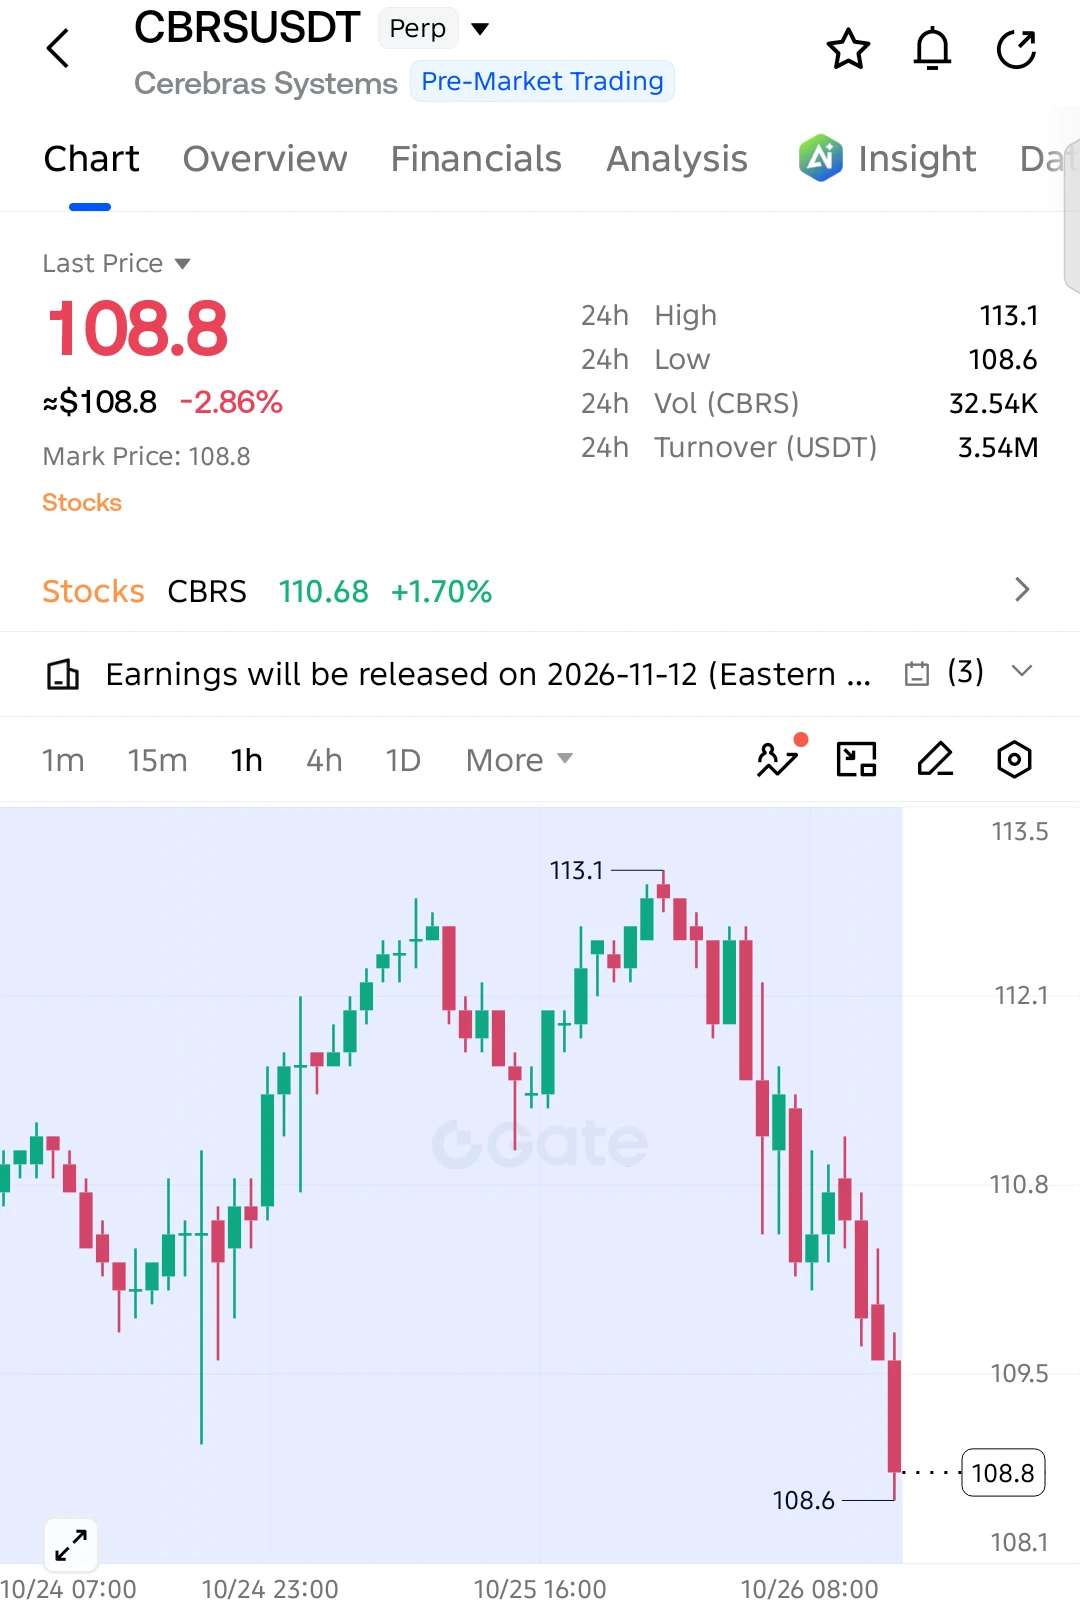
The most comfortable position for shorting is not after the drop has already occurred, but when a rebound runs into resistance at a key level. After this breakdown, the rebound never reclaimed the trendline, and the key resistance levels kept getting lower, maintaining a relatively intact bearish trend.

The entry was set at 108.01, with a very simple rationale: the rebound faced pressure near the trendline, and several attempts were pushed back. Short-term bears had the upper hand, so shorting in line with the key levels was much steadier than trying to guess the bottom. After entry, the mar
ADA-5.13%
DOGE-3.59%
View Original
post-image
  • Reward
  • Comment
  • Repost
  • Share
Load More

Join 40 M users in our growing community

⚡️ Join 40 M users in the crypto craze discussion
💬 Engage with your favorite top creators
👍 See what interests you
  • Pinned