Square
Following
Hot
News
Profile
Share your thoughts
placeholder
Article
$ARIA Longs are back... still room to rise$ARIA The 1-hour chart shows strong bullish momentum. Price has decisively broken above the previous consolidation range, signaling renewed buying pressure. Buyers are gradually taking control, and the next move could be higher. Long entry: $0.0875–$0.0885 Take profit: $0.0915 Stop loss: $0.0860 Buy and trade $ARIA
post-image
ARIA+22.03%
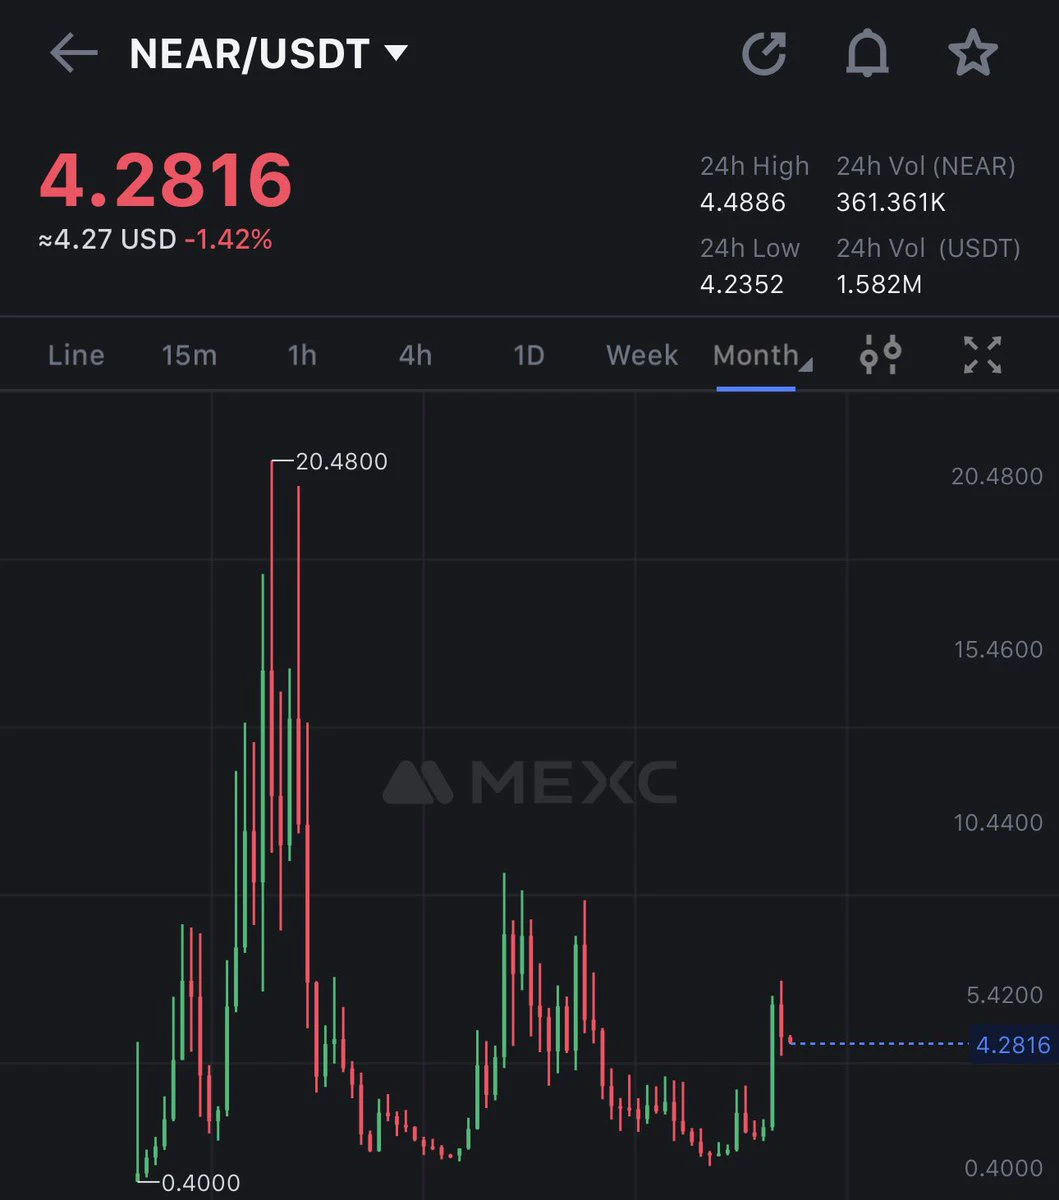
Can near:native hit a new ATH or possibly 100 billion MC?
post-image
Trenches
ZIG
Z
bade
b
ZIG
0x8c...1145
Market Cap
$.
Change
.
24h Vol
$.
Holders
.
KIM
K
bade
b
KIM
8pjf...pump
Market Cap
$.
Change
.
24h Vol
$.
Holders
.
Anakin
A
bade
b
Anakin
Exxz...pump
Market Cap
$.
Change
.
24h Vol
$.
Holders
.
IDOL
I
bade
b
IDOL
0x3b...ab07
Market Cap
$.
Change
.
24h Vol
$.
Holders
.
BTC
B
bade
b
BTC
C5xp...pump
Market Cap
$.
Change
.
24h Vol
$.
Holders
.
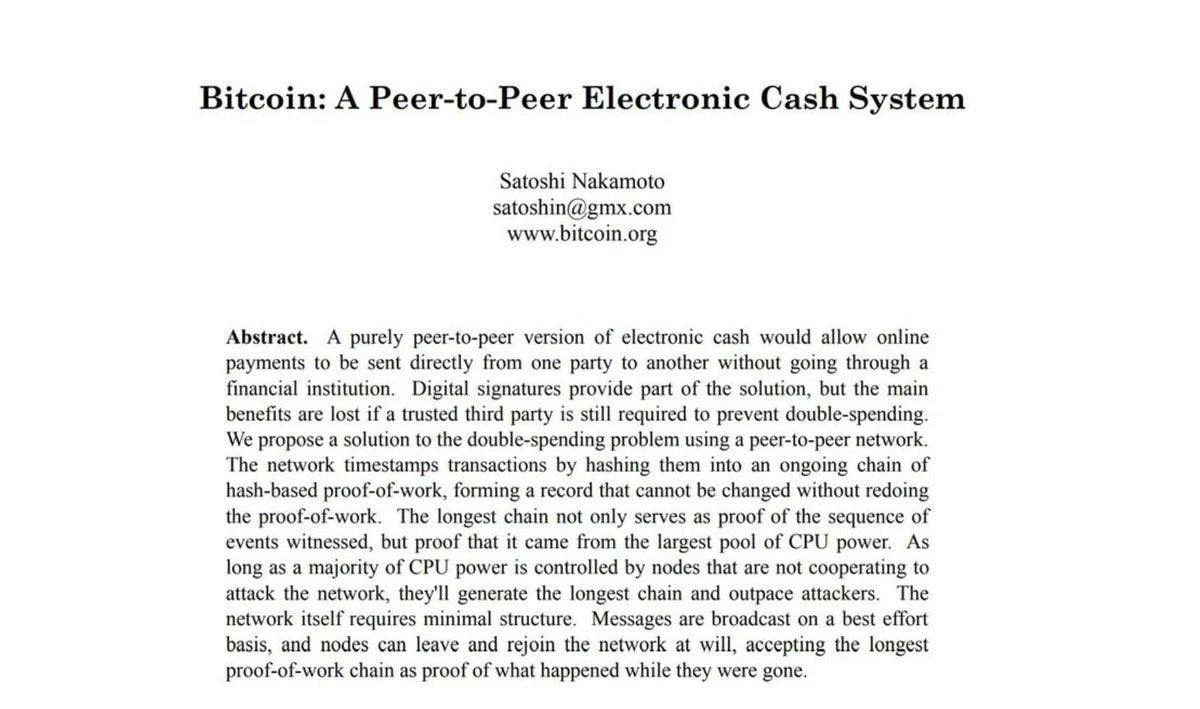
🪙 18 years ago, on October 31, 2008, it was published Whitepaper Bitcoin by Satoshi Nakamoto.
In a nine-page white paper titled «A Peer-to-Peer Electronic Cash System» described the principle of operation of a peer-to-peer payment system, which subsequently made a real revolution in the world of financial technologies
#StrategySTRCNears100ParValue $BTC
post-image
BTC-0.67%
  • 1
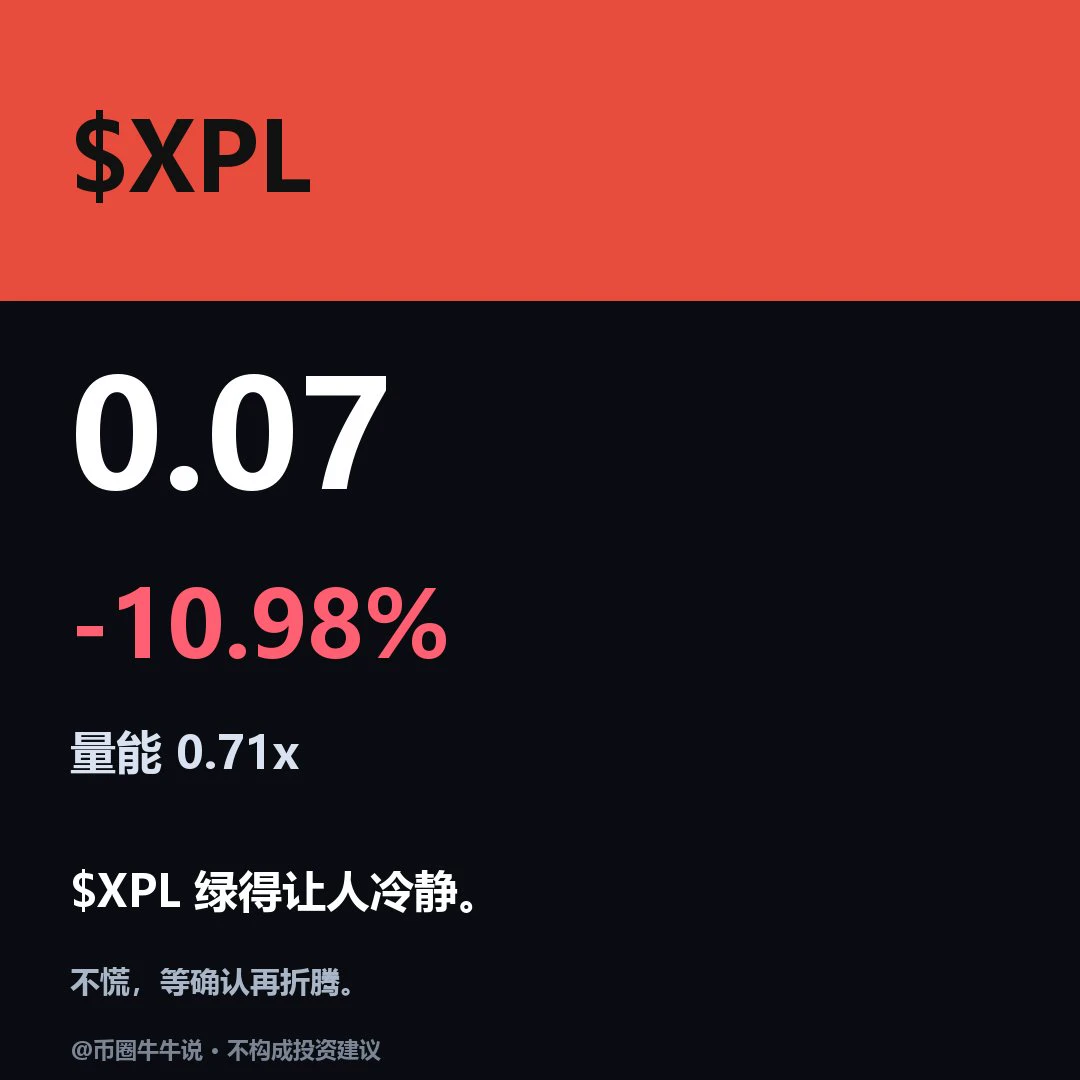
$XPL is currently trading at 0.0715, down 10.98% over 24H. The 1H oversold and weak signal (RSI 41.1) and the 4H weak signal (RSI 42.6) are aligned to the downside. If it holds above the 0.08639 resistance, a rebound may be worth watching; if it breaks below the 0.06903 support, it could move lower. Going forward, watch whether it can hold above resistance and reclaim support after a breakdown. Market volatility is high; for observation only.
post-image
XPL-0.60%
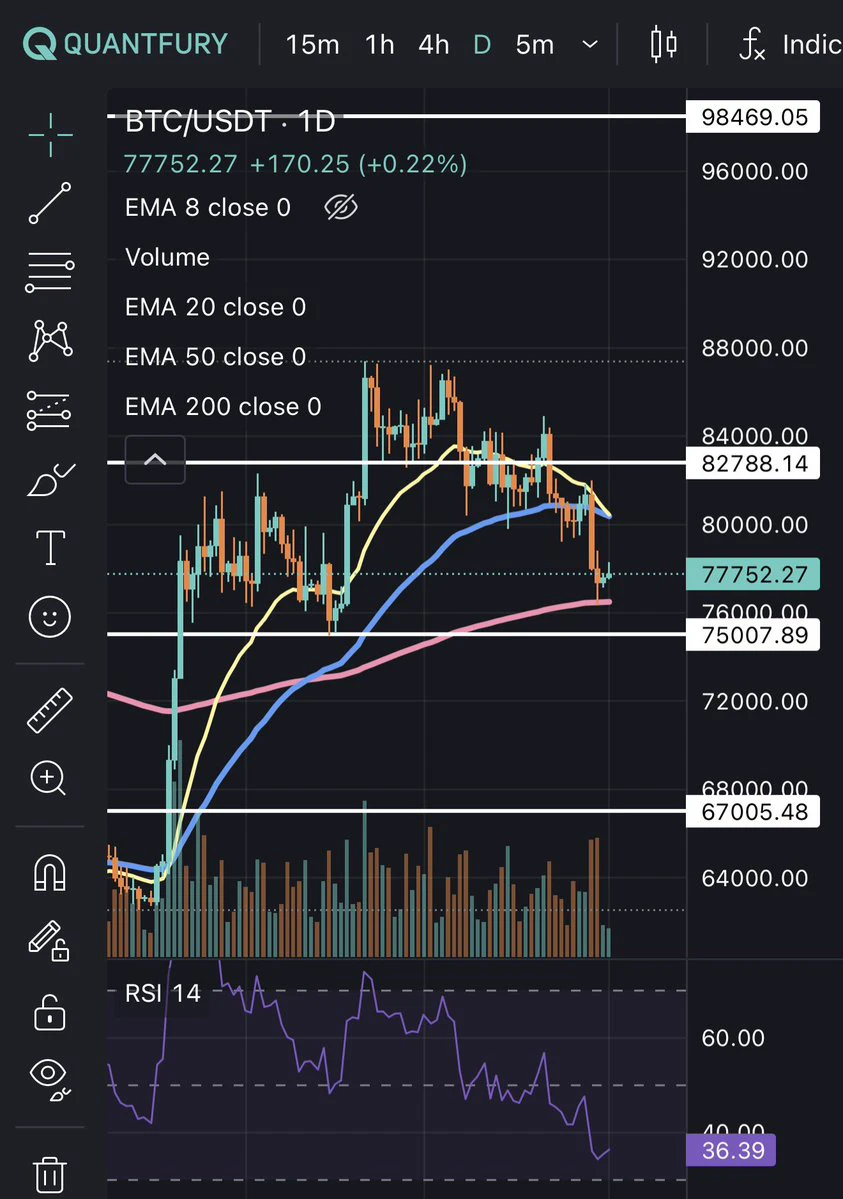
#Bitcoin It lost the 50-day moving average (blue). Next is the 200-day moving average (lilac). This also runs through 76,000.
Losing 76,000 would not be good.
It needs to reclaim the 50-day average, namely 80,000, for the market to turn.
#BTC bitcoin:native
post-image
BTC-0.67%
Went long on altcoins ta, xpin, based, lyn, etc. Will see how they perform in a few days. Still short BTC and ETH. $TA T​A​U​S​D​T0.06 perpetual +1.96% ‌$BASED $LYN #山寨币 #比特周周 $TA $BTC $ETH
post-image
TA+10.43%
BTC-0.65%
ETH-1.23%
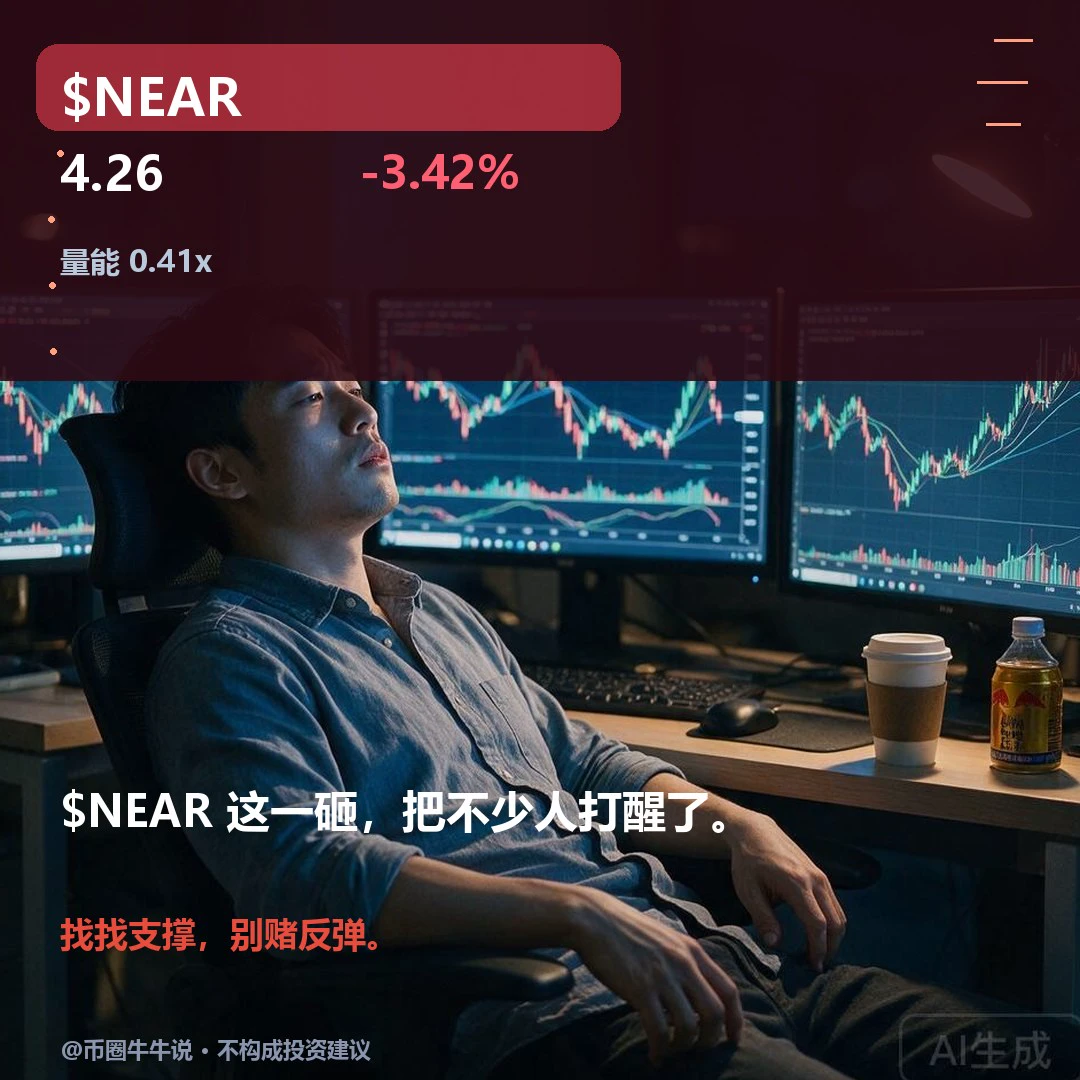
Weak, $NEAR current price 4.265. Oversold conditions have emerged on the hourly chart, but the four-hour trend is also weak. This is not a bottom signal; it looks more like a breather during a decline. The intraday low of 4.236 is just a step away, yet there is no stronger evidence of buying support. If being oversold could automatically stop a decline, why is the price still hovering near the low? Demand for a rebound is growing, but until the trend stops weakening, I won’t call oversold conditions a bottom. A break below 4.236 would confirm weakness; reclaiming and holding above intraday res
post-image
Detected a Korean actress automatically sending a chaebol.
post-image
[New Streamer] Whales Moves in Sync!
live-cover
LIVE2,063
#黄金突破 #XAU Gold CFD scalping➕ trend➕ swing trading, gold contract trend➕ swing trading, ETH trend and swing trading, popular mainstream assets, U.S. stock contract trend and swing trading. Every day in the livestream room, find like-minded full-time traders to watch the market and choose assets together,
PAXG+0.33%
XAU+0.38%
It's hard to imagine a human came up with this.
post-image
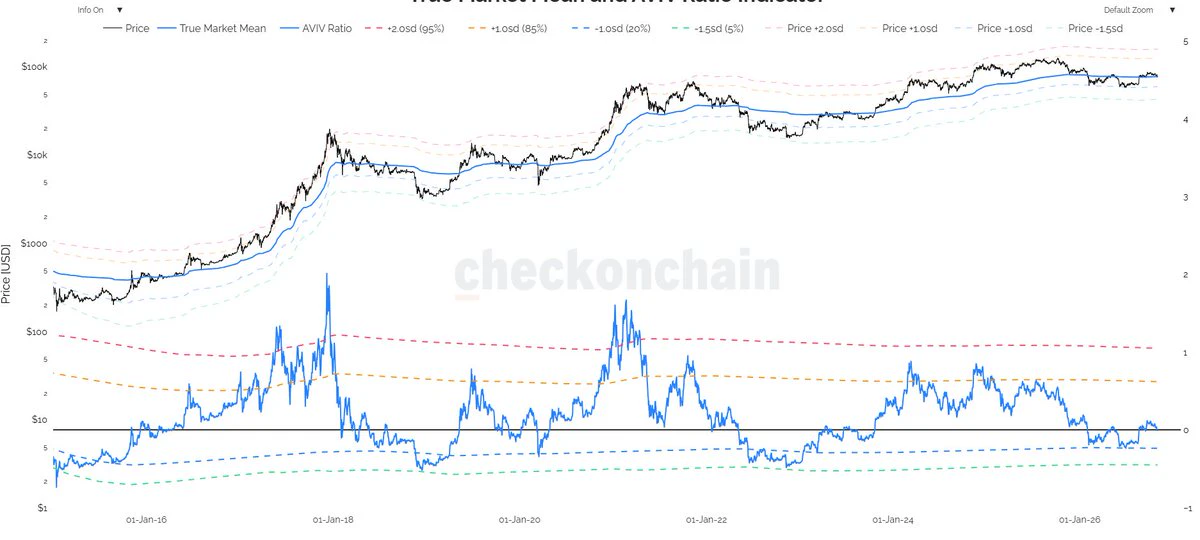
$BTC is right at the True Mean.
You know what to do 🫡
post-image
BTC-0.67%
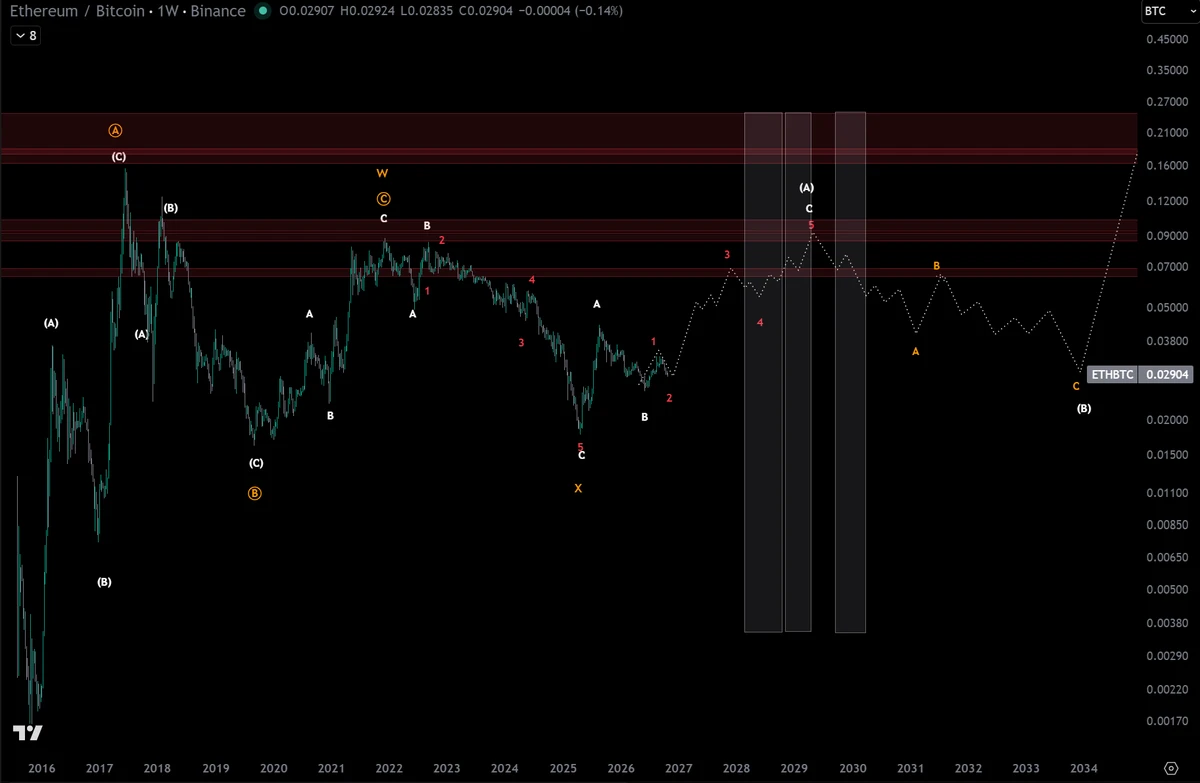
$ETHBTC
I've had too many interpretations of this but consolidating my thoughts on it here.
The entirety of the move has been corrective in nature. It's actually more helpful to look at it upside down - 2nd screen shot.
Time based fib areas should be taken with a grain of salt. It's assuming that this run goes on until 2029 - I'm currently not of that view - but happy to be wrong about it.
Good Luck Degen.
post-image
Solana Expands Ecosystem, Can ONDO Break Back Above $0.50?
ONDO Rises 5.5% Amid a Wave of Expansion Moves
Ondo Finance’s ONDO token rose about 5.5% in 24 hours, making it one of the market’s notable altcoin gainers. The momentum came as Ondo continued expanding its tokenized real-world asset products.
⚠️ Personal market analysis only. NFA — manage risk and DYOR.
Educational content, not investment advice or a recommendation to buy, sell, deposit, or withdraw any asset. No paid promotion or referral/affiliate links.
post-image
SOL-0.77%
ONDO-0.29%
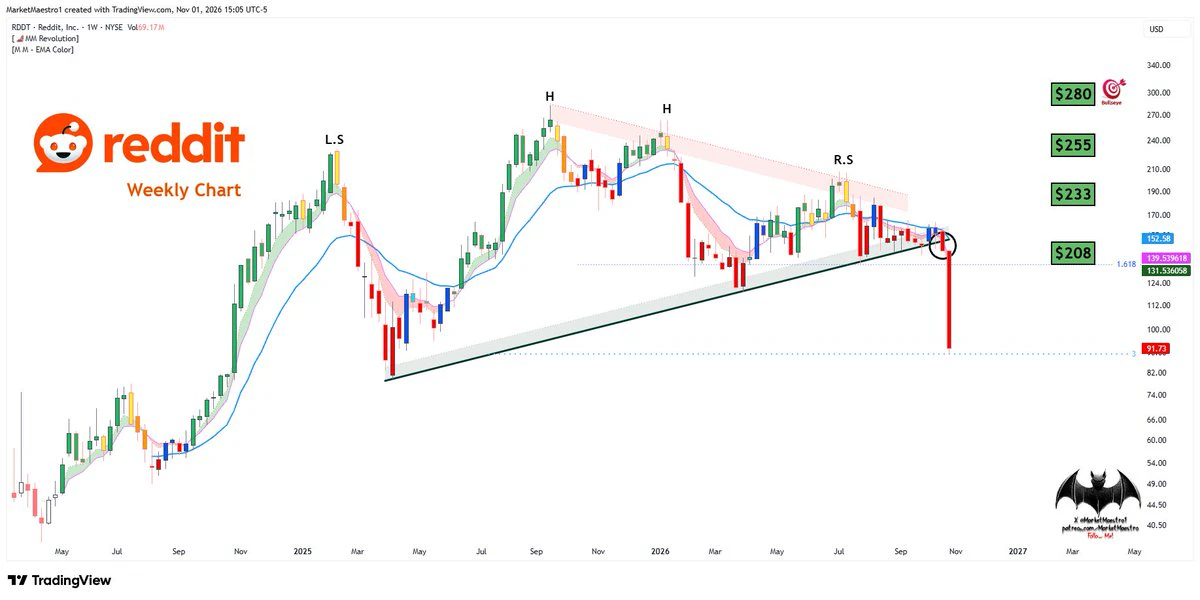
$RDDT
Unfortunately, the bigger picture is now H+S. The week of Oct 19 was the week to stop out after the breakdown
post-image
RDDT-29.36%
$PONS ‌ is trading close to its lows, but could this quiet phase be setting up a recovery?
The chart shows a prolonged decline from $0.7781, with price now hovering around $0.2367 after recently testing $0.2160.
There is some stabilization, but the bigger trend remains bearish with the daily Supertrend still sitting well above price at $0.3509.
Key levels to watch:
Support: $0.2263 to $0.2160
Resistance: $0.2484
Major resistance: $0.3509
A break above $0.2484 would be the first positive sign. Reclaiming $0.3509 would make the recovery structure much more convincing.
PONS needs to show buyers
PONS+4.32%
INTC-28.49%
  • 3
  • 2
looks like $EVAA $EVAA is finally trying to put a floor in after that ugly drop. is there actually enough gas left in the tank to pull off a decent bounce here, or are we just waiting for the next rug?TP: 1.2850SL: 1.1458Hot coins:
$LYN : Current Price 0.01791 - 24h Change: +24.98%
$SOL : Current Price 94 - 24h Change: -1.88%
post-image
EVAA-0.49%
LYN-0.44%
SOL-0.77%
everything is crashing:
meanwhile in mar a lago:
post-image
#BTC大跌
The October monthly candle closed in the red: a drop from ~$83,556 to ~$77,424 (-7.3%). This marks the weakest October since at least 2016, setting a cautious tone for November, which is historically unpredictable (closing green 5 out of 10 years, and red the other 5).
📊 Technical Overview by Timeframe
· Monthly (1M): The price is at the lower Bollinger Band (LB ~$51,917) but remains above it. MACD is in negative territory, and the histogram is shrinking — selling pressure is weakening, but there is no reversal yet.
· Weekly (1W): The price is between the middle and lower bands (MB ~$
BTC-0.67%
  • 10
Zec market update
live-cover
LIVE2,294
Load More

Join 40 M users in our growing community

⚡️ Join 40 M users in the crypto craze discussion

💬 Engage with your favorite top creators

👍 See what interests you

Trending Topics

BTC大跌

515.45k Views39.92k Discussing

$BTC briefly fell below $77,000 and remains under pressure around the $77K zone, with its 24-hour decline still above 4%. With risk appetite weakening and Fed uncertainty rising, where is the next key support after losing $80K?

IntelBeatsEarningsButStockPlunges

48.6k Views1.09k Discussing

StrategySTRCNears100ParValue

57k Views4.22k Discussing

View More