Square
Following
Hot
News
Notifications
Profile
Share your thoughts
placeholder
Article
#下周PCE与GDP数据将揭晓 Next week's PCE and GDP arrive together: watch these three columns for the rate-hike path

On Nov 25 at 21:30, US PCE, revised GDP, and personal spending are released simultaneously. There is little suspense over the direction of rate hikes; the focus is on the magnitude and path. Just watch these three columns: prices, growth, and asset correlations.

I. Information to watch
Next week has a set of data worth marking on the calendar in advance. According to CLS's investment calendar, on Nov 25 at 21:30, the US October Personal Consumption Expenditures Price Index, the revised a
USIDX-0.09%
$XMR :A Key Reclaim to Watch

Monero is testing an important horizontal resistance zone around $490–$505, an area that previously served as support.

The key level to watch is a confirmed daily close above this zone. A successful reclaim could shift market structure in favor of buyers and open the door for a move towards higher levels.

I'm not rushing into a long here. Waiting for confirmation is more important than anticipating the breakout.

Let price prove the move first.

#BTCReboundFaces60KTest
post-image
XMR+0.00%
Trenches
PIEVERSE
P
bade
b
PIEVERSE
0x0e...25a9
Market Cap
$
Change
.
24h Vol
$.
Holders
.
IDOL
I
bade
b
IDOL
0x3b...ab07
Market Cap
$.
Change
.
24h Vol
$.
Holders
.
JAGENT
J
bade
b
JAGENT
0x8e...ae15
Market Cap
$.
Change
.
24h Vol
$.
Holders
.
Singularity
S
bade
b
Singularity
7R4M...pump
Market Cap
$.
Change
.
24h Vol
$.
Holders
.
mihao
m
bade
b
mihao
4Cxj...pump
Market Cap
$.
Change
.
24h Vol
$.
Holders
.
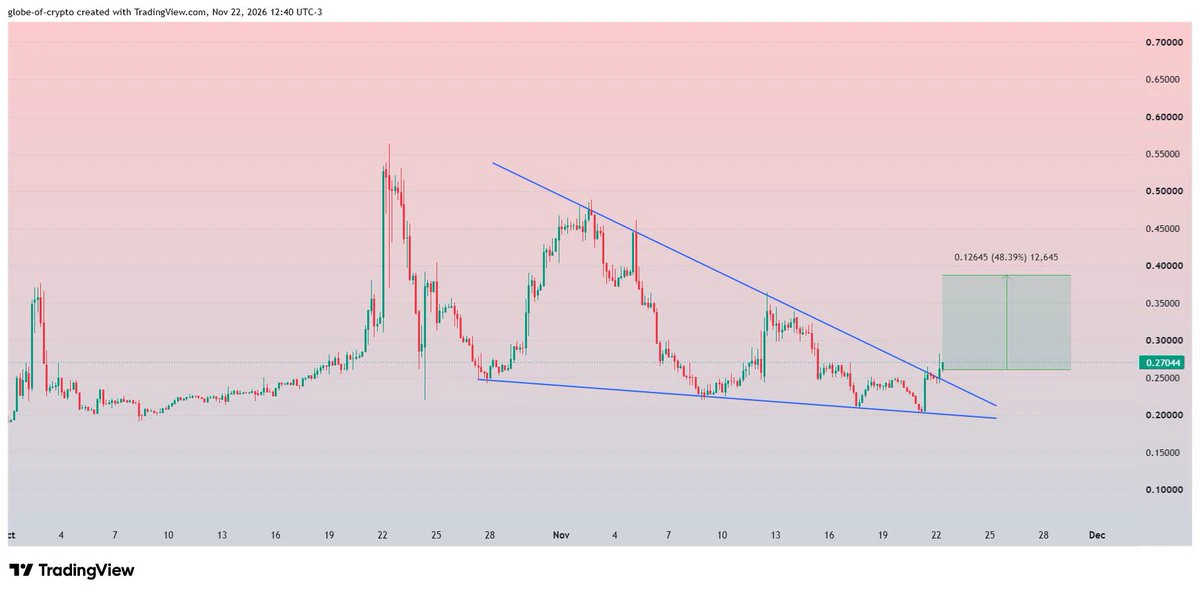
$MAGMA #MAGMA
Broken Falling Wedge on 4H Chart.
If holds momentum, 45-50% rise is expected during coming sessions ✍️
post-image
MAGMA-0.57%
Far from over. Lock tf in.
post-image
  • 1
$NEAR Is Near 3.06 Resistance; Holding Above It After a Breakout Is Key

Currently, $NEAR is priced at 2.996, up 4.902% over the past 24 hours. The intraday high is 3.06, and the low is 2.832. The 1-hour chart shows strength: the price has broken above the 1-hour EMA20 at 2.9415, and the RSI14 is 71.79, nearing overbought territory. The price has touched the 1-hour resistance at 3.06, but whether it can hold above this level and continue rising is key.

The 4-hour chart also shows strength, with the price slightly above the 4-hour EMA20 at 2.9691, though still some distance from the 4-hour res
post-image
Making money is this easy—short these two coins with me $EDGE – 0.10$ELSA – 0.035. Huge profits are coming
post-image
EDGE-7.65%
ELSA+5.80%
#Gate股票畅聊季 A Logical Breakdown of the Deep Correction in U.S. AI Stocks: Panic Pricing, Expectations Mismatch, and Diverging Long-Term Value

The U.S. stock market has recently experienced sharp volatility. Over the past 45 days, the S&P 500 and core AI assets have suffered significant pullbacks, with market capitalization losses reaching as much as $6 trillion. Market sentiment is currently at an extreme fear level. Drawing on recent market conditions and the perspectives of leading institutions, this report breaks down the four core factors behind the latest selloff: AI capital expenditure,
US500-3.01%
AMZN-3.90%
GOOGL-2.50%
MSFT-2.61%
NVDA-13.84%
DODOX | Long 🟢 | Bullish | 15-minute 24-hour change: +2.29% | Volume: 44.0M USDT
Long rationale: Price is above EMA200; EMA20/50/200 are in bullish alignment; RSI14 is 60.7; MACD histogram is positive; ADX14 is 29.2; volume is 0.55x the 20-candle average; trend pullback/continuation. Entry: 0.039528 Stop-loss: 0.0377965 Take-profit 1: 0.0416924 | Take-profit 2: 0.042991 | Take-profit 3: 0.0447225
Entry price is for reference only; do not chase the price. The strategy is invalidated if the stop-loss level is hit. Technical analysis only; this is not investment advice. $DODOX
post-image
DODOX
DODOXDODOX
Pump.Fun
MC:$2.22KHolders:87
32.76%
All correct
You have absolutely no shame whatsoever
$ANT Many people aren’t familiar with the rules for new U.S. stock listings, so here’s a quick explanation: 1. Price-support mechanism: Excess shares issued are bought back at the offering price. The IPO price was 83, and the portion representing more than $10 billion in oversold shares was bought back at 83. That means the offering-price support is no longer in place. 2. Short selling and securities lending in the U.S. stock market: Shares are not lent out until after 30 trading days. There aren’t many short sellers at this stage, and short selling is mostly limited to shares lent out by a sm
post-image
ANT-8.68%
SPCX-7.38%
2026.11.23
Daily entry point: 1717
Resistance levels above: 1724-1732-1742-1748-1757-1770-1782
1790-1800-1816
Support levels below: 1710-1700-1690-1680-1667
1665-1656-1647-1627-1617-1600-1536
If support/resistance levels hold, follow the trend; otherwise, play the rebound. Pay special attention to ⚠️1732-1689-1634-1536. Personal advice for reference only! #Gate直通IPO第三期ANT配售92100股 $ETH
ETH-1.23%
$NVDA
One of the greatest assets in the market is presenting an interesting technical setup.
After seven consecutive bearish weekly candles, price is now trading into several significant higher-timeframe levels, including the monthly 50 MA, the 200-week MA and the 0.786 Fib.
In my opinion, this is precisely the type of opportunity sidelined capital should be paying close attention to. I’ll certainly be watching closely myself.
However, confirmation is key. Should these levels fail to hold, the potential for a relief bounce becomes invalidated, opening the door for further downside. At that po
NVDA-13.84%
  • 1
X renowned trader mk4 closed out BTC short positions, capturing nearly $7,000 drop
live-cover
LIVE1,586
MU-13.88%
AAPL-1.83%
TSLA-7.56%
SPCX-7.38%
NVDA-13.84%
$SNDK A rebound in U.S. stocks next week will lift the AI and crypto sectors! If SanDisk holds at 83, it will head to 85, then 88! Anyone without a position can go long now!
post-image
SNDK-0.18%
CRYPTO MARKET TRENDS
live-cover
LIVE1,317
ETH-1.26%
BTC-0.67%
Yesterday, BTC's $55,000 level was basically calculated based on the $58,000 level and the liquidation of 20x long positions.
The 20x liquidation level for $58,000 is $55,100; in low-volatility conditions, it should basically also be calculated according to the liquidation level.
$58,000,
the 10x liquidation level is $52,200;
the 20x liquidation level is $55,100;
at the same time, the 2x liquidation level for $58,000 happens to be $87,000;
These are all just coincidences; the key levels in between need to be determined using many references.
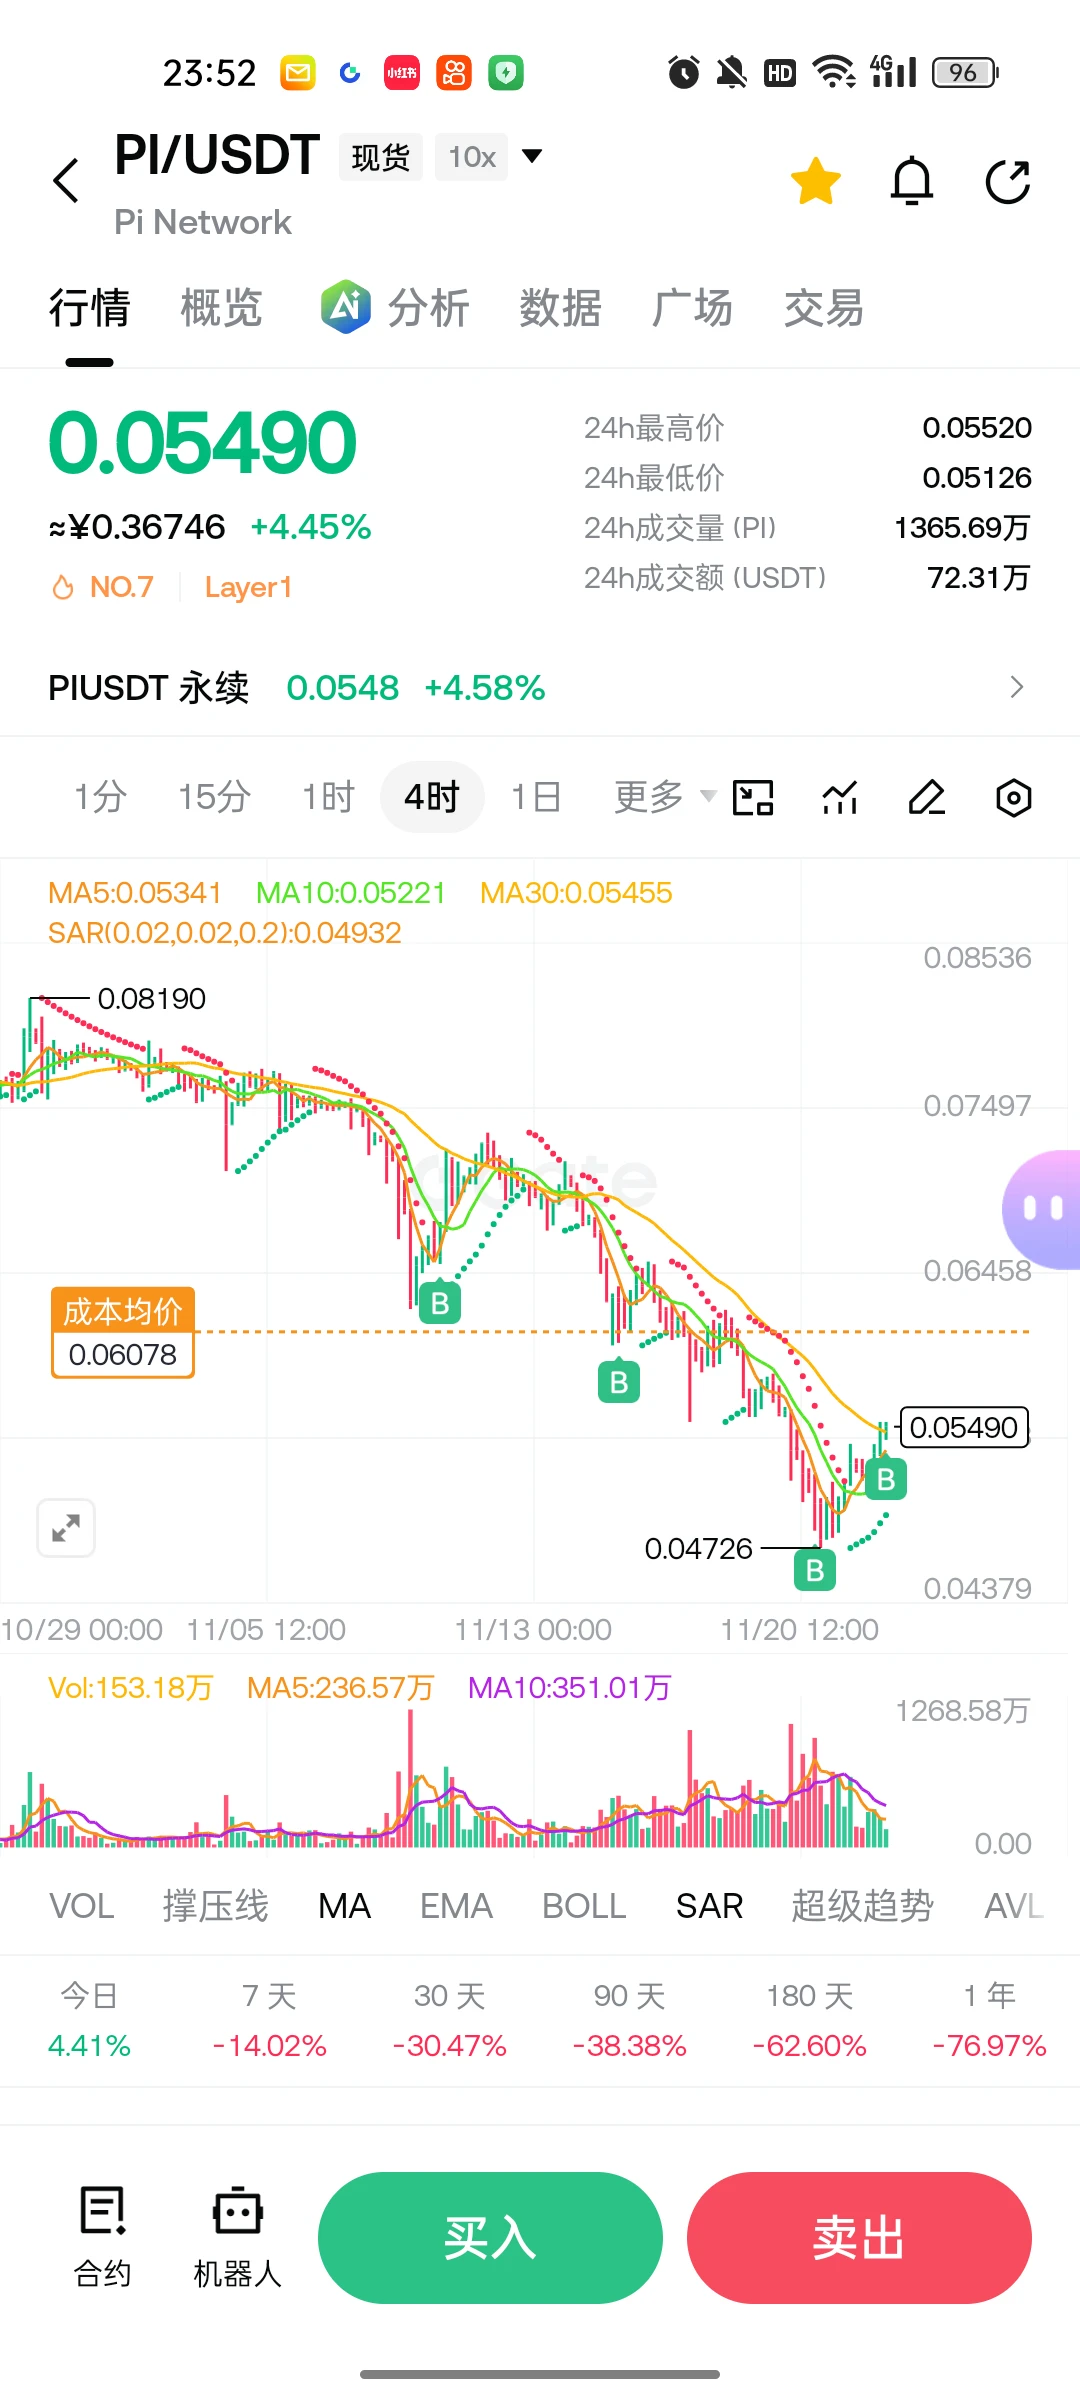
$PI Fuck it, just do it, play! I never regret any password I’ve entered
post-image
PI-0.60%
  • 1
$BTC Is this move really about to turn upward? I just saw that Aoying added another $580,000 BTC long position on an exchange, with an average entry price around 60650.

Including the $500,000 long position from noon today, this guy now has $1.08 million in BTC longs. The strangest part is that he’s usually been all-in on short positions, but today he switched things up and chased into a long after the rally. It looks like he probably expects a decent rebound this time around, so the right-side signal seems confirmed.
But let’s be clear: Aoying has been caught out before. Follow his trades if
post-image
BTC-0.65%
Load More

Join 40 M users in our growing community

⚡️ Join 40 M users in the crypto craze discussion

💬 Engage with your favorite top creators

👍 See what interests you

Trending Topics

BTCReboundFaces60KTest

2.1M Views30.1K Discussing

BTC rebounded from around $55,300 on November 21, briefly reclaiming $60,000 before pulling back to around $59,300. The $60K level is back in focus as traders assess whether the recovery can last. Is this rebound a sign of stabilization or a short-lived recovery? Would reclaiming and holding $60K be enough, or do you need confirmation from trading volume and fund flows?

PCEAndGDPDataNextWeek

260K Views2.6K Discussing

GateDirectIPOPhase3ANTAllocates92100Shares

845.6K Views5.1K Discussing

View More