
Share your thoughts
placeholder
Article
Everyone watching the daily trend is about to get blindsided by a hidden short setup.

$H /USDT - SHORT

Trade Plan:
Entry: 0.08002 – 0.08062
SL: 0.08319
TP1: 0.07817
TP2: 0.07673
TP3: 0.07458

Why this setup?
Why now? The 1h price is sitting at 0.08032 inside a defined entry zone between 0.08002 and 0.08062, while the 15m RSI at 70.34 signals exhausted momentum, not a continuation. The 1h ATR of 0.001195 confirms enough volatility to push toward the first target at 0.07817, with a deeper move to the second target at 0.07673 if the bearish daily trend holds. The invalidation level at 0.0785
H+5.55%
Is there a way to achieve stable returns when investing in the stock market?
For example, buy shares in domestic listed companies modeled on Berkshire’s top ten holdings.
If they generate just 20% returns every year, wouldn’t that make you a Chinese Buffett?
The comparisons in the image below are mainly for reference in terms of business models, industry positions, and other aspects.
The national conditions are different, and market valuations are also different.
This is only intended as a stock-selection idea, not investment advice.
By studying Buffett’s ideas and methods, everyone will have
post-image
U.S. stocks officially opened, with the market showing a mixed performance. The Dow fell 0.7%, the S&P 500 edged down 0.1%, while the Nasdaq rose 0.08% against the trend, with clear divergence in performance across sectors.
Positive catalysts were concentrated among individual stocks:
Qualcomm QCOM surged 5% after officially announcing a deep, multigenerational product partnership with Amazon, boosting business expectations;
Intel INTC strengthened and rallied 6% amid market reports that prices for its CPU products would be raised another 10%;
ASML, the semiconductor equipment leader, rose 3.8
BTC-0.94%
This $CHIP short position played out quite comfortably. After entering around 0.05369, there was basically no major pullback, making it a typical one-sided downward grind. The short setup was simple: after a high-level wick, the short-term moving averages began pressing downward, while key rebound levels gradually moved lower, so I followed the trend for a move.
The most difficult decision along the way was whether to exit early, since some profits had already been given back once. This time, I allowed the price less room to pull back; as long as it did not break through my breakeven protectio
post-image
CHIP+1.18%
ADA-0.36%
SNDK-0.34%
Five consecutive intraday wins, went long at 4396 and exited at 4403, 1400🔪
Go with the trend and maintain proper defense; profits will naturally come easily! $XAU
XAU-0.50%
Bitcoin miners are selling even harder than last week, which on the surface looks bearish.
But $BTC is still holding up while that supply hits the market.
Even with miners adding real sell pressure, buyers are absorbing it without letting the price break down.
So while miner distribution remains a short-term headwind, the way $BTC is handling it is actually a strong sign of underlying demand.
post-image
BTC-0.77%
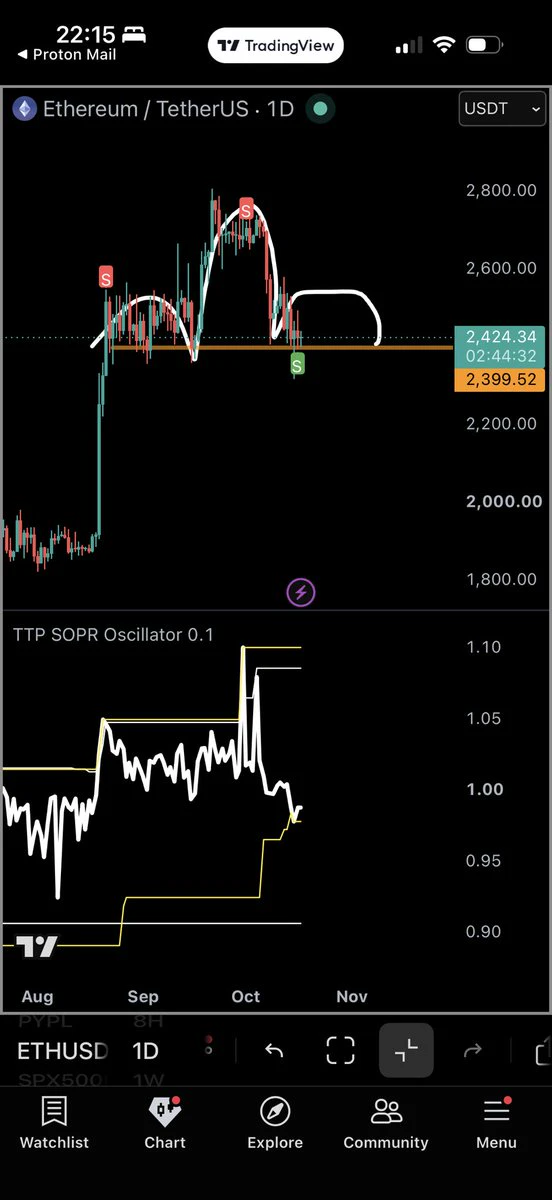
Shorted BTC and ETH—double harvest today.
2493→2442, 51 points captured
The shorting strategy was provided in advance; all that’s left is counting the money. $ETH #Gate全球首发股票事件合约
ETH-0.27%
[New Streamer ] Whales Move in Sync!
live-cover
LIVE2,582
I didn’t expect it to survive, but it took it straight to breakeven. The service was incredibly on point.

While everyone was still watching from the sidelines, I saw $BTC stabilize after pulling back to 63014.1. There was no volume on the dip, and it was bottoming without breaking support, so I suggested going long first. Some people thought it was too early—fine, let the candlesticks give them the answer.

The market has now climbed to 78377.4, delivering +4240.12% in unrealized profit. The wait wasn’t for nothing, right?

The plan was set long ago: pocket 75% first, and move the defensiv
post-image
BTC-0.94%
ETH-0.27%
BNB+0.90%
Insiders are calling this the quiet setup before NEAR makes its move.

$NEAR /USDT - LONG

Trade Plan:
Entry: 2.2803 – 2.3019
SL: 2.1875
TP1: 2.3688
TP2: 2.4206
TP3: 2.4983

Why this setup?
Why now? The daily trend is bullish and the 1h price is sitting at 2.2907, which is almost identical to the entry reference of 2.2911. The 15m RSI at 51.94 shows room to run without being overextended, while the 1h ATR of 0.043166 tells us a single hour can cover meaningful ground. The entry zone between 2.2803 and 2.3019 lines up perfectly with that price, and the first target at 2.3688 followed by the
NEAR-0.96%
🚨 JUST IN: Strive $ASST acquired another 1,375 bitcoin:native for $109 MILLION at an average price of $79,281, bringing its total holdings to 24,531 Bitcoin.
The company says 70% of the capital raised last week came from its $SATA preferred stock.
ASST-1.47%
SATA+0.05%
BTC-0.77%
🚨 VIP SIGNAL: $VVV /USDT (SPOT & FUTURES) 🚨
Pair: $VVV /USDT
Direction: LONG 🟢
Trade Details:
Entry Zone: 18.8000 - 19.1500
Leverage: 3x - 5x
Targets:
🎯 Target 1: 19.8000
🎯 Target 2: 20.6000
🎯 Target 3: 21.5000
🎯 Target 4: 22.8000
Stop Loss:
❌ 17.6000
$VVV ‌#GateEventContractTradeSharingChallenge
post-image
VVV+34.60%
  • 7
#GateLaunchesTrenchesWith0GasFee
Gate is introducing a new chapter in on-chain trading with the launch of Trenches featuring 0 gas fees, bringing a more streamlined and accessible experience to traders exploring fast-moving crypto markets. Gas fees have always been an important part of blockchain activity, and for many users they can become an additional cost that has to be considered before every transaction. By introducing a 0-gas-fee trading experience, Gate is working to reduce that friction and give users more freedom to focus on market opportunities, trading decisions, and real-time dev
The hand that set the stop-loss a few days ago was trembling slightly; this morning I realized that was unnecessary filial piety. My last glance before bed showed it moving sideways at the bottom, with funds quietly entering. I felt it was about to take off, so I casually placed a long order. Entered at 641.25, and today it shot straight to 747.7, for a +1178.72% return—felt damn good. Closed 75% first, and set a cost-basis protection stop on the remaining 25% to let it run on its own. Better to miss a limit-up than catch a falling knife and end up covered in blood. Don’t chase the trade now;
post-image
XRP+1.17%
DOGE-1.00%
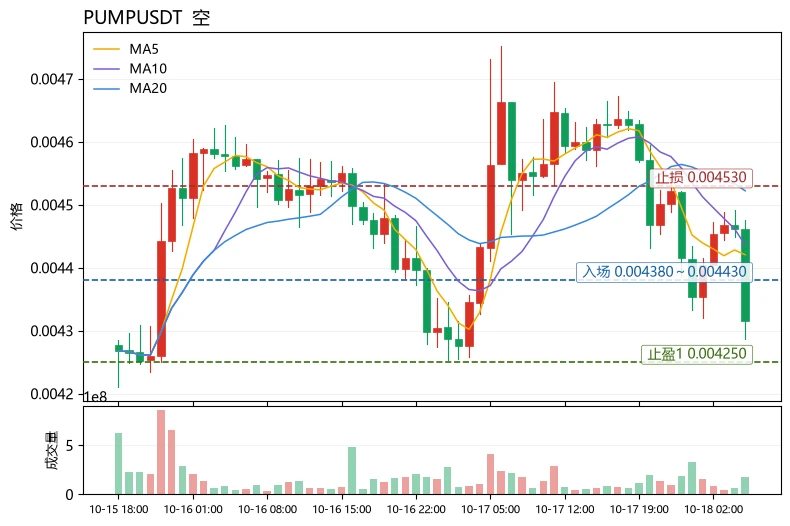
$PUMP is turn to take out ATH and keep going
$10B is a magnet
post-image
PUMP+2.28%
A few days ago, my hand trembled as I set the stop-loss; this morning I realized that extra act of filial piety was unnecessary. That candlestick before bed a few days ago saw $BOB suddenly push upward, nearly sweeping my short position’s stop-loss. I thought to myself, “It’s over—I’m going to get hit again.”

But later in the night, volume contracted and selling pressure picked up, causing the entire move to weaken. It reeked of a bull trap, with volume failing to follow through. This kind of fake breakout is the most dangerous, so luckily I held on without recklessly adding to the position.
post-image
BOB+0.51%
DOGE-1.00%
SNDK-0.34%
The chart is shouting right in front of us, and the picture is crystal clear. When you look at the figures for Bitcoin, Gold, Money Supply, and Global Debt, you can clearly see how the global financial system has reached an impasse and that we are sitting on top of a gigantic bubble.
Global Debt ($350 trillion) and Money Supply ($123 trillion)
The system is clogged: Total global debt worldwide has reached $350 trillion. In return, the money supply (M2) printed stands at $123 trillion.
Unbacked money printing: Trillions of dollars printed without backing are fueling inflation and eroding the pu
post-image
BTC-0.77%
The records have always been public, but I haven’t seen anything... All I can say is, put a little more effort into it, Haiyan.
post-image
#GateEventContractTradeSharingChallenge
ANTHROPICUSDT — Bullish Setup on Gate Pre-IPO Perp
ANTHROPICUSDT is showing a strong bullish structure after breaking out from the 1,938 area and pushing to a recent high of 2,117.59.
Current price: 2,101.70
Daily move: +5.55%
The moving averages are also supporting the trend:
MA5: 2,088
MA10: 2,062
MA30: 2,016
With MA5 above MA10 and MA10 above MA30, momentum remains bullish. Volume is also supporting the breakout, which makes the current structure interesting for a possible continuation.
📌 My Trade Plan:
Entry Zone: 2,060–2,090
I would prefer a pullb
ANTHROPIC+4.31%
  • 1
  • 1
Load More

Join 40 M users in our growing community

⚡️ Join 40 M users in the crypto craze discussion

💬 Engage with your favorite top creators

👍 See what interests you