



Square
Following
Hot
News
Notifications
Profile
Share your thoughts
placeholder
Article
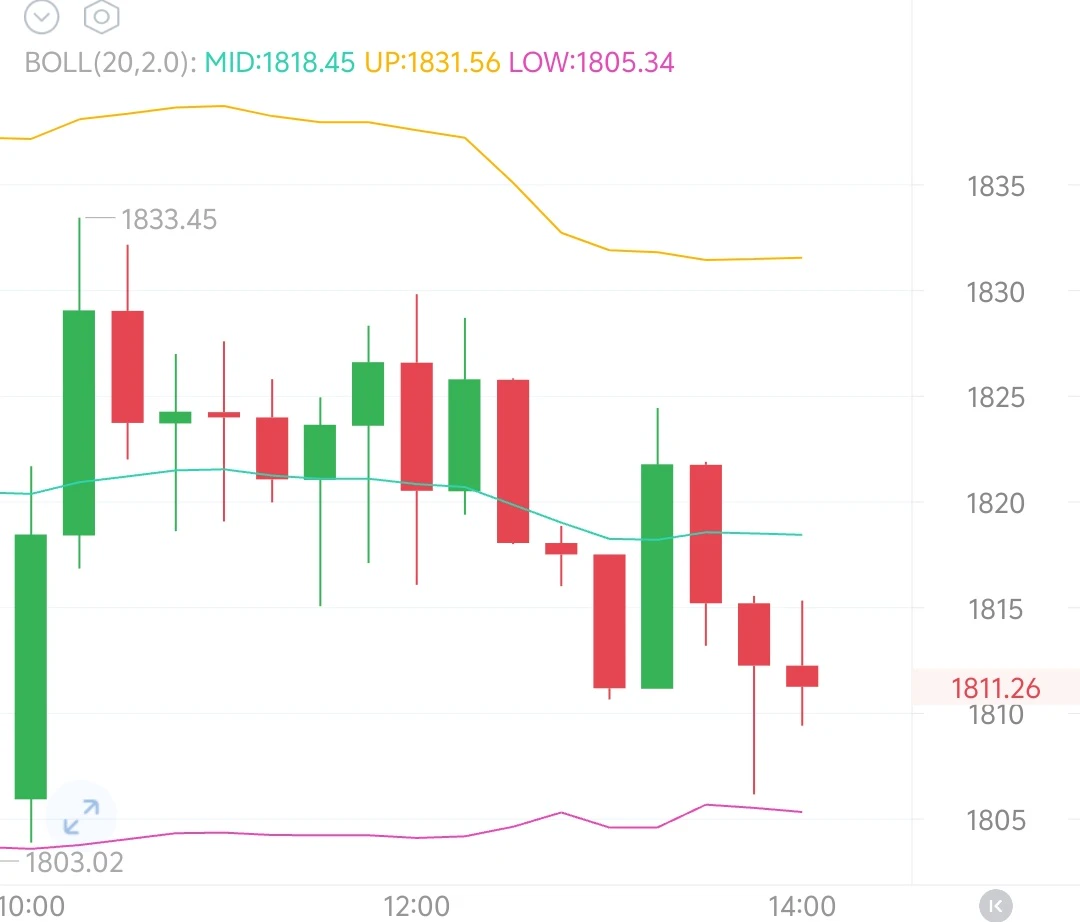
11.16 ETH Brief Analysis

ETH’s volatility today is clearly narrower than BTC’s. Although there is slight short-term corrective rebound momentum, the overall outlook remains weak. Strategy-wise, don’t chase the highs; patiently wait for the rebound to meet resistance before entering a short!

Trade plan: Enter short in batches around 1820–1830.
Downside target: 1800–1780 (in this range-bound market, target this area first and take profits in batches when reached); stop-loss above 1840.
post-image
BTC-0.67%
Nvidia’s First Earnings Report Since Jensen Huang’s Departure! Can It Prove It Can Still Win Without Its Founder?

The most unusual thing about Nvidia’s earnings report this time is not just its revenue and profits, but the major change in leadership. After Jensen Huang stepped down as CEO, CFO Colette Kress took over as interim CEO, making this a key moment for the market to assess the continuity of the company’s management. Investors may ask: Will the product roadmap change? Will customer partnerships be affected? Can AI chip delivery plans remain on track? Will a finance chief taking over t
NVDA-1.92%
  • 17
Trenches
mihao
m
bade
b
mihao
4Cxj...pump
Market Cap
$.
Change
.
24h Vol
$.
Holders
.
HOGE
H
bade
b
HOGE
FVzq...pump
Market Cap
$.
Change
.
24h Vol
$.
Holders
.
rockstar
r
bade
b
rockstar
9HFU...pump
Market Cap
$.
Change
.
24h Vol
$.
Holders
.
AGT
A
bade
b
AGT
0x5d...e274
Market Cap
$.
Change
.
24h Vol
$.
Holders
.
PIEVERSE
P
bade
b
PIEVERSE
0x0e...25a9
Market Cap
$.
Change
.
24h Vol
$.
Holders
.
It's almost 2027, and the crypto market is still being brutally manipulated and fleeced. These scumbags!!!
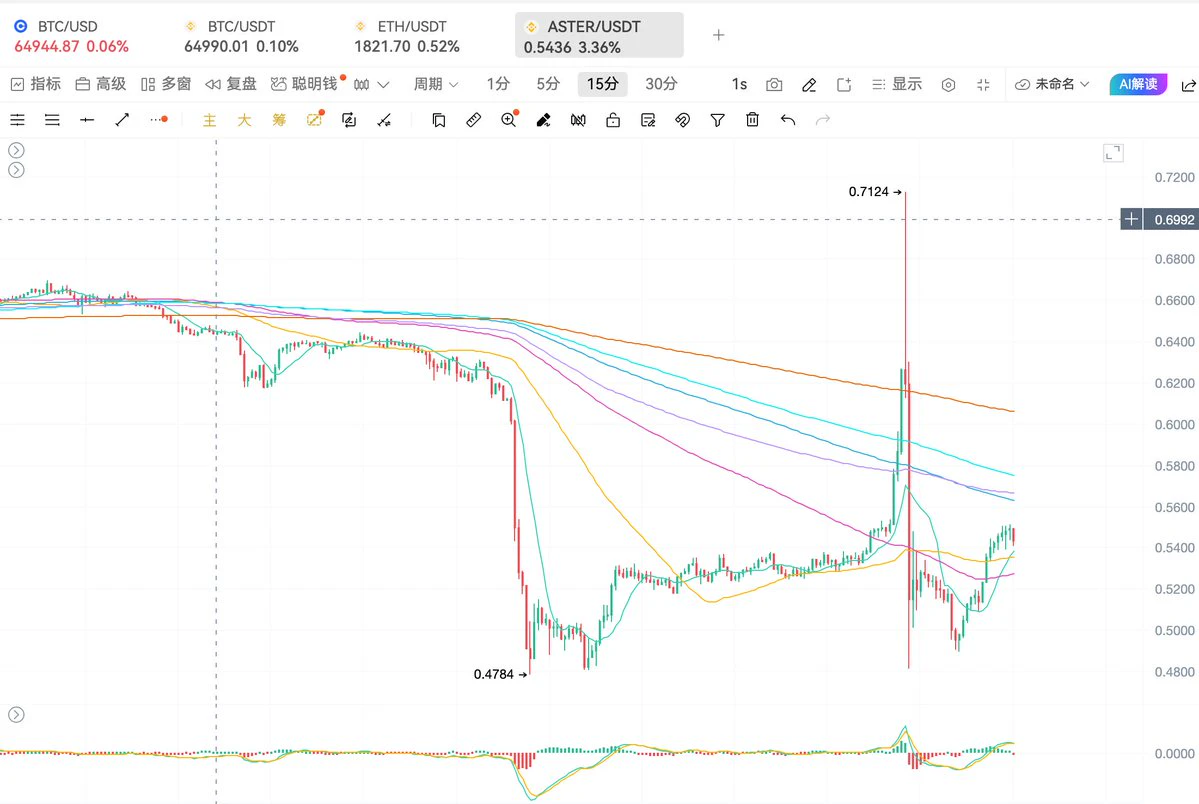
ASTER surged 30% in an hour early this morning, hitting $0.71, then plunged 32% in just 15 minutes, dropping to around $0.48 at its low.
Longs who just jumped in could be liquidated in a chain reaction in the blink of an eye—the little guys are getting wiped out root and branch.
post-image
ASTER-0.07%
BTC has fallen to 64K, and technical indicators are screaming oversold! But why am I still afraid to declare that the bull market is back?

Bitcoin's recent price action has been like a roller coaster with no brakes.
It fell all the way from its highs, touching a low of $62,086 before rebounding to around 64K. Meanwhile, the Fear and Greed Index dropped to 10, and investor sentiment has become quite bearish.
Technical indicators have also flashed signals worth watching.
The daily RSI briefly fell below 30, indicating heavy short-term selling pressure. But here's an easily overlooked point: an
BTC-0.65%
  • 16
Have you seen my money? @NodeXX_cn
Bitcoin Is in Extreme Fear! Is Smart Money Positioning, or Are Retail Investors About to Learn Another Expensive Lesson?

BTC briefly fell toward $64k over the weekend, and the market fear index had many investors on edge. Yesterday, they were still dreaming of financial freedom; today, they’re already figuring out how to cut living costs. That’s how thrilling crypto is: making money feels like opening a mystery box, while losing it feels like defusing a bomb.
Some believe extreme fear often means market sentiment is overly pessimistic, which could create an opportunity for a rebound. But keep
NVDA-1.92%
📉 SK Hynix drops over 5%—is the AI chip rally about to turn?

South Korean stocks came under pressure again, with the KOSPI down over 3% intraday and SK Hynix and Samsung Electronics falling in tandem.

Just days ago, stocks were rebounding; now another round of selling has begun. 👀

With NVIDIA’s earnings report approaching, the market is taking another look at demand for AI computing power, memory chip orders, and whether high valuations can last.

The question now is: Is this drop an overbought correction, or does the semiconductor sector still have further to fall?

💬 Take a side in the
post-image
GateSquare
📉 SK Hynix drops over 5%—is the AI chip rally about to turn?
South Korean stocks came under pressure again, with the KOSPI down over 3% intraday and SK Hynix and Samsung Electronics falling in tandem.
Just days ago, stocks were rebounding; now another round of selling has begun. 👀
With NVIDIA’s earnings report approaching, the market is taking another look at demand for AI computing power, memory chip orders, and whether high valuations can last.
The question now is: Is this drop an overbought correction, or does the semiconductor sector still have further to fall?
💬 Take a side in the comments:
📈 A: Bullish on long-term demand; considering scaling in
👀 B: Wait for NVIDIA’s earnings report before deciding
📉 C: Short-term risks are high; staying on the sidelines for now
Which one do you choose? Feel free to share why you’re bullish or bearish.
#SKHynixFallsMoreThan5%

repost-content-media
  • 3
market prices updates
live-cover
LIVE2,072
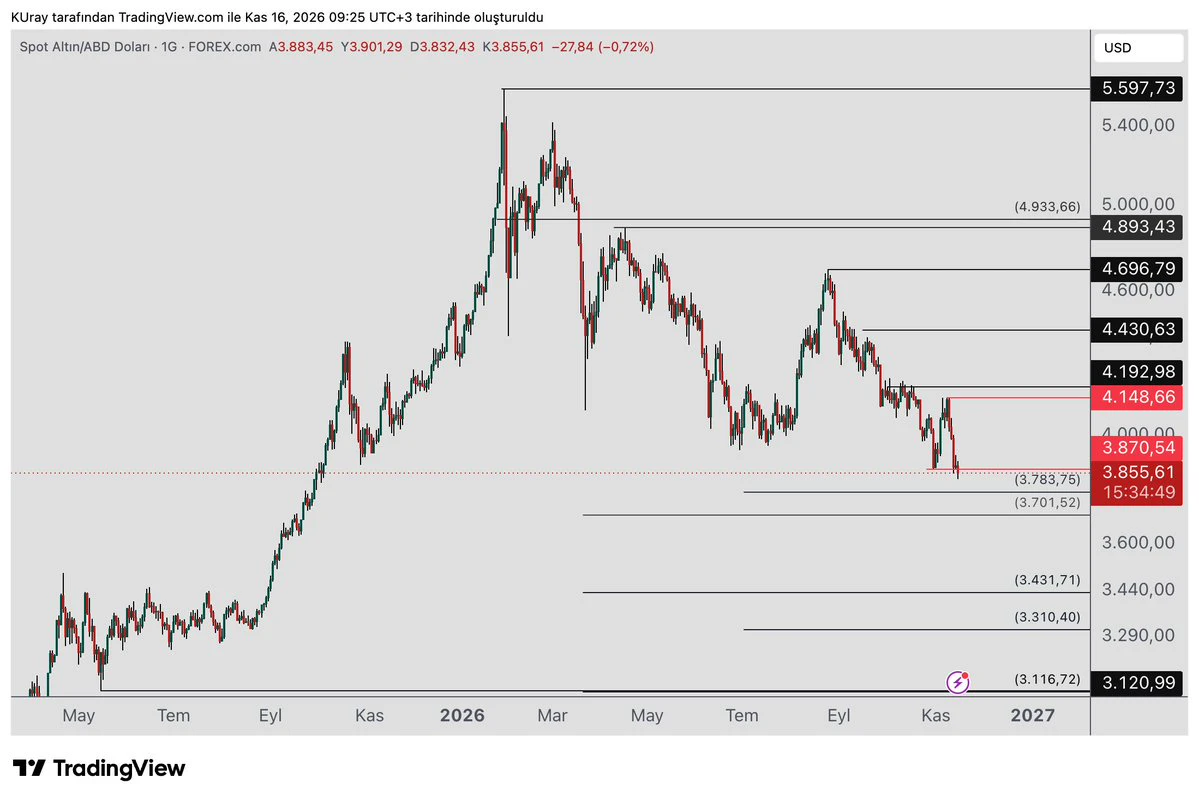
#xauusd #Altın had held the 3870 level on the weekly chart, but is currently trading below it.
As long as there is no daily close above 4148, the decline may continue. If it cannot hold above this level during rallies, the rise is considered a reaction to the decline.
The support levels to watch on the way down are the 3783-3701 zone and 3431-3301.
A renewed attempt to rise may come if it holds at any of these supports. We will look for confirmation of a reversal at the support levels.
post-image
XAUUSD+0.00%
Make a note of this: try living on the minimum subsistence allowance and really experience life
  • 1
How will NVDA perform over the next year? Three key variables after Jensen Huang’s departure will determine the direction of its valuation re-rating!

What’s next for NVIDIA? Rather than guessing whether the stock will rise or fall tomorrow, it’s better to focus on three variables that really matter. First, CEO succession. Colette Kress is currently interim CEO, and the board still needs to find a permanent successor. The final choice will shape the market’s view of the company’s governance and strategic continuity. Second, AI demand. Whether global cloud computing companies continue to expand
NVDA-1.92%
  • 16
CRYPTO MARKET OVERVIEW
live-cover
LIVE2,169
Good morning all ☕
Jensen Huang reportedly weighing a return as Nvidia CEO.
post-image
NVDA-1.92%
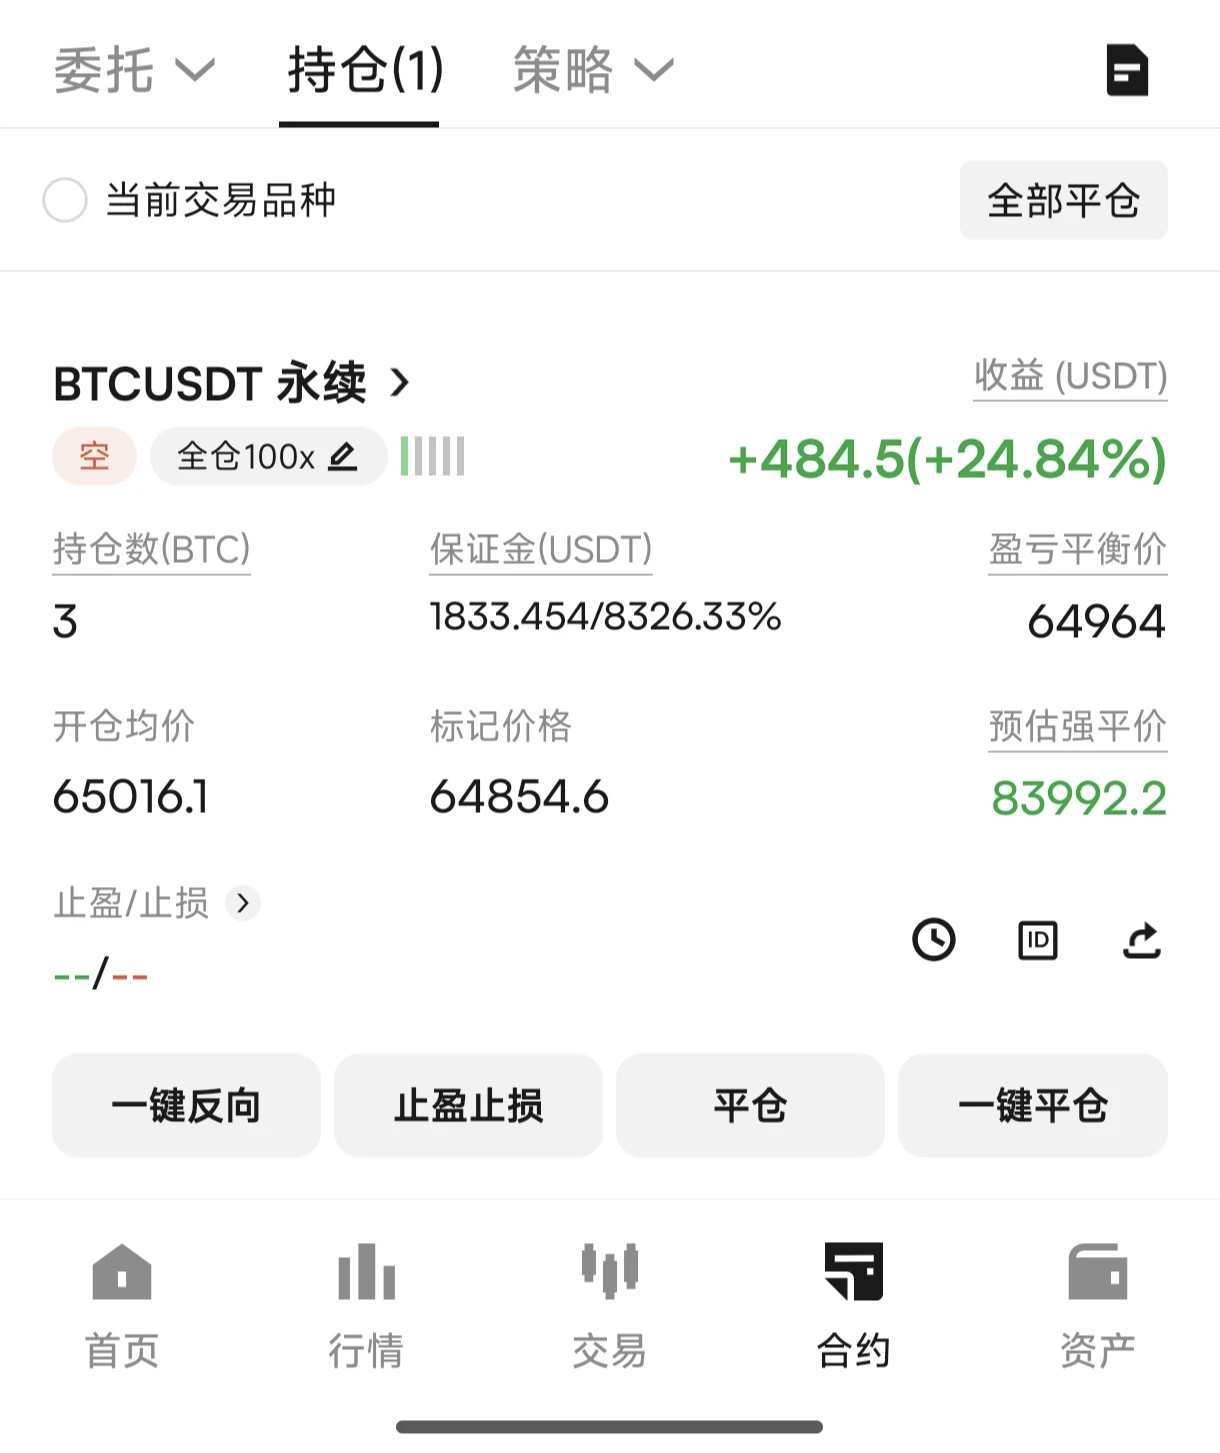
Monday: Weakness has emerged; favor short positions
Technically, the rebound after this pullback has been weak in both strength and magnitude. Given the timing, prices are likely to continue moving lower in the short term to seek effective support. There is still room for further correction on both the weekly and daily charts. The current rebound also offers an opportunity to build positions, and there is no need to worry about limited downside when shorting.

Monday daytime short-term recommendation: With the rebound lacking strength, short BTC at the current price of 650-655, targeting aroun
post-image
BTC-0.65%
  • 1
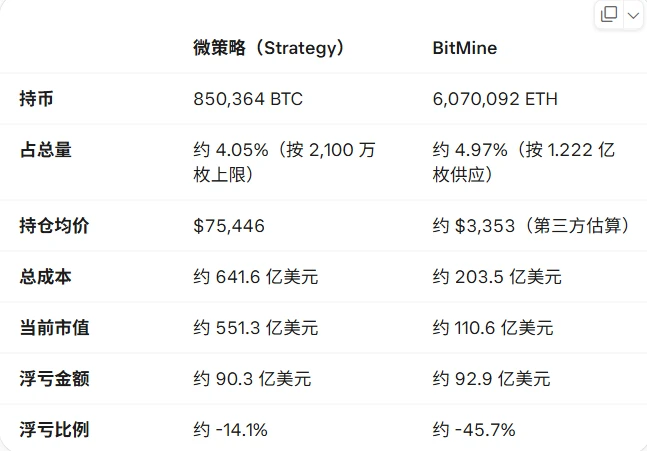
Ethereum really is impressive—BitMine's cost of buying Ethereum is only one-third of MicroStrategy's cost of buying BTC.
But both now have unrealized losses of over $9 billion, with BitMine even losing a little more.
And according to Tom Lee, they will stop buying once their holdings reach 5%. There aren't many opportunities left to add to their positions and lower their average cost. 🤣🤣
post-image
ETH-1.26%
BMNR-4.82%
MSTR-2.37%
BTC-0.67%
Today's Hot Topic | BTC Drops to 64K

Technical Analysis Based on the Charts:

Daily Chart (1D): The daily timeframe shows a significant downward movement. The price declined from the recent high of 87,380 to a local low near 61,913. Currently trading around 65,000, the price is positioned well below the middle Bollinger Band at 74,343. The MACD indicator is in negative territory and the On-Balance Volume (OBV) is trending downward, reflecting sustained selling pressure over the medium term.

4-Hour Chart (4h): The 4-hour chart displays a clear downtrend structure. Following the sharp drop, th
KatyPaty
Today's Hot Topic | BTC Drops to 64K
Technical Analysis Based on the Charts:
Daily Chart (1D): The daily timeframe shows a significant downward movement. The price declined from the recent high of 87,380 to a local low near 61,913. Currently trading around 65,000, the price is positioned well below the middle Bollinger Band at 74,343. The MACD indicator is in negative territory and the On-Balance Volume (OBV) is trending downward, reflecting sustained selling pressure over the medium term.
4-Hour Chart (4h): The 4-hour chart displays a clear downtrend structure. Following the sharp drop, the price is attempting to stabilize. The MACD histogram is showing reduced bearish momentum, which suggests that the downward pressure is temporarily slowing down.
1-Hour and 15-Minute Charts (1h, 15m): On the lower timeframes, Bitcoin is in a consolidation phase around the 65,000 level. The Bollinger Bands are narrowing, and the MACD is moving flat near the zero line. This indicates a period of market indecision and low volatility following the recent price action.
Is this a short-term correction or the start of a new bear market?
Based on the daily chart, the price has broken below several key levels and is trading below its middle Bollinger Band. This price action suggests a medium term bearish trend rather than a minor short term correction. Whether it develops into a full bear market depends on if the price can hold the recent support level near 61,900 on a daily closing basis.
Would you buy the dip, accumulate gradually, or wait?
Buying the dip aggressively carries high risk given the current daily downtrend. A gradual accumulation approach is more logical, focusing on major support zones such as the recent 62,000 area. Alternatively, waiting for confirmation of a trend shift, such as a bullish MACD crossover on the 4-hour chart or the price reclaiming the 1-hour middle Bollinger Band, would be a safer strategy to mitigate downside risk.
#ShareWeekly #BTCBreaksKeySupportAsFearDeepens #WCTCS9
repost-content-media
BTC-0.67%
Looking at gold’s current trend, prices have continued to retreat from around $5043 earlier, falling as low as $3775 and currently trading around $3855. Overall, the bearish trend on the daily chart remains clear, while there are signs of a short-term rebound.

On the daily chart, the MA5, MA10, and MA30 are bearishly aligned, with prices trading below the moving averages. The MACD is also below the zero line, indicating that the medium-term trend remains weak for now. On the 4-hour chart, the MACD has formed a low-level golden cross, and short-term rebound momentum has recovered somewhat, but
post-image
XAU+0.38%
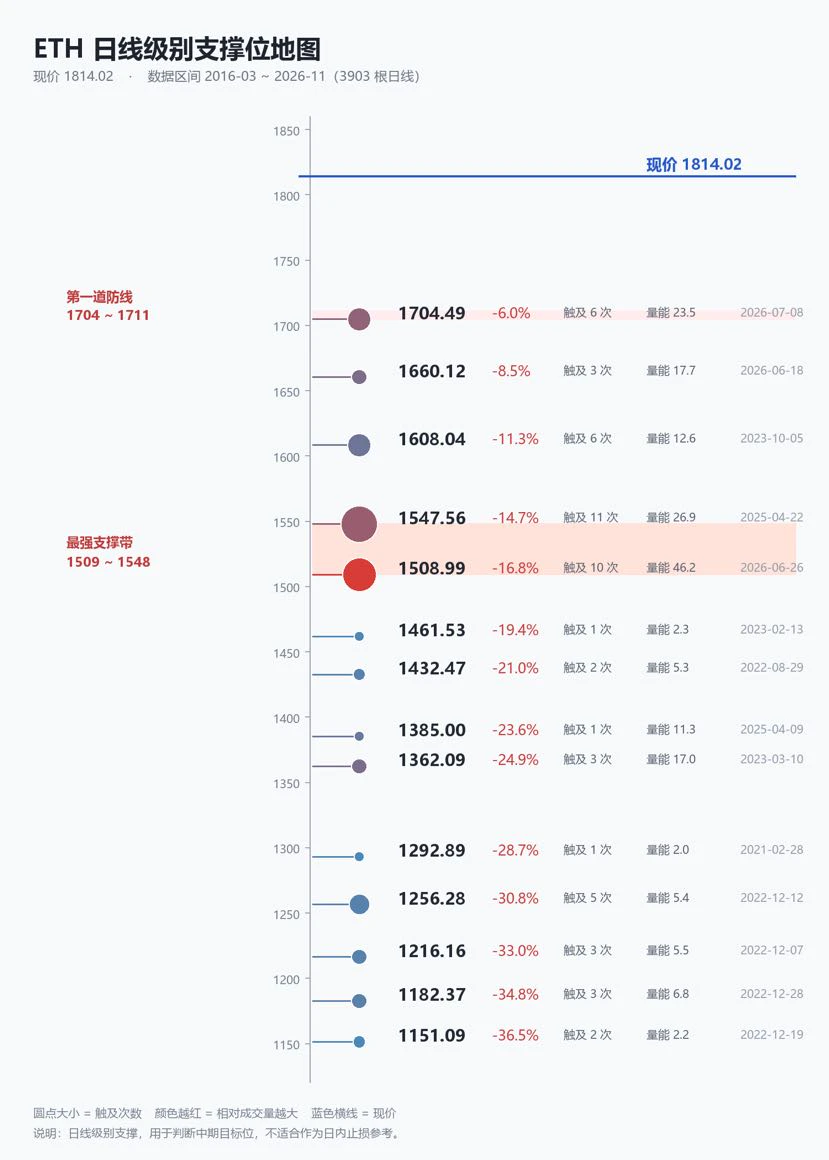
Strong support level$ETH ‌
post-image
ETH-1.23%
  • 1
Load More

Join 40 M users in our growing community

⚡️ Join 40 M users in the crypto craze discussion

💬 Engage with your favorite top creators

👍 See what interests you

Trending Topics

GateIPOAccessAnthropic

388.2K Views2.8K Discussing

Gate IPO Access Phase 3 features Anthropic (ANT), with USDT subscription interest starting from 100 USDT. Successful allocations will be delivered as real shares to Gate Stock Accounts. Indicative price: $70–$78/share Subscription: Nov 12–17 (UTC+8) Allocation is not guaranteed. Please manage risk accordingly.

Dr.HanOxfordUnionSpeech

154.8K Views521 Discussing

BTCBreaksKeySupportAsFearDeepens

5.4M Views36.7K Discussing

View More