Square
Following
Hot
News
Profile
Share your thoughts
placeholder
Article
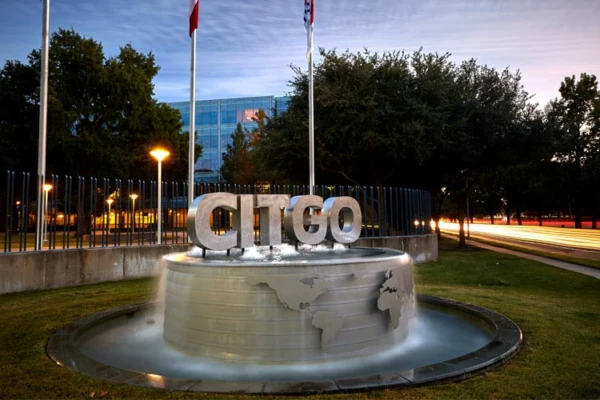
🛢️ The Citgo Simón Bolívar Foundation served 1.5 million people: what does it tell us about Venezuela’s currency landscape and P2P market?
The Simón Bolívar Foundation, Citgo Petroleum’s philanthropic arm, published its sixth annual report with a figure worth reading twice: nearly 1,500,000 vulnerable people served since 2020. The original goal was to reach one million. Reality surpassed it.
During 2025, the Foundation signed 11 new grant agreements with partner organizations operating in Venezuela, Colombia, Ecuador, and the United States. The estimated reach: more than 116,000 people in nee
post-image
U.S. stocks rally, Korean stocks crash! $SNDK The big players are using the opportunity to pump and dump—whoever gets in is doomed!
A rebound isn’t a bottom; capital flows are the most honest.
Candlesticks can be manipulated, but whales fleeing can’t be hidden! U.S. semiconductor stocks are up, but Korean stocks plunged this morning—that’s the big players using good news to pump prices and find buyers to dump on.
SNDK plunged to 1215, then rebounded to 1332, with the moving averages overhead keeping it firmly capped.
Trading strategy: Aggressive traders can short now; more cautious traders ca
SNDK+5.25%
Trenches
CNPY
C
bade
b
CNPY
0xc6...ddd2
Market Cap
$.
Change
.
24h Vol
$.
Holders
.
TSI
T
bade
b
TSI
0xa8...1c1e
Market Cap
$.
Change
.
24h Vol
$.
Holders
.
AGT
A
bade
b
AGT
0x5d...e274
Market Cap
$.
Change
.
24h Vol
$.
Holders
.
BOOMER
B
bade
b
BOOMER
0x5a...5c00
Market Cap
$.
Change
.
24h Vol
$.
Holders
.
PIERRE
P
bade
b
PIERRE
D3S6...pump
Market Cap
$.
Change
.
24h Vol
$.
Holders
.
BTC MARKET OVERVIEW
live-cover
LIVE1,459
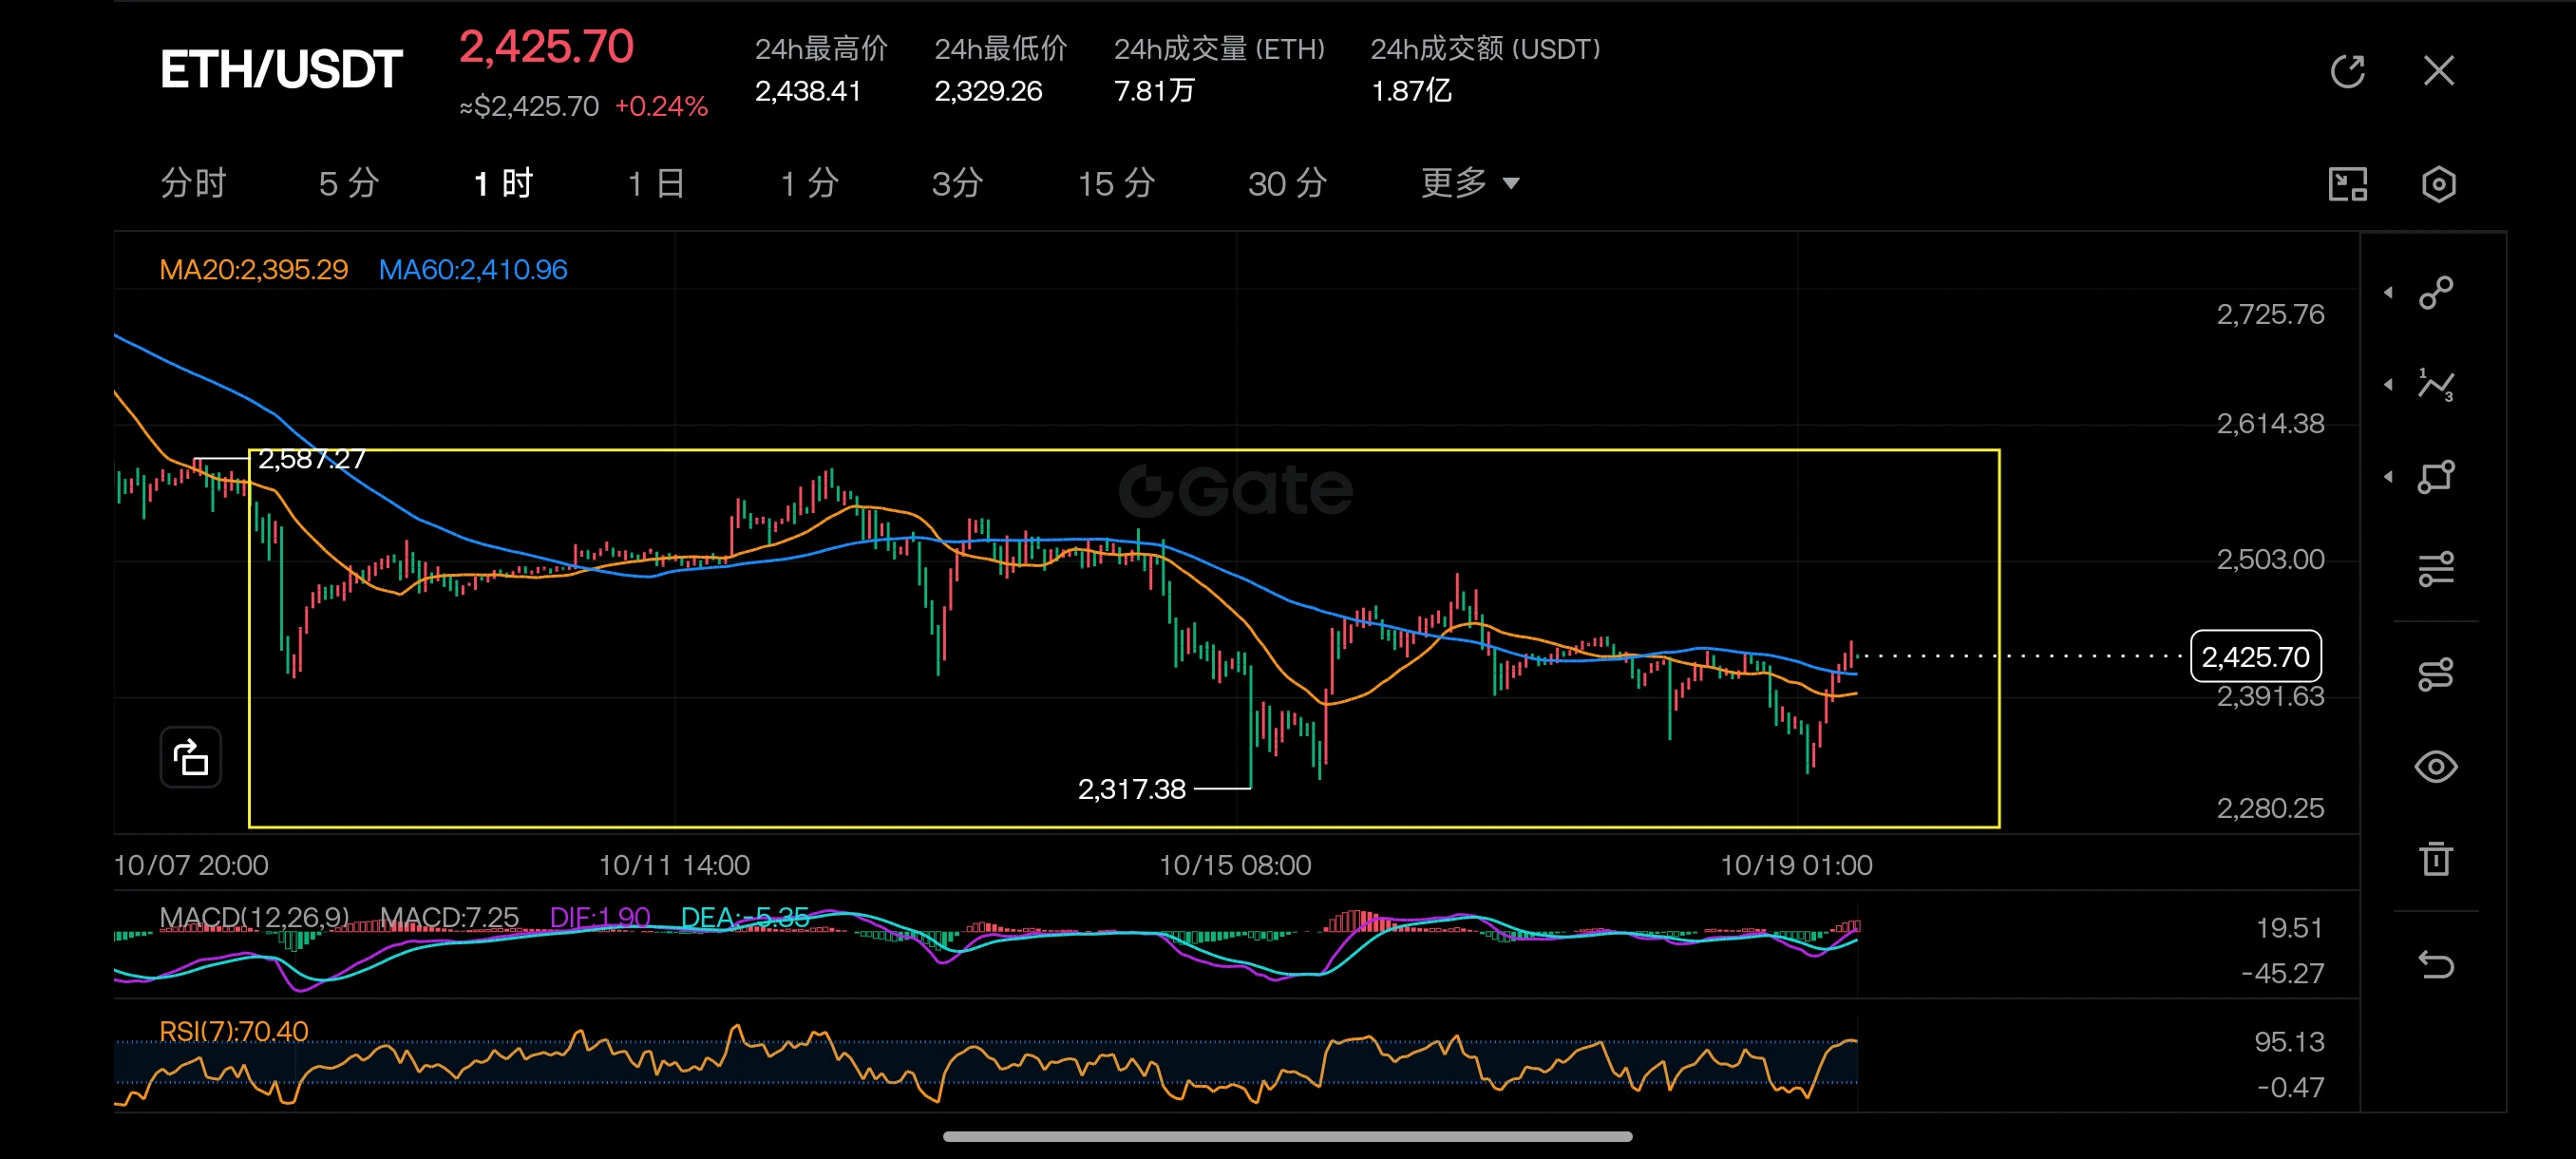
10.19 ETH Market Analysis
Short: around 2425-2445, stop-loss at 2470, targets at 2400/2370.
ETH is currently at 2418. In this rally from 2327, it reached a high of 2428, but has now started to pull back and is currently around 2418. Short-term momentum has clearly weakened.
After this sharp rally, price failed to hold near the highs and immediately reversed lower. The 2425-2445 zone above is the recent high area and also the short-term moving-average resistance band on the 1-hour chart. If price rebounds to retest this area but still cannot break higher, that confirms overhead selling pressure
post-image
ETH-0.05%
🔥Gate Social Events Overview: Multiple Benefits in One Place—Join to Unlock Creator Rewards!
【New User Events】
🔔 New Streamer Go-Live Benefits + Referral Rewards
New streamers can claim rewards as soon as they go live, and earn extra bonuses by inviting streamers to join
https://www.gate.com/announcements/article/102066
🎁 Weekly Rising Star Streamer Selection
New streamers who go live can win exclusive gifts every week and receive dedicated official traffic support
https://www.gate.com/announcements/article/102230
🔥 New Creator Rewards
New creators are guaranteed a red packet for their fir
post-image
GT-0.69%
  • 2
  • 5
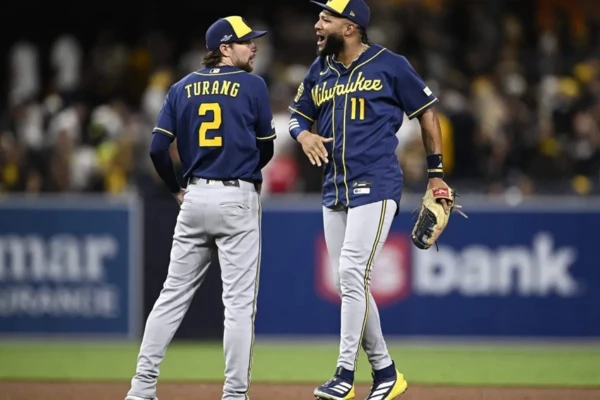
⚾💰 The National League final is being played on two boards: the diamond and the checkbook.
The Los Angeles Dodgers have a payroll of around US$393.8 million, including salaries and taxes (according to figures from industry site Spotrac). The Milwaukee Brewers are at about US$192 million. That’s a nearly $200 million difference between two teams that each won more than 100 games in the regular season.
Los Angeles competes with capital: seven players earning more than US$26 million a year. Milwaukee competes with scouting, player development, and surgical decision-making: Christian Yelich, at U
post-image
#GateWCTCS9全球交易赛 #辣妹儿李嘉欣
I just can't understand it. Within a range, I understand selling high and buying low, but I can't understand how you manage to enter trades at different price levels every single time and take profit at different price levels. I can understand making 30 or 50 points on a trade, but I can't understand how you manage to catch the exact highs and lows every single time.
At the same timeframe, in a ranging market, I totally understand placing trades at the upper and lower bounds, but I just can't fucking understand how you manage to make such perfect trades when price has
post-image
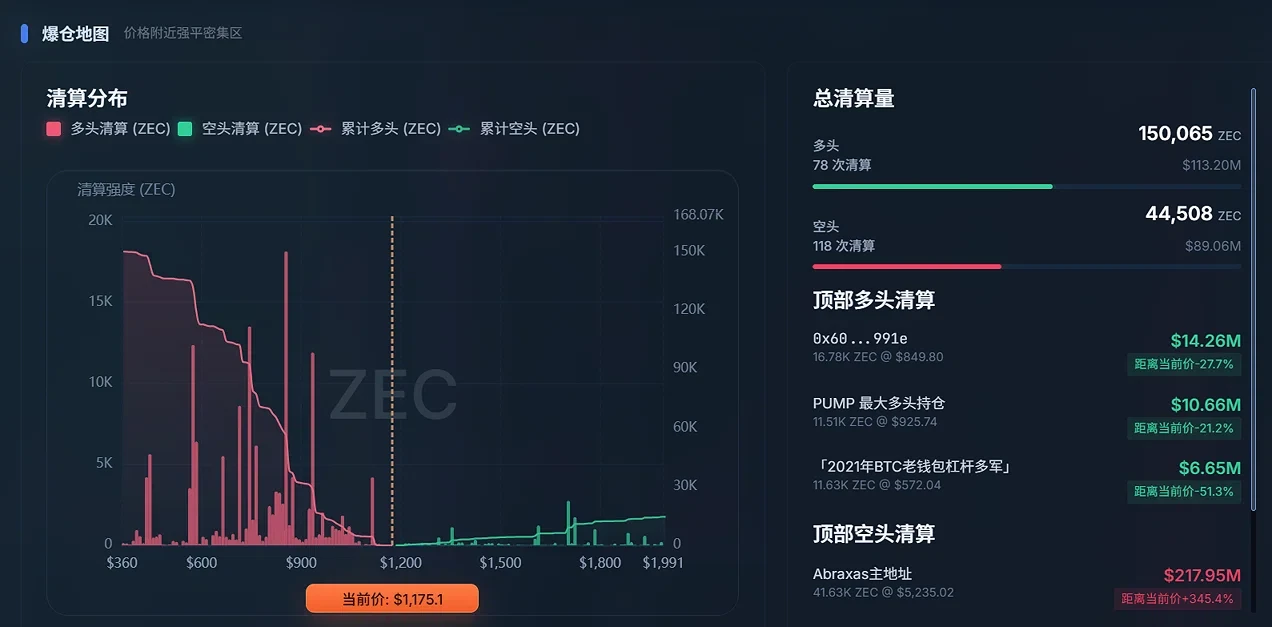
Longs have been brutally liquidated; the time to short at highs has arrived! Suggested direction: Short. Entry: Aggressive: around 1180 at the current price; conservative: wait for a rebound to 1220 before entering. Targets: 1100, then 1050 if support breaks. Rationale: Negative news: The NU7 proposal to freeze Sprout spending has sparked panic selling. Market under pressure: Moving averages are strong resistance on the 4-hour chart, indicators are overbought, and 1180-1220 above is a dense liquidation zone. Data confirms: The liquidation map shows very little short liquidation volume above, w
post-image
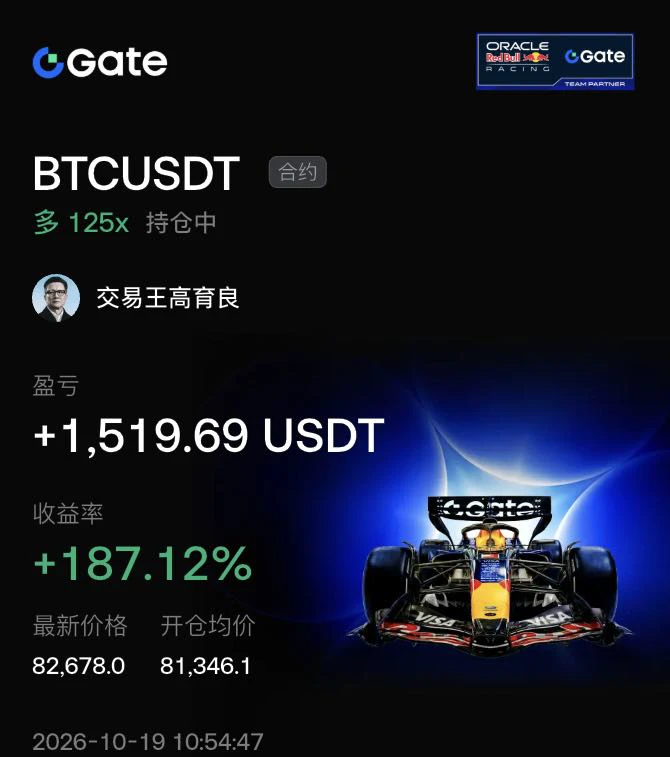
Guys, I've been earnestly urging everyone to keep going long these past few days, opening long positions whenever there's an opportunity, and I've kept reminding you. How many of you listened? I've already told you, it can't fall any further, it can't fall any further. Have you all gone long yet? A while ago, I told everyone to go short. Yifan has told you: when it's time to go long, go long#BTC #比特币突破8.2万美元
BTC+0.71%
live market update
live-cover
LIVE2,152
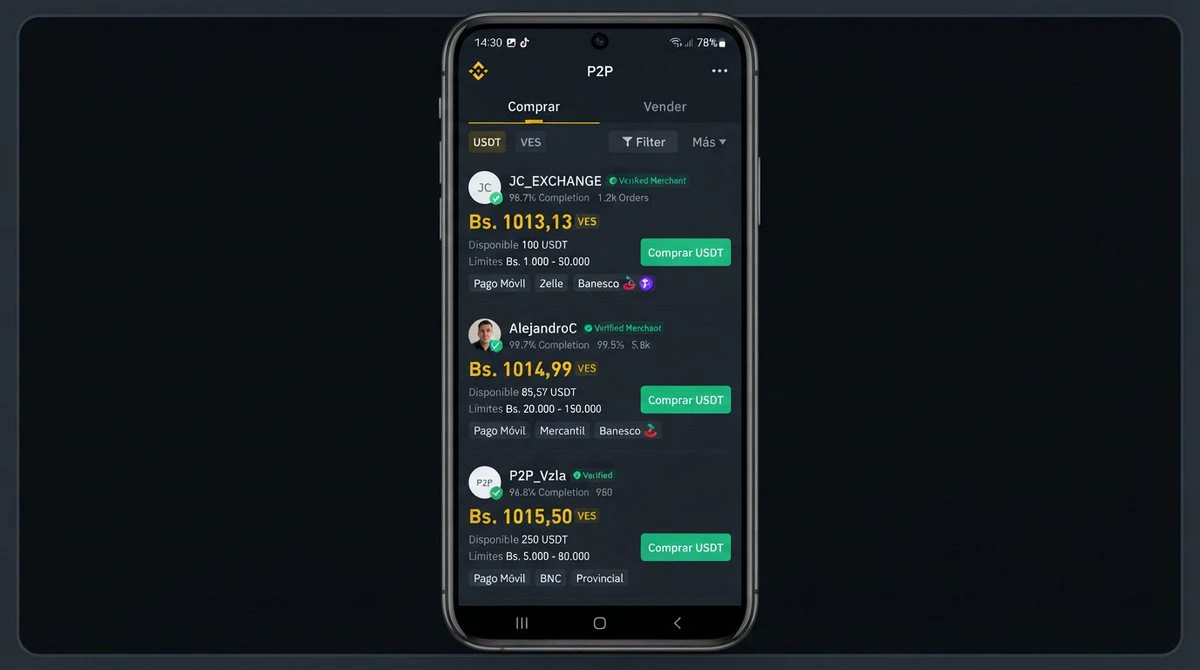
📊 Three measurements get confused every morning in USDT/VES P2P: the Radar spread (7.16%), the order book spread (0.05%), and the spread at each bank (0.83% to 8%). PitbullChain’s Oct 13 analysis shows how to tell them apart.
🔍 1. The benchmark spread: 7.16% on the P2P Radar. It’s the market’s thermometer—the difference between the best buy and the best sell across all of P2P.
📖 2. The order book spread: 0.05%. It measures the opposite: immediate liquidity between consecutive levels in the book. When it’s this tight, the market can absorb trades without moving the price.
🏦 3. The spread by
post-image
This has to be the most impressive person in the system! He’s only 31—what kind of person could possibly be worthy of him!
post-image
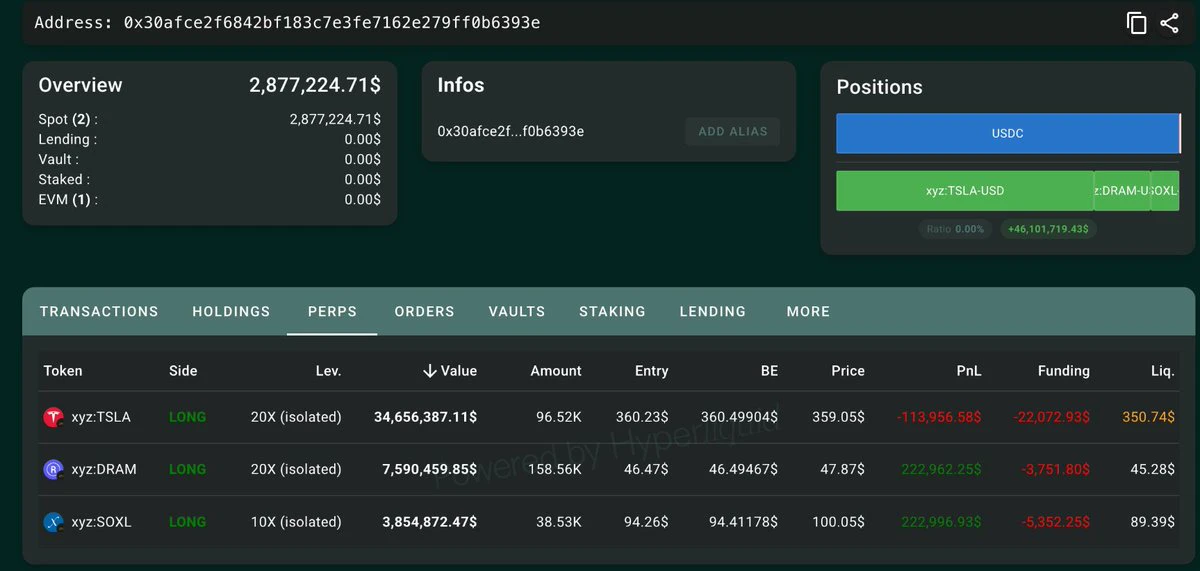
🐋 WHALE WATCH : Gambler 0x30af closed his long on 1355.6
$BTC $110.85M taking a $3.26M loss.
He then flipped to going long on
$TSLA $DRAM and $SOXL with maximum leverage.
Positions:
96522 $TSLA $34.65M = Liq. price: $350.74
158557 $DRAM $7.59M = Liq. price: $45.28
38529 $SOXL $3.85M = Liq. price: $89.39
post-image
BTC+0.76%
TSLA+1.92%
DRAM+4.28%
SOXL+9.70%
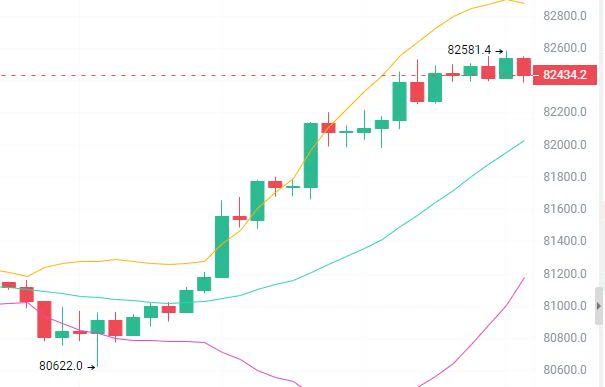
10.19 BTC Market Analysis
Short: Around 82600–82900, stop loss at 83200, targets 81500/80800.
BTC is currently at 82452. The rally from 80638 has been very sharp, and price has now reached the previous high of 82488. On the 1-hour chart, price is moving upward along EMA5 (82400), but 82886 above is an earlier high, and considerable overhead supply has accumulated in the 82500–82900 area, making it difficult to break through all at once.
After a sharp rally like this, sideways consolidation makes chasing longs risky, as it can mean buying near a short-term high. If price pushes up into the 8260
post-image
BTC+0.76%
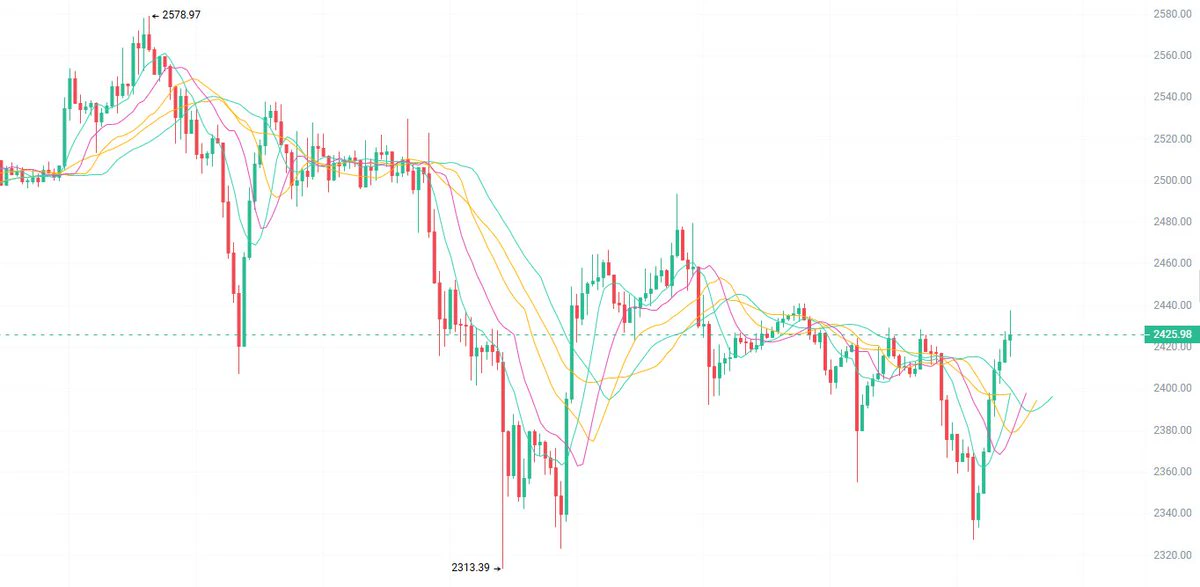
10.19 ETH: Light short around 2440, stop at 2500, targets 2400/2350
ETH on the 1H chart plunged from 2578 to 2313. It’s now at 2426 after a sharp rebound, and short-term moving averages are starting to turn up.
But the higher-timeframe chart is still recovering, with 2440–2460 as the key resistance zone for now.
After 9 years of trading, I don’t blindly buy the dip during sharp drops or mindlessly chase rebounds. $ETH #ETH
post-image
ETH-0.08%
Never touch $SOXL unless you can handle getting thrown off twice in a single day. The 24h low was 88.47, the high was 100.45, the range was 13.5%, and the current price of 100.19 is hugging the intraday ceiling. 24h trading volume was $839 million—this isn't a stock, it's a triple-leveraged meat grinder. Behind the 9.89% single-day gain is volatility that could bite back at any moment. I've seen too many people rush in after seeing a semiconductor ETF surge, only to get slapped around by leverage decay and overnight gaps, with their accounts shrinking faster than they can double.
But if you in
SOXL-12.57%
SOXX-4.13%
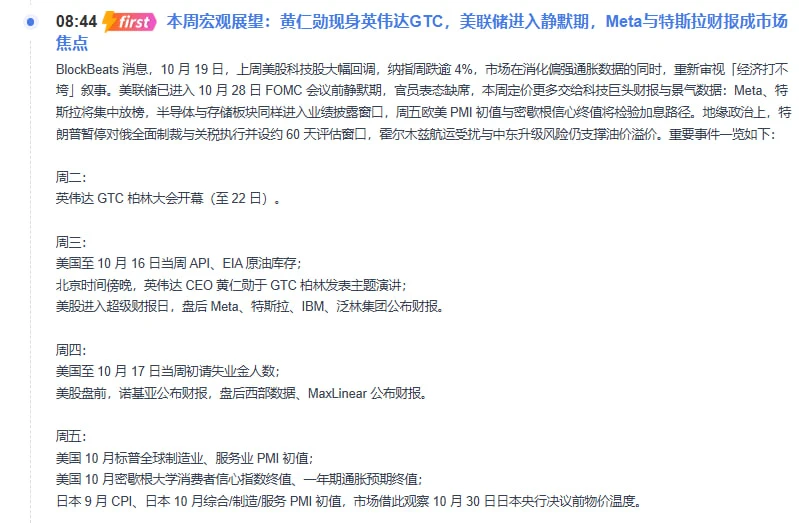
$270 million wiped out! FOMC blackout period + Jensen Huang to the rescue—the crypto market script for this week is already written
Leverage never dies, and neither does the market. $272 million evaporated over the past 24 hours, with longs accounting for 83.49%—the market is telling you in no uncertain terms: the blackout period is no place for reckless traders.
This week’s core conflict is “macro vacuum” meets “narrative impulse.” The FOMC blackout period means Fed officials are collectively keeping quiet, leaving the market without a directional anchor. BTC is likely to grind along the bott
post-image
BTC+0.71%
ETH-0.08%
Is Republican-era style trendy among young women these days?
A single snack subscription order costs $1,500!
post-image
Bitcoin morning outlook
Trade:
Short near 828-833 on a bounce
First target: 823-820
Second target: 815-810
Set a stop-loss
Bitcoin is strongly squeezing shorts and nearing the upper band. MACD shows rising volume, while RSI is severely overbought, sharply increasing short-term pullback pressure. I’m Yuejie. In this kind of extreme bullish market, I never blindly call a top and stubbornly hold short positions, nor do I chase longs. My approach is simple: wait for a rally to stall and close bearish, then try a small short to play for a pullback, with a stop above the previous high; or wait for a
post-image
BTC+0.76%
Load More

Join 40 M users in our growing community

⚡️ Join 40 M users in the crypto craze discussion

💬 Engage with your favorite top creators

👍 See what interests you

Trending Topics

StakeLaunchPoolToShare2.8M$DNA

36.47k Views657 Discussing

Gate LaunchPool’s DNA debut campaign is now live with a total reward pool of 2.8M $DNA. Stake $BTC, $ETH, or $DNA to participate, with rewards distributed hourly. If you’re looking for a simple way to join a new-token opportunity. [👉 Join Now](https://www.gate.com/launchpool/554)

GateWCTCS9GlobalTradingCompetition

37.93k Views6.87k Discussing

BitcoinTops$82K

41.17k Views39.72k Discussing

View More