Square
Following
Hot
News
Profile
Share your thoughts
placeholder
Article
Bitcoin at $81,500 as bulls and bears lock in a tug-of-war
Bitcoin is trading around $81,500 on October 17, 2026, caught in a technical standoff that has left the market searching for direction. Short-term moving averages are flashing bearish signals, while longer-term averages continue to support buyers. The Relative Strength Index (RSI) sits at 46, and the overall technical assessment remains neutral.
With a market cap of roughly $1.639 trillion, daily trading volume of $13.967 billion, and a 24-hour range spanning $81,108.80 to $81,733.01, the market is locked in a tight consolidation patte
post-image
BTC-0.25%
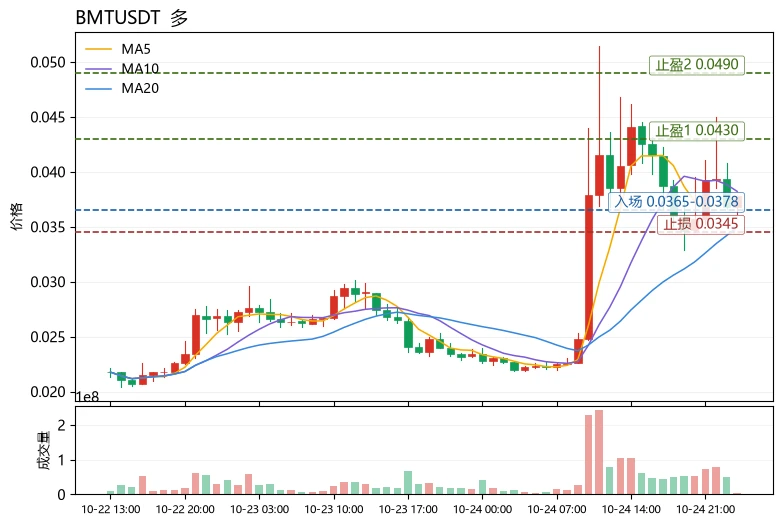
Strong rebound in the main FVG zone on the 1-hour chart, with a pullback expected to the main liquidity area around $0.255–$0.260. ‼️Long $GTC Entry price: 0.235 - current price Take profit: 0.257 Stop loss: 0.215 Trade here $GTC 👇
post-image
GTC
GTC芝麻币
Gate.Fun
MC:$0.1Holders:1
0%
Trenches
AGT
A
bade
b
AGT
0x5d...e274
Market Cap
$.
Change
.
24h Vol
$.
Holders
.
CNPY
C
bade
b
CNPY
0xc6...ddd2
Market Cap
$.
Change
.
24h Vol
$.
Holders
.
COVENANT
C
bade
b
COVENANT
0xcd...de79
Market Cap
$.
Change
.
24h Vol
$.
Holders
.
Q
Q
bade
b
Q
0xc0...0589
Market Cap
$.
Change
.
24h Vol
$.
Holders
.
Gato
G
bade
b
Gato
55A3...pump
Market Cap
$.
Change
.
24h Vol
$.
Holders
.
#DOGE DOGE ETF switches from consecutive net inflows to redemptions! Can the $0.08 support hold?
Dogecoin fever cools! ETF funds flee, with $0.08 becoming a crucial line in the sand🐶
Once wildly popular Dogecoin (DOGE) is now facing a subdued market atmosphere. Dogecoin ETFs had previously seen three consecutive weeks of inflows, but the trend completely reversed in October as institutional funds began to pull out, putting considerable pressure on the price.
📉ETF funds see $540k in outflows over two days.
According to SoSoValue data, spot Dogecoin ETF flows were virtually flat from October 1
post-image
ThisIsTranslateContent:
#DOGE DOGE ETFs switch from consecutive net inflows to redemptions! Can the $0.08 support hold?
Dogecoin hype cools! ETF funds flee, with $0.08 becoming a make-or-break line🐶
Dogecoin DOGE, once hugely popular, is now facing a subdued market atmosphere. Dogecoin ETFs had previously seen three consecutive weeks of inflows, but the trend completely reversed in October as institutional funds began to pull out, putting significant pressure on the price.
📉ETF funds see $540,000 in outflows over two days.
According to SoSoValue data, from October 1 to 9, flows in and out of Dogecoin spot ETFs were virtually flat, with no funds entering or leaving. Instead of a turnaround, a wave of redemptions followed. Around $400,000 flowed out on October 12, followed by another $138,600 on the 13th, bringing total outflows to $540,000 in just two days.
Fund net assets also shrank from nearly $17 million at the start of the month to $14.44 million. The retreat of institutional funds is a major headwind DOGE must now face.
📊The price continues to weaken, with bearish technical indicators.
DOGE is down 14% overall this month. It was still holding at $0.095 at the start of the month, but slid steadily after October 7 and is now trading at around $0.0800.
Although it briefly rebounded to a high of $0.088 on the 12th, the recovery was short-lived, and the price quickly fell again, touching a low of $0.08. Technical indicators are also unpromising: the RSI has fallen below its signal line, while the CMF money flow indicator briefly dropped to near -0.90 and has now recovered to -0.30, indicating that the overall trend of capital outflows remains unchanged.
⚖️Futures market sees a tug-of-war between bulls and bears, with bullish positions weakening.
Signals from the derivatives market are mixed. DOGE open interest first surged to $652 million, then fell to $598 million before edging back up to $609 million. The funding rate remains positive at 0.0088%, indicating that the market still retains some long positions, with bulls continuing to pay fees to bears. However, the overall decline in open interest means bullish momentum in the futures market is weakening.
📌Market Summary and Key Points to Watch
$0.08 is a key short-term support level for DOGE. If it breaks decisively below this level, pressure on bulls will intensify sharply, and the price could fall further. The market is currently weak overall, and the rebound lacks strength, so it is unwise to blindly buy the dip. Watch closely to see whether the $0.08 support holds.#WCTCS9
repost-content-media
DOGE-1.99%
Find opportunities in $DOGE using price-volume confirmation; key levels and exit lines are here
What stands out most in this $DOGE chart is not the 2.33% 24-hour decline itself, but that the 1-hour and 4-hour charts are both weak yet haven’t delivered the same answer.
My view is that direction is taking shape for now, but low participation has reduced the credibility of this move.
$DOGE The current price is 0.07917, with a 24-hour range of 0.07702–0.08107. The 1-hour support is at 0.07702, with resistance at 0.08096; the two more distant 4-hour boundaries are 0.07702 and 0.08566. These numbers
post-image
DOGE-1.99%
#DOGE #WCTCS9 Dogecoin May See Its First Major Daily Death Cross of 2026: Is a Potential Trend Reversal Coming?
A potential trend reversal could offset bearish pressure and invalidate the current pattern.
Dogecoin could see its first daily death cross of 2026 as moving averages suggest they will converge in the coming days. The daily 50-day moving average is currently trending downward, while the daily 200-day moving average is flattening, highlighting the potential for a death cross. Dogecoin saw its first daily golden cross since 2026 in October, but profit-taking in the crypto market drove
post-image
ThisIsTranslateContent:
#DOGE #WCTCS9 Dogecoin may see its first major daily death cross of 2026: Is a potential trend shift approaching?
A potential trend shift could counter bearish pressure and invalidate the current setup.
Dogecoin could see its first daily death cross of 2026, as moving averages point to convergence in the coming days. The daily 50-day moving average is currently sloping downward, while the daily 200-day moving average is flattening, highlighting the potential for a death cross. Dogecoin saw its first daily golden cross of 2026 in October, but profit-taking in the crypto market drove its price down to a low of $0.077. Bears seem to be making an aggressive effort to negate this bullish signal, with the possibility of a death cross drawing near.
The timing of a death cross remains uncertain, as a trend shift could counter the bears’ push and invalidate the current pattern. At the time of writing, Dogecoin was up 3.19% over the past 24 hours to $0.081, after briefly selling off as investors weighed higher-than-expected inflation data and the latest remarks on interest rates from Fed Chair Kevin Warsh.
Inflation data released this week was strong: the Producer Price Index released Thursday showed wholesale prices rose 6.3% year over year in September, the biggest increase since 2022. The Consumer Price Index also rose in data released Wednesday. Fed officials responded in September by approving the first rate hike in more than three years; markets expect the Fed to hold rates steady in October and hike again in December.
Could a trend shift be coming? The last time Dogecoin saw a death cross on the daily chart was in November 2025, followed by months of selling until a golden cross appeared recently. This has focused market attention on price action in case a death cross ultimately appears again.
Crypto analyst Ali recently posted a contrarian take on X, sharing three reasons to be bullish on Dogecoin.
First, the TD Sequential indicator has previously marked potential turning points for Dogecoin several times, and this time it issued a buy signal on the daily chart as the price neared $0.081.
Second, URPD data shows that about 36 billion DOGE previously traded near $0.081.
Third, whales appear to be buying near this support level, having accumulated 600 million DOGE since October 12.
If $0.081 holds and Dogecoin rebounds, Ali identifies the $0.16 to $0.17 range as a potential profit-taking zone. $DOGE
repost-content-media
DOGE-1.99%
After going through forty-eight candles, there’s one I’m not comfortable fast-forwarding through.
A wick spike.
The 05:00 candle plunged to 1214.16, while the previous one was still above 1297.
Volume picked up: 1.17 million in a single hour, compared with just 35,000 in the previous one.
It rebounded to 1269.44 over the next three hours, but has now slid back to 1257.97.
The peak at 1408.95 was reached at 13:00 on 10-16; after that, each high kept moving lower.
$SNDK In forty hours, it went from 1408.95 to 1214.16, a drop of 13.8%.
As usual: a low formed on heavy volume only counts if it hold
post-image
SNDK-3.15%
$Online Loan Life: Borrow money to enter the market, stay up all night watching charts, and keep adding to the position.
Act like nothing’s wrong during the day; stare blankly at red candles at night.
When liquidation hits, debt collection texts arrive more punctually than market moves.
Interest keeps accruing, but the position is down to zero.
We’re not gamblers, just ordinary people trying to survive in crypto.
Online loan life: the most honest portrait of crypto bros.
post-image
Bitcoin Support and Resistance Levels
live-cover
LIVE587
🤖 NEW PREDICTION MARKET: Can Gemini 4 Argon (High) finish first on Oct. 19?
Gemini 4 Argon (High) leads at 93.5% in the Oct. 17 snapshot. Rivals need an eligible Text Arena entry; the noon ET ranking decides the result.
post-image
$AGT BOOM😨 It’s flying up again, damn. LONG was doing great, then turned around and went SHORT. Nothing to do but keep grinding; the rewards will come soon😎😎
SHORT SHORT SHORT🔥🔥AGT congabeo$BT $MAGMA
CPIWatch
post-image
MAGMA+2.67%
Same range just chop all around for $ETH .
Deviation? Continuation? Or still chop
ETH-0.93%
The most unusual detail in today’s market action isn’t the declines themselves, but relative strength: $STRK fell 12.04%, $BAT fell 9.28%, while $ENA
in the same sector fell just 5.23%. Its RSI of 37.4 is also higher than STRK’s 31.3 and BAT’s 36.7. The smaller decline and higher indicator suggest selling pressure has been released more gradually, with funds not rushing for the exits.
But relative resilience doesn’t mean a reversal is underway. ENA is currently at 0.1885, still below MA5=0.18964 and MA20=0.193345, with the bearish moving-average alignment yet to recover. The MACD histogram
post-image
STRK-12.61%
BAT-9.83%
ENA-5.35%
Online Lending Life with a market cap of 110k—are you sure you don't want to buy?
My friend shorted $AGT , $Q and $BTW today. All three. Same day.
His logic was solid: “It’s already up 65%. It can’t go higher.”
$AGT hit 0.1048 and kept going.
Then he said, “Okay, $Q is up 119%. That’s insane. Now THIS one has to dump.” It printed another green candle while he was typing the order.
By then he was angry, so he went for the third one: “$BTW is only up 34%, there’s still room for a clean short.” The chart made a new high and he made a new lesson.
The funny part is that Q’s funding was negative. Shorts were paying longs to stay in the trade. He literally paid a fee to be wrong
post-image
AGT+40.60%
Q+117.46%
BTW+26.01%
  • 1
$XRP bulls, this is your moment to show up
we’ve been printing lower highs and lower lows inside this channel, and price is approaching the area where a reversal could start
reclaim $1.40–$1.45 and the setup going to be more interesting
until then, it’s a potential breakout, not a confirmed one
Wait to plan your juicy R:R ahead
XRP-1.27%
  • 1
Bitcoin Support and Resistance Levels
live-cover
LIVE146
$SAND Bottom line: Short-term bias is bullish, but this is a short squeeze driven by crowded shorts, not a trend reversal. Wait for a pullback confirmation before chasing higher.
The funding picture is the key factor right now. The funding rate is -0.1930%, making it extremely costly to hold short positions, while the price has risen 9.97% over 24h to 0.05978, indicating that shorts are being squeezed and funding is being pushed toward the long side. But beware: the MACD histogram remains negative at -0.00023, and the RSI is only 52.7, so momentum is unconfirmed; the range over 30 candles is a
post-image
AVAX-1.79%
#KOSPIJumps3.3% #ShareWeekly
KOSPI Rebounds After a 7.6% Crash: Is the Semiconductor Sell-Off Over, or Is More Volatility Ahead?
The Asian stock market experienced a dramatic shift on October 15–16, 2026, as semiconductor stocks came under heavy selling pressure before staging a partial recovery. South Korea’s KOSPI index suffered a sharp 7.6% decline on October 15, dropping to 5,554 points and triggering a circuit breaker. The index touched its lowest level since April, highlighting how quickly market sentiment can change when inflation concerns, interest-rate expectations, and uncertainty s
SK Hynix+0.79%
JPN225+0.00%
NAS100-0.37%
CXMT-1.15%
Load More

Join 40 M users in our growing community

⚡️ Join 40 M users in the crypto craze discussion

💬 Engage with your favorite top creators

👍 See what interests you

Trending Topics

USSeptemberPPIBeatsExpectations

91.35k Views1.93k Discussing

US September PPI came in at 6.3% YoY, well above the 5.3% market expectation, pointing to renewed producer-side inflation pressure. Weekly jobless claims were 199K, broadly in line with forecasts. Could hotter inflation further reduce room for rate cuts, and what does it mean for $BTC, US stocks, and gold?

GateWCTCS9GlobalTradingCompetition

37.87k Views6.68k Discussing

GateBTCAndETHFuturesVolumeRanksTop3

53.8k Views1.81k Discussing

View More