Square
Following
Hot
News
Notifications
Profile
Share your thoughts
placeholder
Article
On the Nature of Marriage
After reading this, do you still want to get married?
rotated more cash into my ETFs yesterday
trend is your friend, no individual stocks for now
$SPX $NASDAQ
SPX+0.33%
Trenches
FIONA
F
bade
b
FIONA
B34n...pump
Market Cap
$.
Change
.
24h Vol
$
Holders
.
PIEVERSE
P
bade
b
PIEVERSE
0x0e...25a9
Market Cap
$.
Change
.
24h Vol
$.
Holders
.
mihao
m
bade
b
mihao
4Cxj...pump
Market Cap
$.
Change
.
24h Vol
$.
Holders
.
CLAUDIA
C
bade
b
CLAUDIA
2j5S...W2ZM
Market Cap
$.
Change
.
24h Vol
$.
Holders
.
IDOL
I
bade
b
IDOL
0x3b...ab07
Market Cap
$.
Change
.
24h Vol
$.
Holders
.
BTC Falls Below 58,000 USDT, Down 7.75 in 24 Hours
live-cover
LIVE3,426
BTC-0.67%
ETH-1.26%
SOL-0.77%
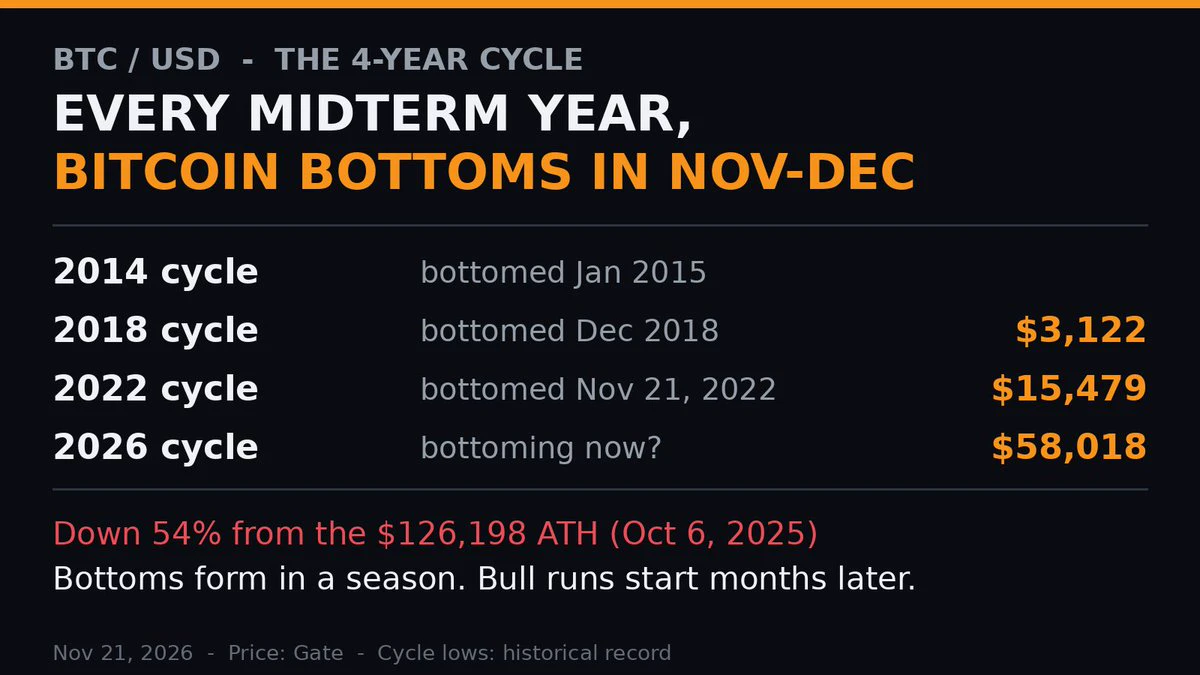
Every midterm year, Bitcoin bottoms in Nov–Dec.
2018: bottomed in December
2022: bottomed Nov 21 — 4 years ago today
2026: $58,017, down 54% from the $126K ATH
The bottom is a season, not a day. The bull run comes months later.
post-image
BTC-0.67%
$KOR Those who were too slow to sell will regret it, mlb
post-image
  • 3
Goldman Sachs thinks the stock selloff could get worse next week.
The question behind it is simple. Will the trillions going into AI chips, data centers and compute actually pay off?
Nasdaq fell 4.87% on Friday. Nvidia dropped 12.69%. The S&P 500 and the Dow are now in correction.
Goldman's bitcoin-sensitive stock basket is already down 11%.
Right now Bitcoin is moving with the AI trade. Until that question gets answered, crypto is riding in the same car.
GS-6.73%
NDAQ-0.95%
NVDA-13.84%
SPX500+0.19%
DOW-4.03%
Sun is trying to become the Nobel Prize of AI, huh?
But your bro Sun never makes a losing deal.
The marketing value this award brings is definitely greater than $2 million.
post-image
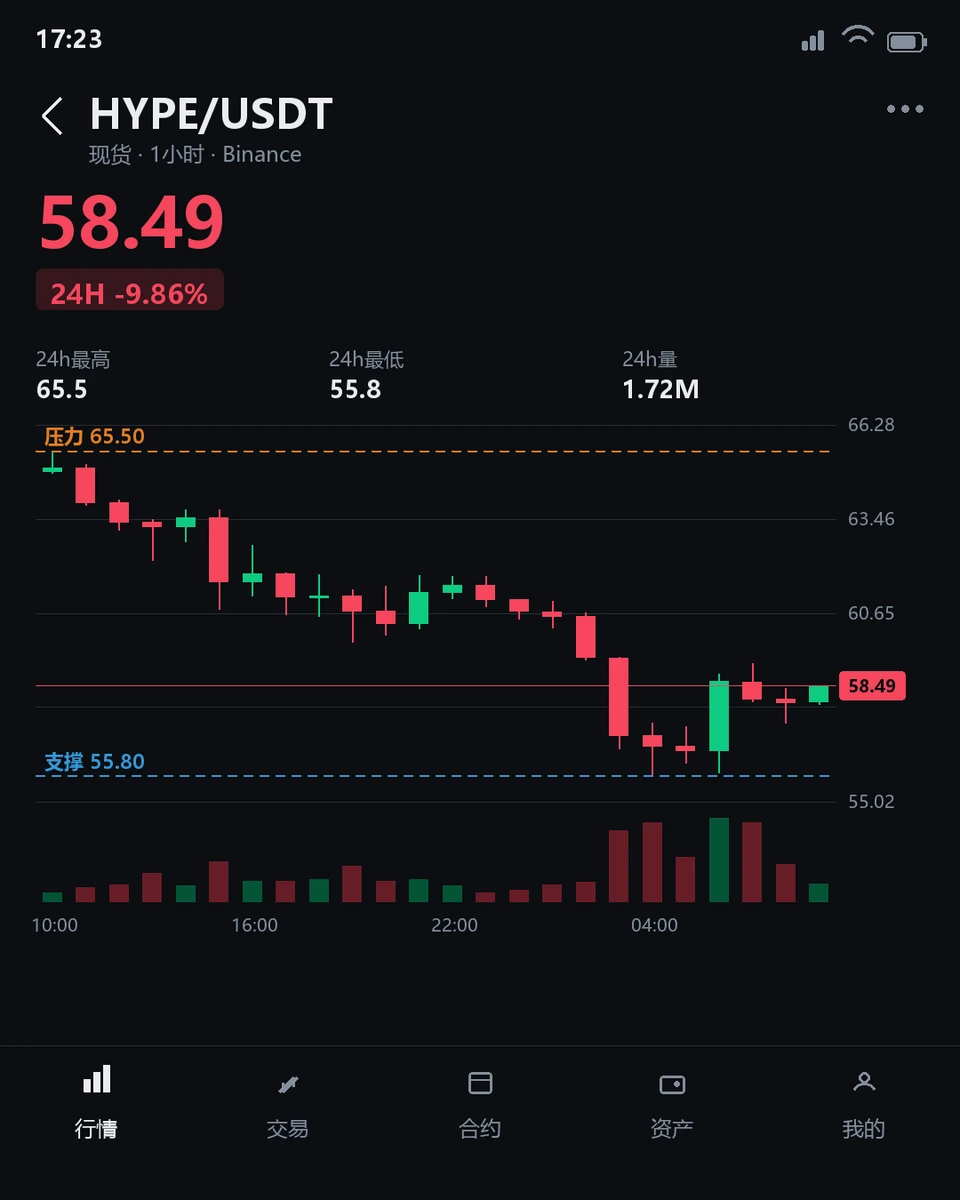
$HYPE Oversold ≠ Bottom: A Clash Between Rebound Demand and Structural Weakness

$HYPE is currently trading at $58.34, down 10.90% over the past 24 hours, with an intraday range of 55.8 to 65.55. The 1-hour RSI14 is 37.51 (neutral to weak), while the 4-hour RSI14 is just 19.99 (deeply oversold), showing a clear divergence between the two timeframes. This structural contradiction reveals the core tension in the current market: the battle between fading short-term momentum and an intermediate-term trend that has yet to bottom.

The key point to watch is that support on both the 1-hour and 4-hour
post-image
HYPE+0.24%
🚨 REKT: The overall crypto market shed $200B in under 24 hours.

$BTC ‌$ETH ‌#ShareWeekly
#BTCBreaksBelow60K
BTC-0.67%
ETH-1.26%
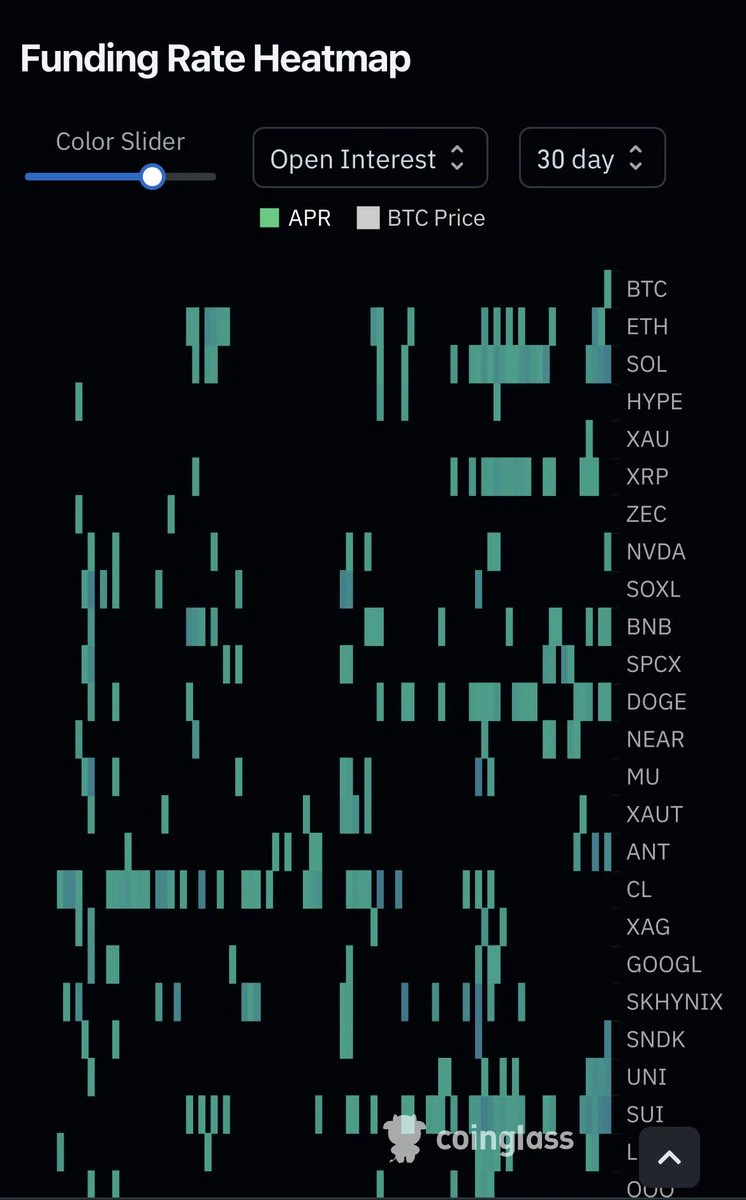
Funding rate for Bitcoin has gone negative for the first time in 30 days.
On an annualized basis it’s only -1%.
Shorts aren’t even aggressive yet
post-image
BTC-0.65%
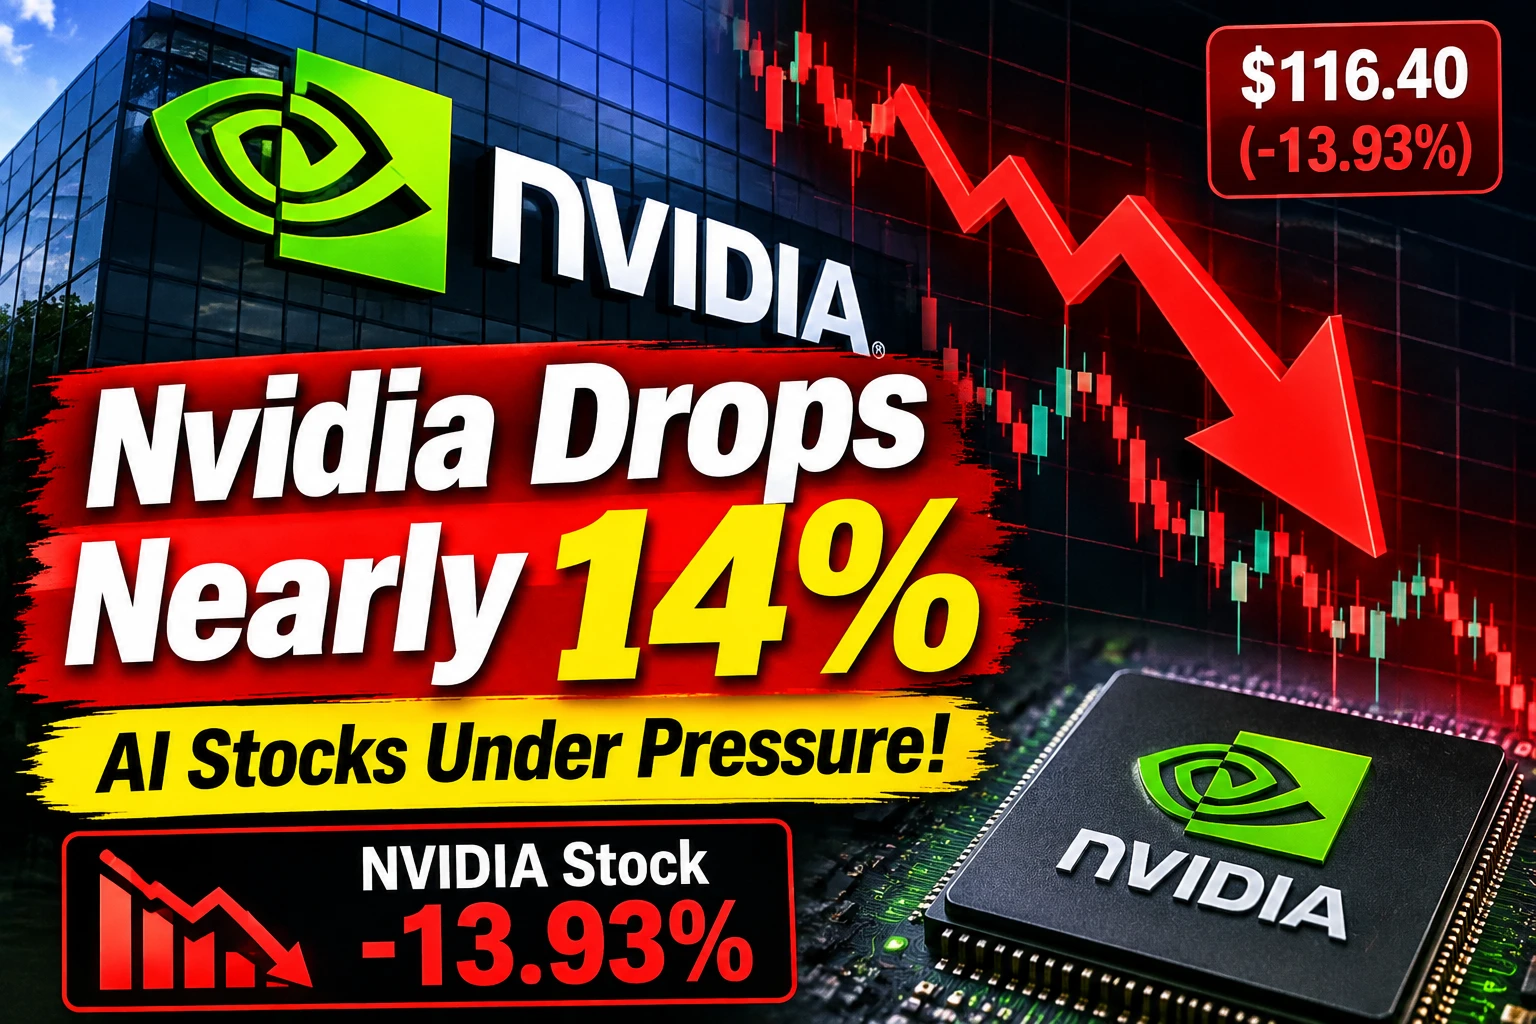
#NvidiaDropsNearly14Percent

Nvidia is facing a major sell-off, with the stock dropping nearly 14% and putting renewed focus on the broader technology and AI sector.

The sharp decline has increased market volatility and raised questions about investor sentiment toward high-growth AI companies. Nvidia has been one of the biggest beneficiaries of the AI boom, so a move of this size is significant for both equity traders and the wider tech market.

A decline of nearly 14% can quickly change the short-term market outlook. Traders will now be watching whether buyers st
post-image
NVDA-13.84%
EVAA | Long 🟢 | Bullish | 15m | 24-hour change: +21.09% | Volume: 451.7M USDT. Long rationale: Price is above EMA200; EMA20/50/200 are in bullish alignment; RSI14 is 69.0; MACD histogram is positive; ADX14 is 19.9; volume is 1.21 times the 20-candle average; breakout from the 20-candle range. Entry price: 6.5932. Stop-loss: 5.93801. Take-profit 1: 7.41218 | Take-profit 2: 7.90357 | Take-profit 3: 8.55876. Entry price is for reference only; do not chase the rally. The strategy is invalidated if the stop-loss level is hit. Technical analysis only; this is not investment advice. $EVAA
post-image
EVAA-0.49%
I just finished looking at this set of data, and honestly, it’s hard to laugh. Over the past year, people holding $BTC , $ETH , and $ZEC have seen their account charts move in basically the same direction—down.
Bitcoin is down 6.1% over the year, Ethereum 6.34%, and ZEC got hit even harder, dropping 11.01%. Three assets, three different narratives, but the final report card looks like a copy and paste. You call that risk diversification? It looks more like sinking together.
If someone had told you a year ago, “Just hold on,” you’d probably only want to reply: What I held onto was my position;
post-image
BTC-0.67%
ETH-1.26%
ZEC+1.16%
This candle came from Eagle's close-out... at 1x, and the position wasn't even fully closed. The impact is really too great now
However, our average entry price will be a bit better than Eagle's. Even with slippage, it's about the same overall. One really tricky issue is that the instant price swings when Eagle closes altcoin positions are too large. Sometimes setting the closing delay very low actually leads to more slippage... but we can't set it too high either
If you're concerned, you can manually take profit on part of your position when you see an altcoin~ I'm still continuously optimizi
post-image
  • 1
  • 2
#weeklyshare
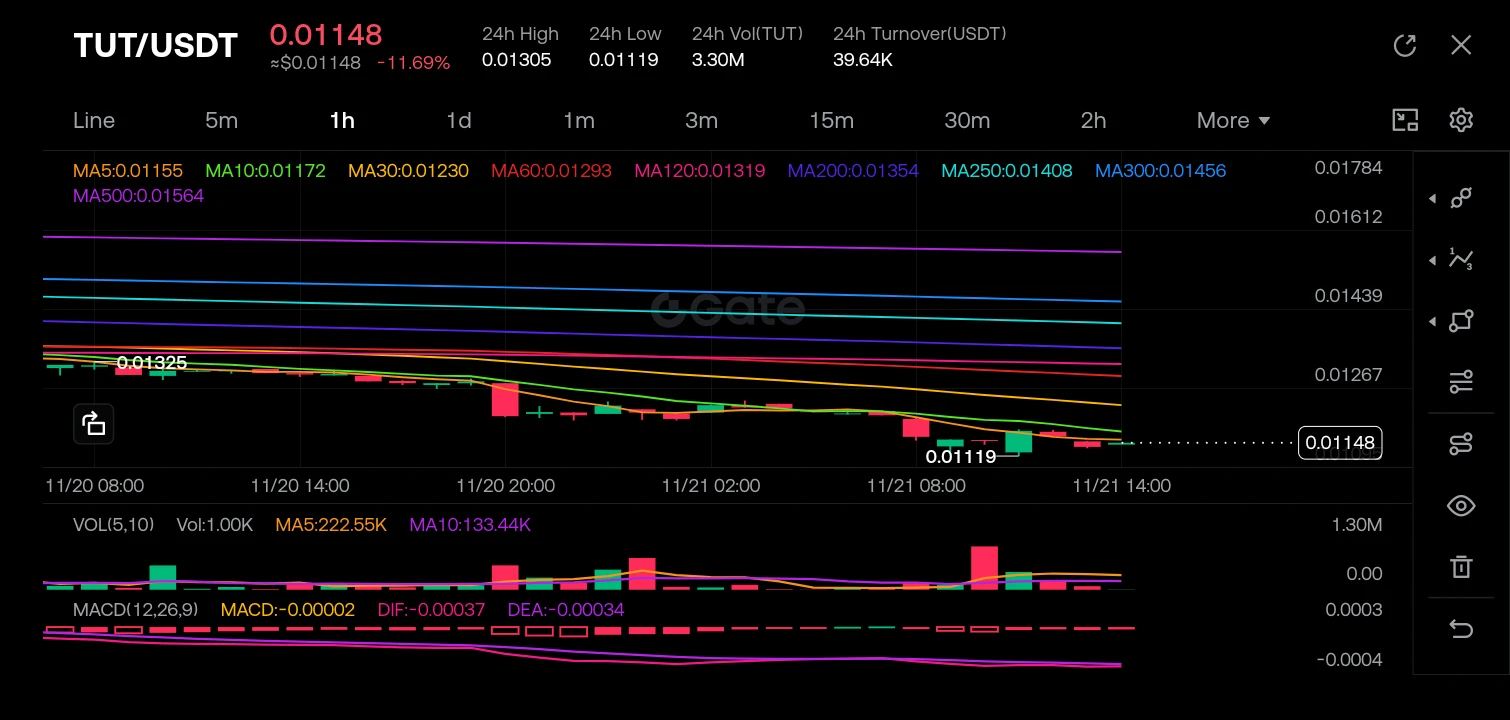
$TUT ‌

The Liquidity Trap: Decoding the TUT/USDT Downtrend from Macro Distribution to Micro Capitulation.

In the realm of cryptocurrency trading, price is merely the shadow of liquidity. We do not trade the red and green candles; we trade the flow of capital and the emotional extremes of the crowd. The TUT/USDT chart currently presents a textbook example of a bearish structural breakdown. By aligning the macro flow of whale distribution with the micro flow of liquidation cascades, we can identify why the market is overextended and where the next high-probability entry lies.

E
post-image
TUT-2.02%
  • 1
#BTCBreaksBelow60K

Bitcoin has broken below the psychologically important $60,000 level, putting the crypto market under renewed pressure. The move comes after a period of increased volatility, with sellers gaining control and pushing BTC into a key support zone.

The break below $60K is more than just a round-number move. This level has been closely watched by traders and investors, and losing it can increase fear, trigger stop-loss orders, and create additional selling pressure across the broader crypto market.

The next question is whether Bitcoin can quickly reclaim $60,000 or whether the
BTC-0.67%
[New Streamer] Market Prediction
live-cover
LIVE2,786
BTC-0.67%
SOME PEOPLE WILL MAKE MONEY OFF GTA 6 WITHOUT PLAYING A SINGLE MINUTE.
They're not gamers.
They don't show their faces.
They don't know how to edit.
They hand a free repo to Claude Code and let it do the work.
Here's the whole process:
→ copy the repo link
→ paste it into Claude Code
→ pick a stream
→ hit enter
Claude installs everything on its own.
Then it turns GTA 6 streams into vertical clips, ready to post.
It doesn't even wait for the stream to end.
One skill clips finished streams.
The other clips while they're still live.
Right now millions of people are searching for GTA 6 clips at th
post-image
The meaning of life is to feel good!
It doesn’t matter whether you’re poor or rich. If you want to enjoy life, you can do this. Get your priorities backward, and you’ll suffer.
post-image
Load More

Join 40 M users in our growing community

⚡️ Join 40 M users in the crypto craze discussion

💬 Engage with your favorite top creators

👍 See what interests you

Trending Topics

BTCBreaksBelow60K

2.1M Views29.4K Discussing

BTC fell below $60,000 on November 20 for the first time since July, alongside a tech stock selloff and broader pressure on risk assets. Will $60K become resistance, or can BTC quickly reclaim it? What price or volume signals would convince you that selling pressure is easing?

GateDirectIPOPhase3ANTAllocates92100Shares

750.8K Views4.8K Discussing

NvidiaDropsNearly14Percent

315.2K Views7.5K Discussing

View More