









Square
Following
Hot
News
Profile
Share your thoughts
placeholder
Article
BREAKING:
US CPI data came in at 3.7%
Expectations: 3.6%
post-image
#StrivePlans500MillionRaiseToBuyMoreBitcoin
🚨 $500 MILLION BITCOIN POWER MOVE? STRIVE WANTS TO EXPAND ITS BTC TREASURY!
₿ Bitcoin Demand | Institutional Capital | Market Liquidity | Price Levels | Risk Analysis | My BTC Outlook
What happens when a company plans to raise $500 million while Bitcoin is trading near $83,000?
Could this become another important institutional demand catalyst? Could corporate accumulation help BTC reclaim $85,000 and eventually challenge $90,000? Or will financing costs, macroeconomic uncertainty, and selling pressure limit the upside?
Strive has announced a propos
  • 2
$WAL When selecting coins, especially when chasing pumps, the first thing we need to look at is trading volume. Volume drives price; if there is no volume behind the trading, don’t enter.
For example, this coin had very little volume during its first rally. If you entered at this point, could you make money? Yes, but it would be very frustrating. So when we trade, we first wait for a surge in volume that can break through a previous high on the left. At that point, you can try entering with a portion of your position. Even if it pulls back a bit, because it rallied on heavy volume, it will gen
post-image
WAL+39.13%
A major CPI release is coming tonight! If inflation exceeds expectations, the Federal Reserve may
live-cover
LIVE2,527
$OP 24 hours +9.22%, but what is most worth debating now is not the percentage change, but which one is lying: the 1-hour or 4-hour chart.
I’m only watching one divergence: whether it can quickly reclaim 0.139 after breaking below it. The current price is 0.148, with volume at 0.26x. The 1-hour chart is relatively weak while the 4-hour chart is relatively strong, with RSI at 12 and 57, respectively.
If it breaks above 0.1625 and volume continues to increase, the initiative will shift toward the bulls; if it breaks below 0.139 and fails to reclaim it, the short-term outlook is invalidated, and
post-image
OP+3.90%
$ZEREBRO I almost gave back all the money I made at the start of the year in this move. I got buried chasing the rally at 0.047 last time, held for three days, and finally cut my position at 0.028, taking a full loss of 47,000 U. My account shrank by a third overnight. I genuinely couldn't sleep those days, staring at the candlesticks and wanting to slap myself.
After cutting my position, I didn't leave. I put it back on my watchlist and let it sit. Looking at the data again over the past two days, I noticed a few things I'd overlooked before.
It's currently at 0.0329, up 23.58% in 24 hours, w
ZEREBRO+20.75%
Oh my god
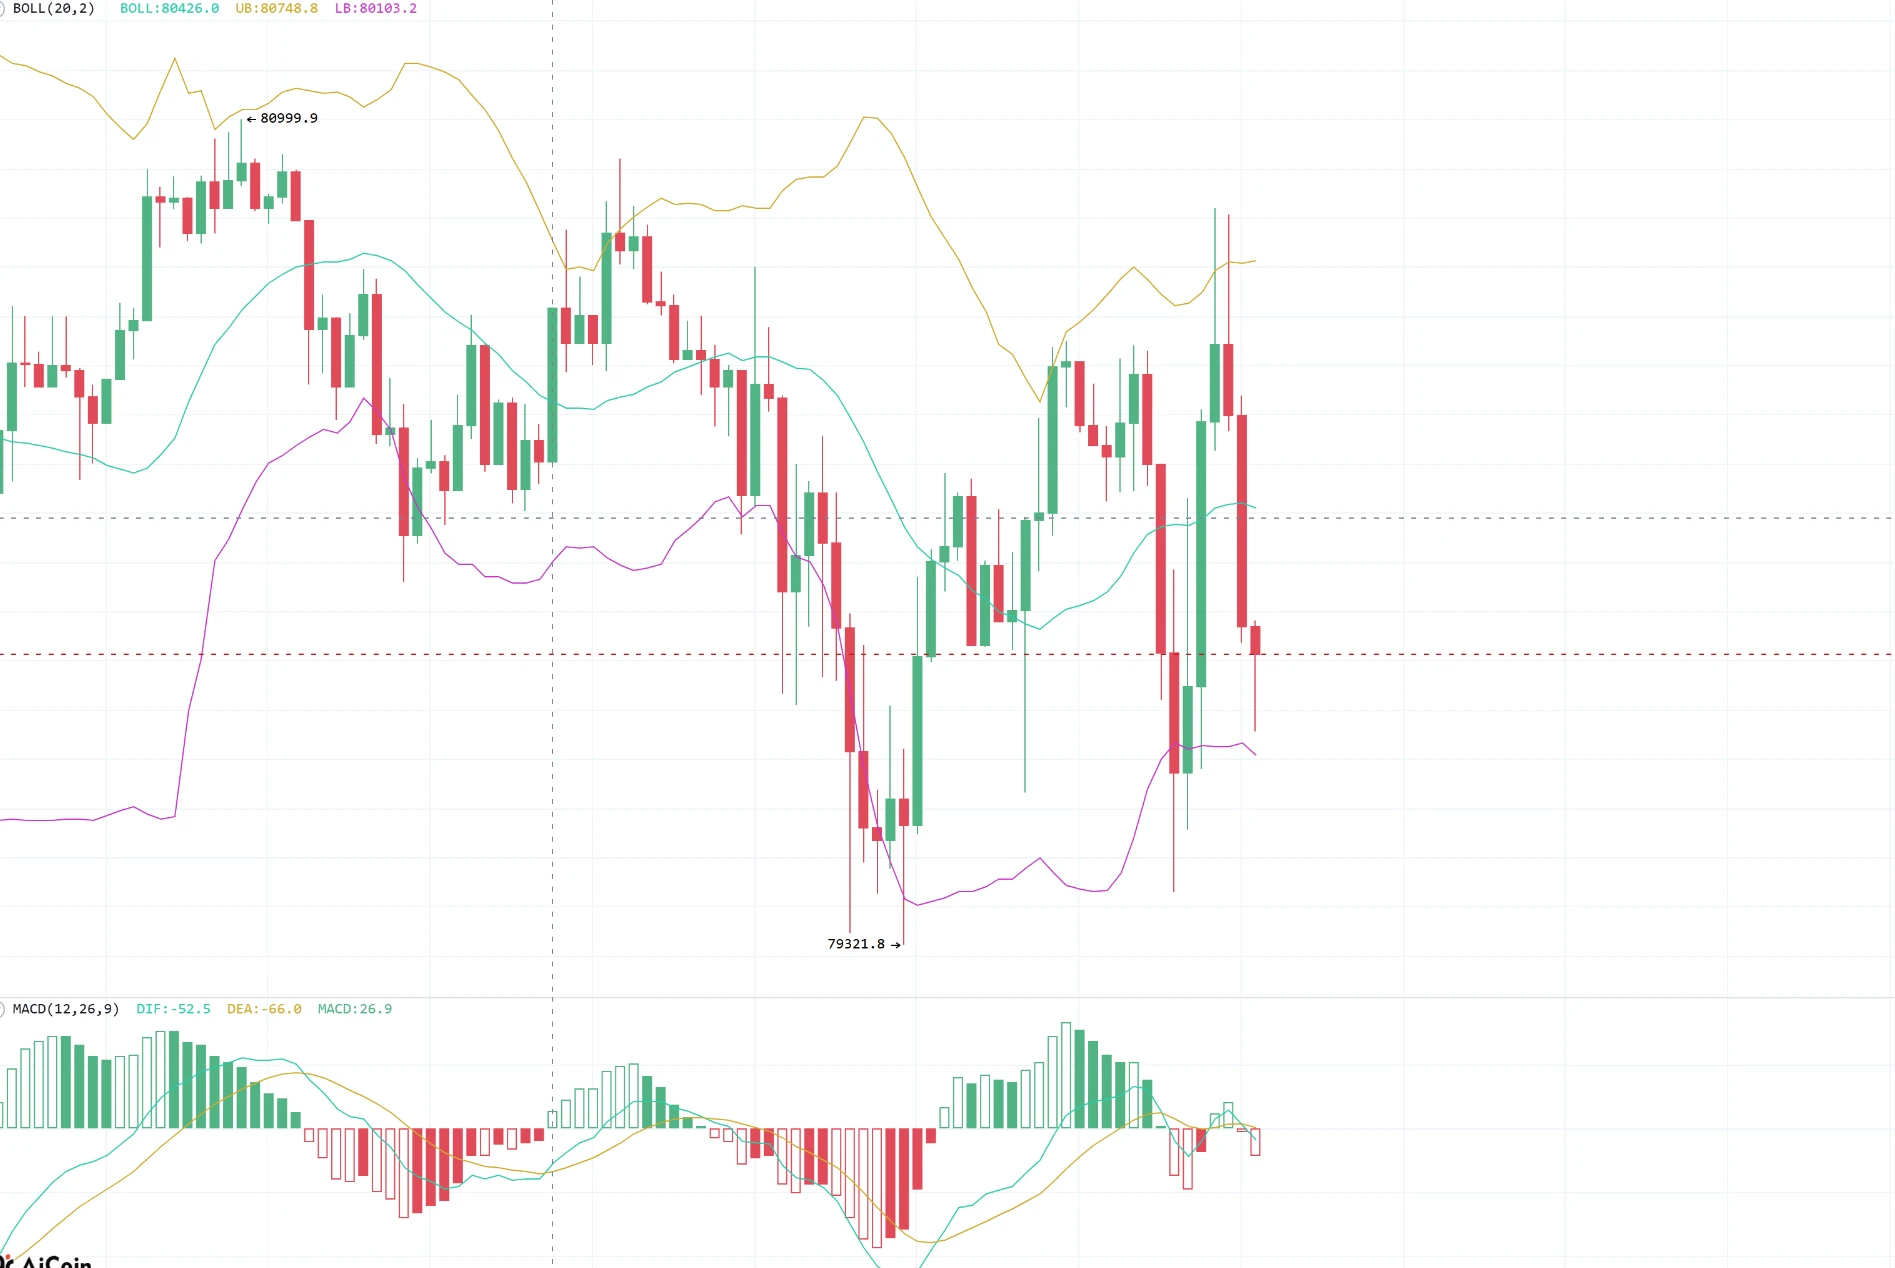
As soon as 8:30 hit,
there wasn’t even any news yet,
and a single line came crashing down……
That’s terrifying😱
post-image
Sold a big A7 too early $btw —I'm in tears
BTW+25.86%
  • 4
  • 2
Current situation of selling Claude on Xianyu
Keyword “5x”🤣
post-image
$BTW , let's do another 6.66666 and 8.88888. I don't even dare move—just watching him perform~
BTW+25.86%
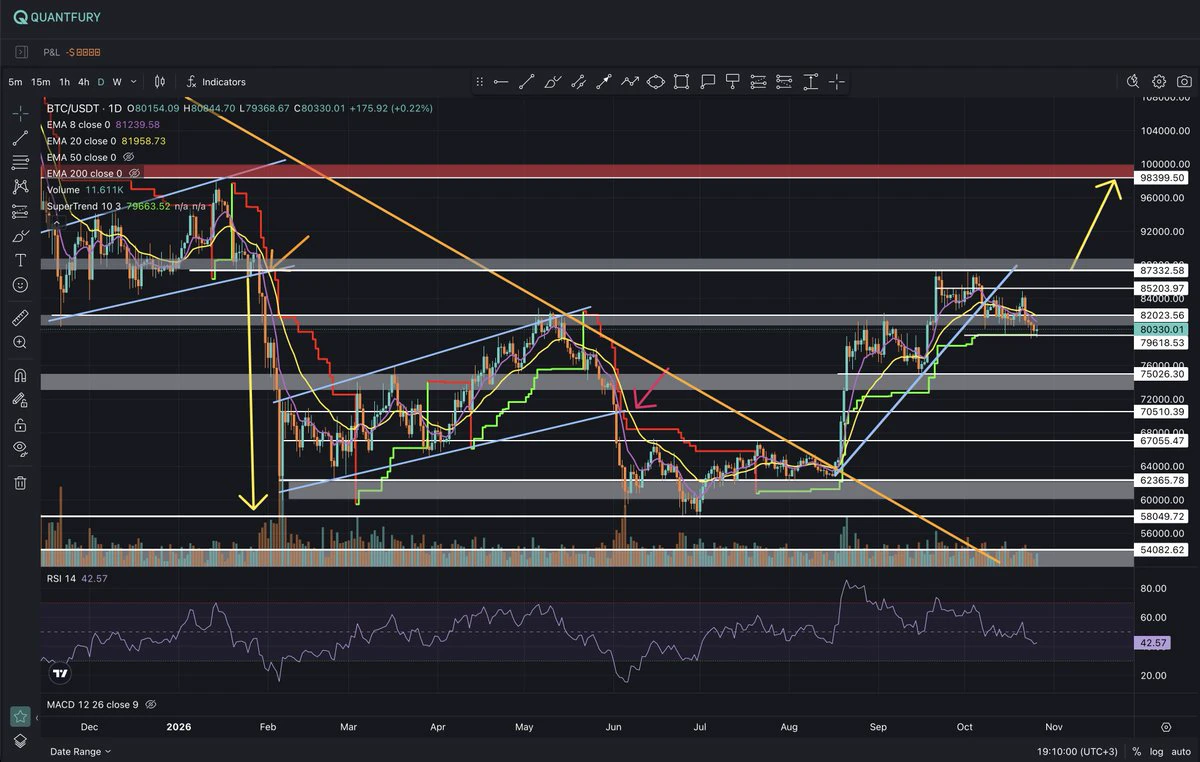
Bitcoin keeps shrugging off bad news. Last week spot ETFs bled $681M — worst week in four months — and BTC still walked into today around $83.5k, back above the 20-day EMA and holding the $82.3k breakout shelf from the Oct 8 washout.
Now the tape flipped: yesterday's +$175M was October's second-biggest inflow day, Fidelity leading with $103M. The map is simple: $84k is the first ceiling, $87k is the real test, $80k–$81.5k is the floor — that's the ETF cost basis zone, and whales have reportedly started buying again after a year of selling. CPI prints today, which could rewrite all this by aft
BTC-0.56%
  • 2
$LUNC is holding the HTF horizontal support and the rising trendline.
Price is ~0.000049. VWAP is leaning bullish. Long while that floor holds. Next is a bounce off the zone.
A daily close under the trendline and support kills it.
post-image
LUNC-1.50%
$MITO #MITO
Trying to clear a multiple resistance zone.
Breakout could follow our projection for 100-110% rise during coming sessions ✍️
post-image
MITO+10.99%
20:12, I just finished looking at the $ETH evening spike.
Someone in the group asked: Is this about to break down?
Question: Why didn’t 2529.24 hold after surging up?
Answer: The day’s heaviest volume bar closed where it started, leaving the wick for nothing.
Question: What about 2478.17?
Answer: Two hours later, it stabbed down on its own and climbed back up on its own, leaving a long lower wick beneath.
Question: Which direction does this count as?
Answer: It swept both sides, and neither side won. 24h +0.64%, with a 2% range.
The current price is 2514.85, less than 1% from the 20-day movin
post-image
ETH-0.83%
【October Crypto Market & BTC Intraday | October 14】
BTC is currently trading at approximately $83,400. On the daily chart, it remains above the EMA30 (approximately $82,386), but the MACD is still weak, while the RSI is around 53, indicating a corrective consolidation after the pullback. On the 1-hour chart, BTC is moving sideways around $83,000–$84,300, with no clear short-term direction yet.
Intraday levels to watch:
Resistance: $84,100–$84,350; a breakout could target around $84,800.
Support: $83,000–$82,800; a breakdown would bring the previous low zone of $81,000–$80,345 into focus.
Since
post-image
BTC-0.56%
ETH-0.81%
A look back at our @Sibos 2026 dinner in Miami.
During Sibos, Kaiko co-hosted an intimate dinner with @ledger_business and @chainalysis joined by @FrancisSuarez. The evening brought together leaders across banking, custody, and digital asset infrastructure.
Thank you to everyone who joined us for the evening.
🧊 ICE TRADER LIVE | What's Happening in the Crypto Market Today? 🚀📊 | BTC & Altcoins Update 🔥
live-cover
LIVE2,587
ETH Falls to 2,500—On CPI Night, Ethereum May Be More Dangerous Than Bitcoin

When discussing CPI, everyone is focused on BTC. But I think ETH may need more caution than BTC tomorrow night.

First, let's look at the data. ETH is currently around $2,500, down 1.73% over the past 24 hours. Earlier, it briefly fell to $2,412, with its 24-hour decline exceeding 5%. Since early October, ETH has clearly underperformed BTC.

Why is ETH more dangerous? Three reasons.

First, ETF funds are continuing to flow out. Ethereum ETFs have posted net outflows for nine consecutive trading days, with cumulat
AMD+1.91%
#USCPISoon #ShareWeekly
The financial markets are approaching another critical moment. Tonight 20:30 U.S. Consumer Price Index (CPI) report could influence expectations for Federal Reserve policy, reshape short-term sentiment across risk assets, and add another important variable to the political and economic outlook ahead of the November midterm elections.
For crypto traders, this is not simply another economic announcement. Inflation data can change expectations for interest rates, influence the U.S. dollar and Treasury yields, and trigger significant volatility across Bitcoin, Ethereum, an
BTC-0.56%
ETH-0.81%
  • 2
  • 1
Can't spell "completely puking" without CPI
#Bitcoin
post-image
BTC-0.56%
Load More

Join 40 M users in our growing community

⚡️ Join 40 M users in the crypto craze discussion

💬 Engage with your favorite top creators

👍 See what interests you

Trending Topics

USSeptemberCPITopsEstimates

35.37k Views2.19k Discussing

US September CPI rose 3.7% YoY, above the 3.6% estimate; core CPI rose 2.6%, also above the 2.5% estimate. With inflation topping forecasts across the board, how will rate hike expectations shift? How will BTC react? Share your view.

DrLinHanSpeaksAtOxfordUnion

134.9k Views1.85k Discussing

GateWCTCS9GlobalTradingCompetition

37.1k Views6.05k Discussing

View More
