Share your thoughts
placeholder
Article
What I said: Chengdu is simply not suitable for working a regular job!
Every day is a workhorse grind📅—I can’t take it!
#成都 #CDC
post-image
Review of Wednesday 9.9: BTC, Shandi
BTC’s broader trend on Wednesday was still affected by the nonfarm payrolls report, with BTC continuing to move weakly lower.
The outlook was clear early Wednesday morning: do not go long. After the morning high around 79,450, we opened shorts with the trend, repeatedly catching short opportunities on BTC’s rebounds, and held positions as it fell to around 77,600 after the U.S. stock market opened. The main strategy for the day was to short every rebound, staying aligned with the broader short-term direction.
Three BTC short trades were successfully capture
BTC-1.25%
If the geopolitical powder keg is truly ignited completely, is your wallet ready?
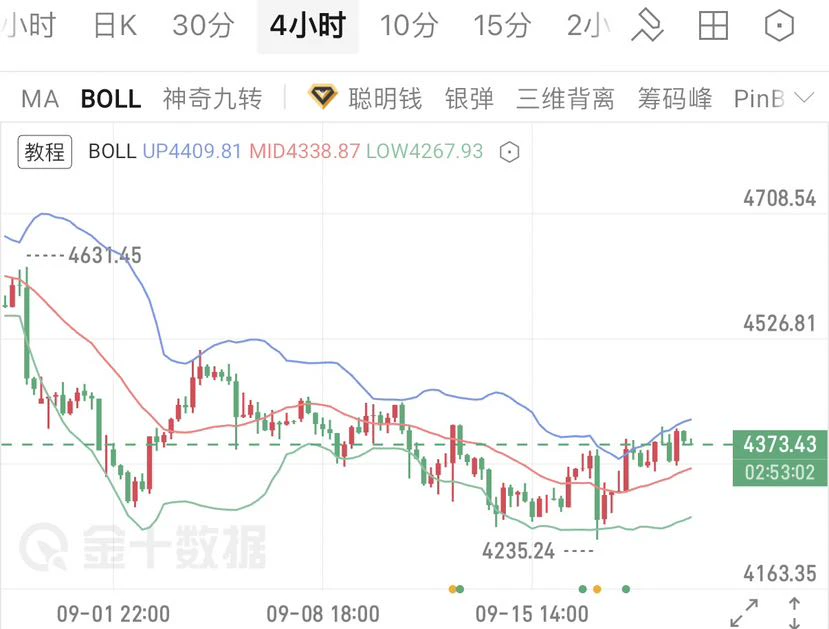
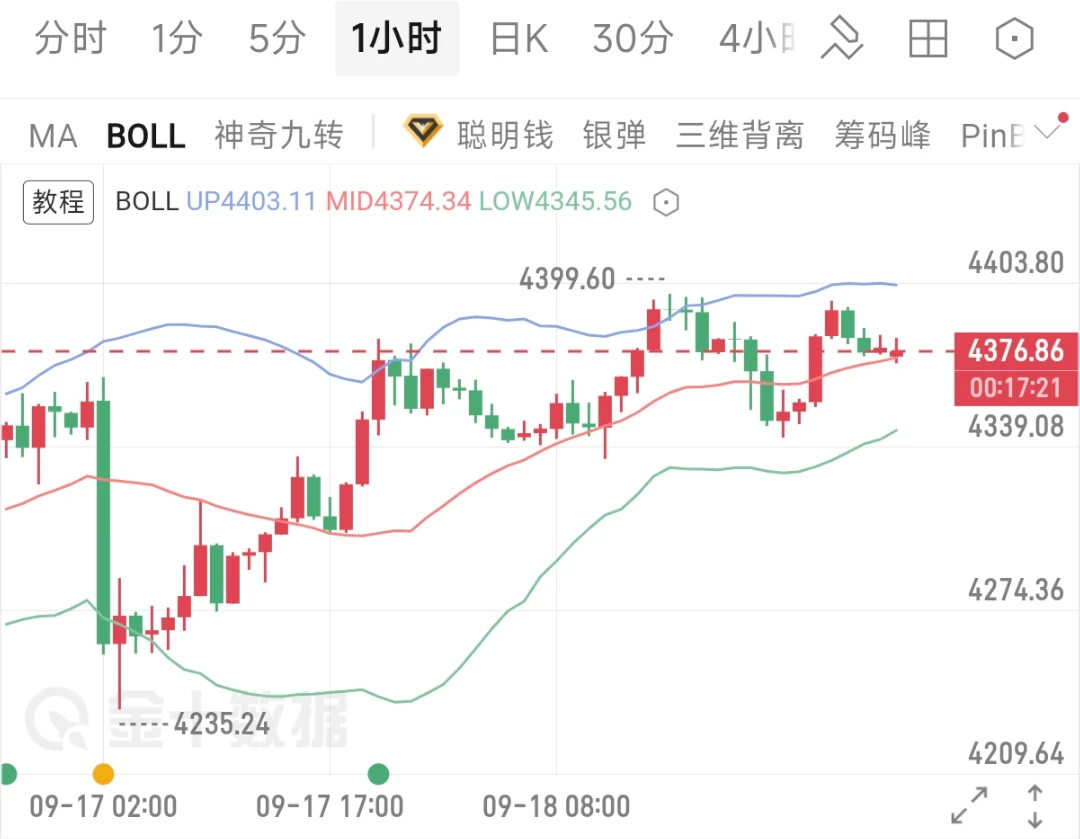
The market is indeed sensing an extremely dangerous smell. U.S. and Brent crude prices have surged, with Brent breaking above $102, while gold has climbed to a high of $4,430. This is not merely capital speculating on sentiment—it is money desperately fleeing and seeking safe havens.
Crude oil surges
Once the Middle East enters a phase of intense confrontation, the Strait of Hormuz, the global oil chokepoint, could face the risk of blockade at any time. As long as the transportation route encounters even a slight
post-image
GLDX-0.16%
PAXG+0.07%
ETH-0.98%
We're seeing Variational flipping TradeXYZ in real time on volume:
US100: 500M on Variational vs 229M on Trade
GOLD: 200M vs 86M
SP500: 124M vs 150M
This is just Variational Swaps, not even adding perps, and they're live for only a few days
Swaps are way more powerful than perps for big markets like commodities, FX or indices because of fixed funding rates
Variational is going to be #1 pretty fast on those markets
post-image
XAU+0.09%
JUST IN: LAPTOP’s multi-sig moved 42.5M tokens to be distributed pre-launch, with 100M token inflow days earlier; community flags tokenomics deviation. $LAPTOP
post-image
$XAG /USDT is about to break range and most traders are not ready for it

$XAG /USDT - SHORT

Trade Plan:
Entry: 67.07 – 67.37
SL: 68.65
TP1: 66.15
TP2: 65.43
TP3: 64.36

Why this setup?
Why now? The daily trend is range, but the 4h structure is leaning bearish, and the 1h ATR of 0.59608 shows enough momentum to sweep liquidity before reversing. The 15m RSI sitting at 61.41 signals the short term is still slightly bullish, which is why we wait for a flush to the entry zone around 67.22. From there, a move toward TP1 at 66.15 is the first target, with TP2 at 65.43 as the real prize for patie
XAG+0.41%
Why is everyone suddenly watching $CL /USDT like a hawk right now?

$CL /USDT - SHORT

Trade Plan:
Entry: 95.08 – 95.40
SL: 97.22
TP1: 93.75
TP2: 92.76
TP3: 91.28

Why this setup?
Why now? The 4h trend is range-bound, which means $CL /USDT has been stuck in a tight corridor and a breakout is overdue. The 15m RSI sits at 45.92, showing just enough bearish momentum without being oversold, so the short still has room to breathe. The 1h ATR of 0.635108 tells us volatility is moderate, making the entry zone between 95.08 and 95.40 a precise spot to initiate the trade. From there, TP1 at 93.75 an
CL+1.54%
  • 2
The fellow trader down to 5K USDT has banked 1,854 USDT from the eighth “dan.” Bitcoin made three short-term rebound attempts toward the 78,500 resistance, but each time it touched this zone, bears launched aggressive sell-offs, causing a rapid pullback under pressure. This clearly proves that the resistance around 78,500 is genuinely effective.

The short setup given this morning successfully secured profits and exited. Continue waiting for a suitable entry point for the next short-term trade.
Keep a close eye on the 77,600 support below. Only if this level is decisively broken will further
post-image
BTC-1.27%
Most progress is invisible until it isn’t you put in the work for weeks or months and nothing seems to change
Then one day it compounds the people who quit early never stay long enough to see the shift
post-image
🚀 CATE/USDT Market Analysis: The Bulls Are in Control!
The meme coin sector is heating up again, and CATE/USDT is leading the charge with an impressive breakout. After finding a rock-solid floor, Catecoin has triggered a massive rally, catching the attention of spot traders across the board.
Here is a technical breakdown of why CATE is currently one of the strongest performers on the market.
📊 Key Technical Highlights:
Explosive Price Action:
CATE has surged over +32% in the last 24 hours, jumping from a baseline support near $0.02400 to test local hi
CATE+38.42%
  • 5
  • 2
Yesterday, Bitcoin came under pressure after rebounding to around 79800 and oscillated downward all the way, touching a low of around 77700 in the early hours. The move fully matched our expectations, and our short around 798 delivered a solid 2,000-point pullback!
From the current chart, the daily upper Bollinger Band is turning downward, and the price has fallen back below the middle band. The bullish uptrend structure has been broken, with 80832 constituting strong resistance above. The 4-hour Bollinger Bands are opening downward, with the price running below the middle band and the highs g
post-image
BTC-1.27%
🤖🔥 GATE BOT CAMPAIGN IS LIVE!
Sign up on Gate and claim 10 USDT Bot Trial Fund! 🎁
🎁 10 USDT Bot Trial Fund
🎰 Lucky Draw — Complete trading tasks through Gate Bots and earn lucky draw chances!
💰 Rewards will be provided in the form of Bot Trial Funds, which can be used for Grid Trading.
👉 Join Now:
https://www.gate.com/campaigns/6226?ref=HARRYPAK&ref_type=132
⚠️ Terms & eligibility apply. Trade responsibly. DYOR.
#Crypto #CryptoTrading #TradingBots #GridTrading
I think the timing of the second round depends on whether interest rates are raised
No rate hike: the second round begins
Rate hike: the second round begins after the drop is over
A lot of tokens could fall straight back to the first support level before the takeoff if another major drop occurs
If there is a rate hike, the market caps at which to buy the following tokens in the short term are
$Marscoin 90M
$牛来 65M
$哈基米 30M
I still remember that SOL AI run
The first wave of the drop was extremely terrifying
The rise in the second round was equally terrifying
post-image
MARSCOIN-29.46%
牛来-23.77%
哈基米-29.22%
SOL-2.40%
Market Trend Analysis
live-cover
LIVE1,187
The 2-hour K-line Bollinger Bands are narrowing, with the moving averages entangled as bulls and bears enter a battle phase. The 15-minute timeframe is weak, with rebounds likely to encounter moving-average resistance. Short-term volatility is narrowing, and a trend-change window is approaching.
Ranging markets are most likely to repeatedly trigger stop-losses. Suggested approach: try a long after a pullback stabilizes at 77800, with a stop-loss at 77600; try a short if the rebound faces resistance at 78500, with a stop-loss at 78750. False breakouts are common in ranges, so use a light positi
post-image
BTC-1.27%
ETF funds haven’t fully fled, but BTC was pinned down by macro factors first
The most noteworthy thing about Bitcoin over the past two days is not that ETF flows turned negative for a single day, but that fund flows and price have begun to diverge.
From September 2 to 4, U.S. spot Bitcoin ETFs recorded net inflows for three consecutive trading days, totaling approximately $1.01B, including roughly $731 million in inflows on September 3 alone. By September 8, the overall flow had turned into a net outflow of $46.6 million, with the main pressure coming from a $65.5 million outflow from GBTC; me
post-image
BTC-1.25%
GBTC-0.27%
BITB-0.27%
BZ+0.76%
  • 1
#BTC - $90K Is the 100 EMA Gate 👀:
The 5D chart is very clear.
The 100 EMA has been one of the cleanest macro $Bull/ $Bear signals for #BTC.
History shows:
▫️ Close below 100 EMA = bear market pressure
▫️ Close back above 100 EMA + retest + bounce = bull market confirmation
▫️Right now, bitcoin:native is approaching the same decision line again.
▫️The level is: $90K
For me:
▫️5D close above $90K = macro bull structure returns.
▫️Retest + bounce = confirmation.
▫️Failure below it = caution remains.
▫️The chart is not complicated.
▫️The 100 EMA is the gate.
▫️ bitcoin:native needs to break it,
post-image
BTC-1.25%
The hand that set the stop-loss a few days ago trembled slightly; this morning, I realized that was unnecessary filial piety.

During the repeated intraday swings, $AKE hugged the upper boundary for a long time. The price looked resilient, but trading volume grew increasingly thin. The higher it went, the less sincere it looked. This kind of low-volume push higher often needs a bearish candle to bring it to an end. After opening a short at 0.0187058, I didn’t keep fiddling with it. I placed the stop-loss above a key level, then went to do other things. When I came back just now, the price ha
post-image
AKE+1.77%
LAB-26.54%
SOL-2.40%
A new day is here already 😇
Woke up to a deal this morning
If you have 5k and above followers and genuine engagement, drop a comment.
I will be picking few for the job
post-image
Load More

Join 40 M users in our growing community

⚡️ Join 40 M users in the crypto craze discussion

💬 Engage with your favorite top creators

👍 See what interests you

View More