Share your thoughts
placeholder
Article
Contract Radar monitors $EN , a token ushering in the bull market, surging upward amid explosive short liquidations! Institution-linked addresses and whale buy orders are continuously pushing it higher! Long signal!
$ZAM A reversal-driven surge is imminent; project and market-maker funds are continuously rotating to drive up the price, with short-seller fuel providing an extra boost! Long signal!
$IN Taking off on the spot! U.S. capital institutions have launched injETF, with massive capital inflows driving up the price and igniting overbought sentiment! Long signal!
post-image
IN+2.93%
[Mid-Autumn] Bulls vs bears at peak intensity! BTC / ETH Market Updates
live-cover
LIVE2,719
$BTC big Long DCA Day 10, everyone.
Entry 81500-80500, stop loss 79500, take profit 82700-83900 Long $BTC 👇$BTC is still forming this megaphone pattern. Honestly, I don't want to stand in front of it here. This structure was built through trapping mechanisms on both sides. The price first takes out the previous high, luring in breakout longs, and then reverses. Next, it takes out the previous low, attracting new shorts, and then rebounds. Long trap → short trap → long trap. This compressed state usually can't stay quiet forever. If BTC breaks out and closes above the upper boundary (approxima
post-image
BTC+1.05%
Insiders are quietly setting up a short on SYMBOL right now.

$ADA /USDT - SHORT

Trade Plan:
Entry: 0.2259 – 0.2275
SL: 0.2340
TP1: 0.2212
TP2: 0.2176
TP3: 0.2121

Why this setup?
Why now? The 4h trend is range-bound, but the 1h price is sitting at 0.2267, which lines up perfectly with the entry zone of 0.2259 to 0.2275. The 15m RSI is at 49.75, showing just enough bearish momentum to favor a move down rather than a bounce. The 1h ATR of 0.003045 tells us the current volatility is tight enough that a break below 0.2259 could accelerate quickly toward TP1 at 0.2212 and then TP2 at 0.2176. T
ADA+3.56%
Same as I said
The Nasdaq will take off in the second half, after the midday session ends
Soar skyward
$NAS100
post-image
NAS100+0.81%
Everyone is missing the short setup forming on BNB right now.

$BNB /USDT - SHORT

Trade Plan:
Entry: 768.9 – 771.3
SL: 785.3
TP1: 758.7
TP2: 751.1
TP3: 739.7

Why this setup?
Why now? The 1h price is sitting at 770.2 inside a defined entry zone between 768.9 and 771.3, giving us a precise trigger. The 15m RSI is at 59.57, showing room to run lower before overbought territory kills momentum. The 1h ATR is 4.875616, which means the average hourly move is large enough to reach TP1 at 758.7 and TP2 at 751.1 without getting chopped out. The daily trend remains bullish, so this short is a revers
BNB+1.53%
  • 1
$BTC BTC/USD – Resistance Rejection & Downside Target
BTC/USD is facing strong resistance around **81,600** after a sharp bullish move. Price is currently consolidating near **81,240**, showing signs of rejection below the resistance zone. A breakdown from the current range could trigger a short-term pullback toward the marked target.
**Target:** **80,021**
**Resistance:** **81,600**
**Major Support:** **75,200**
**Trade Idea:** Bearish below the **81,600 resistance zone**, targeting **80,021** first.
post-image
BTC+1.12%
🔵 $SUI AT THE BIG TEST
$SUI is now pushing into one of the most important areas on the chart.
The multi-month descending trendline.
And the $0.82–$0.85 resistance zone.
This is where things get interesting.
The first breakout from the smaller falling wedge has already happened.
But that alone isn’t enough.
Now the market needs to prove that buyers can actually take control of the bigger structure.
A clean break above the descending trendline, followed by a reclaim and hold above $0.85, would make the short-term setup much more interesting.
If that happens, I’d start watching the $0.90 area f
SUI+4.86%
  • 1
#美股AI概念股全线反弹 + #Gate广场中秋团圆局
AI STOCKS ARE BACK IN FOCUS — BUT IS THIS THE START OF A NEW LEG OR JUST A RELIEF RALLY?
The U.S. technology market has entered another important phase. After a sharp wave of volatility triggered by the Federal Reserve’s latest rate decision and renewed concerns around AI valuations, artificial-intelligence and semiconductor stocks bounced strongly.
On Sep 17, the Nasdaq Composite jumped around 1.7%, while the S&P 500 gained roughly 1.1%. Semiconductor stocks were among the strongest performers, with the Philadelphia Semiconductor Index rising about 3.3%. Nvidia, A
CryptoChampion
#美股AI概念股全线反弹 + #Gate广场中秋团圆局
AI STOCKS ARE BACK IN FOCUS — BUT IS THIS THE START OF A NEW LEG OR JUST A RELIEF RALLY?
The U.S. technology market has entered another important phase. After a sharp wave of volatility triggered by the Federal Reserve’s latest rate decision and renewed concerns around AI valuations, artificial-intelligence and semiconductor stocks bounced strongly.
On Sep 17, the Nasdaq Composite jumped around 1.7%, while the S&P 500 gained roughly 1.1%. Semiconductor stocks were among the strongest performers, with the Philadelphia Semiconductor Index rising about 3.3%. Nvidia, AMD, Micron and other AI-related names helped lead the recovery.
But for me, the most important question is not simply whether AI stocks are rising again.
The bigger question is:
CAN THE FUNDAMENTALS SUPPORT ANOTHER SUSTAINED MOVE?
1. AI Demand Has Not Disappeared
The strongest argument behind the AI market remains real infrastructure demand.
AI development requires enormous amounts of computing power, advanced semiconductors, high-speed networking, memory, data centers and electricity. That creates a much broader investment cycle than simply buying shares of one AI software company.
Recent developments continue to show that companies are committing significant resources to AI infrastructure. Nvidia CEO Jensen Huang has also pointed to continued strong demand for AI computing, while the broader infrastructure ecosystem continues expanding.
This means the AI story is increasingly connected to physical infrastructure rather than only market hype.
2. Interest Rates Are Still the Major Risk
At the same time, investors cannot ignore the macro environment.
The Federal Reserve recently raised its benchmark rate by 25 basis points to 3.75%–4.00%, its first hike in more than three years, while signaling the possibility of another increase this year.
That creates an important challenge for high-growth technology companies.
When Treasury yields remain elevated, the future cash flows of high-valuation companies become more sensitive to discount rates. On September 18, the 10-year Treasury yield moved back toward 5%, showing that financial conditions remain restrictive.
So even when AI fundamentals remain strong, valuations can still experience sharp swings.
3. The Rebound Needs Confirmation
Another important factor is market breadth.
The recent recovery was powerful, but one or two strong sessions do not automatically establish a long-term trend.
For me, the next phase should be watched through several signals:
AI semiconductor leadership
Data-center spending
Corporate AI investment
Treasury yields
Oil prices
Earnings expectations
Market breadth and trading volume
If these factors improve together, the rebound could develop into a broader technology recovery.
If yields rise again while AI spending expectations weaken, the market could return to a more defensive setup.
My Market View
I see the current environment as a battle between AI structural growth and macro valuation pressure.
The AI infrastructure cycle remains one of the most important themes in global markets, but investors are also dealing with higher interest rates, elevated bond yields and volatile energy prices.
That makes confirmation more important than chasing a single green session.
The next move in AI stocks may therefore depend less on headlines and more on whether real corporate spending, earnings growth and infrastructure demand continue validating the enormous expectations already built into the sector.
For Gate Square, this is exactly the type of market environment worth discussing during the Mid-Autumn season: different markets, different narratives, but one common question — what is actually driving the next move?
#GateSquare #weeklyshare #ShareWeekly @Gate_Square
repost-content-media
SPX500+0.51%
INDEX-21.71%
NVDA+1.23%
AMD+2.76%
MU+3.80%
$UNI The pennant target has been reached; a pullback to the 6.52–6.48 range is expected from here. If that level breaks, a move to $3 could follow.
post-image
UNI+1.87%
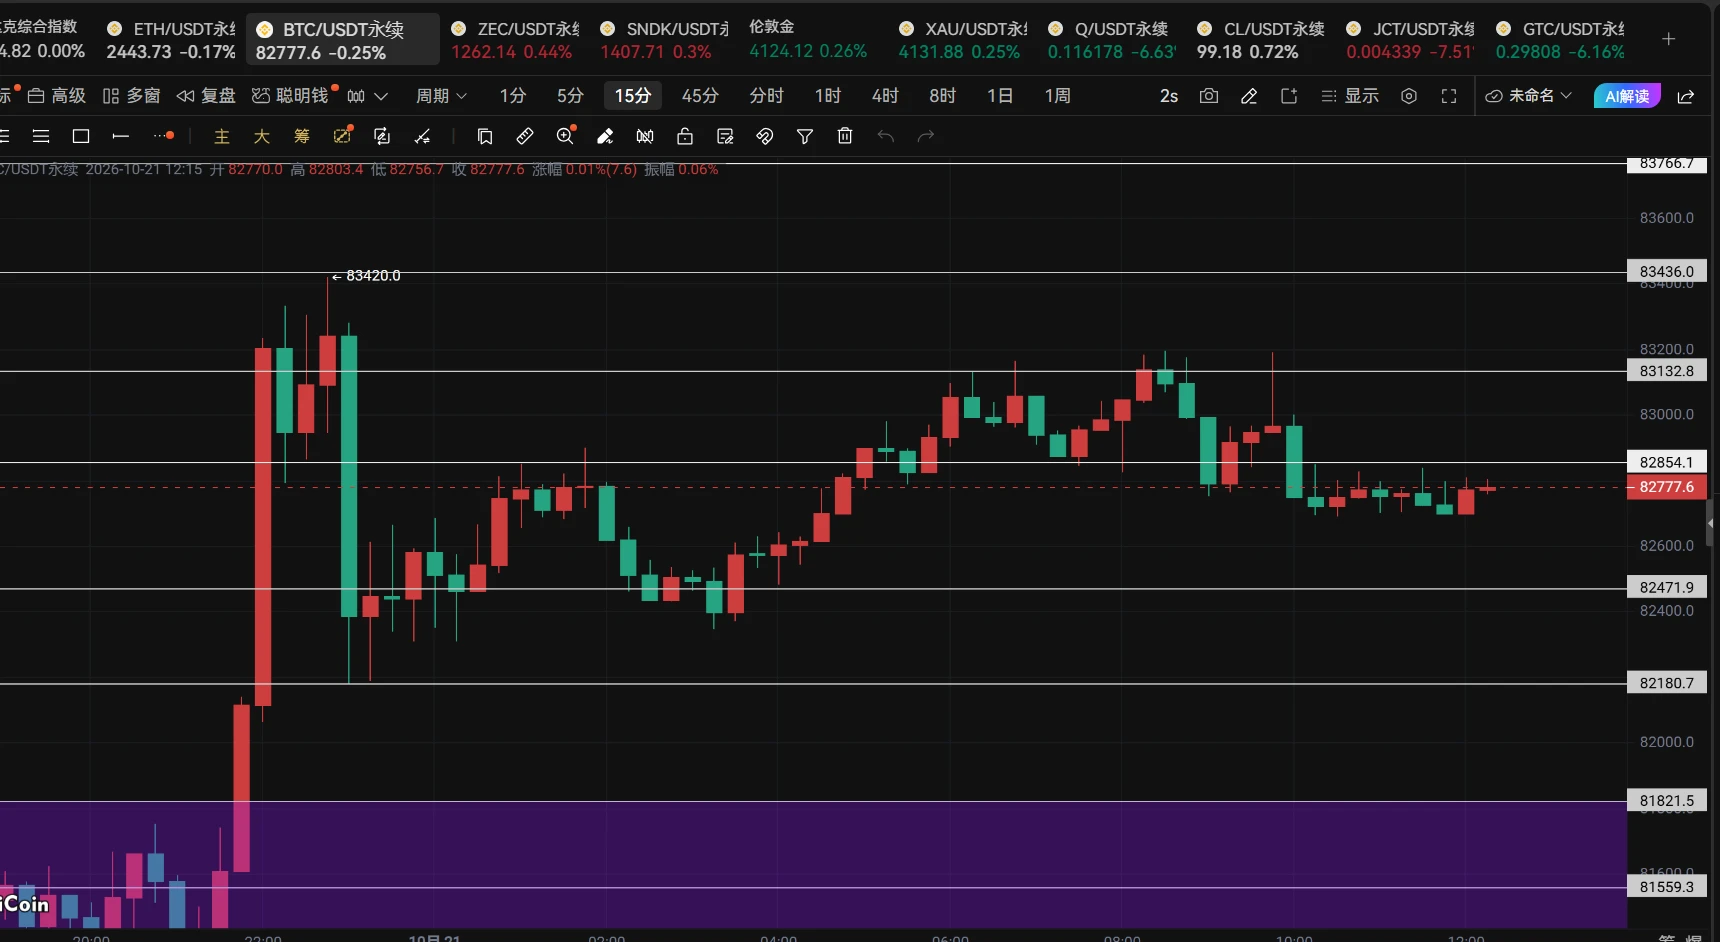
Bitcoin is pushing back toward the $82K resistance after a strong rebound from the $76K area.
A clean breakout could bring fresh momentum, while rejection keeps $80K–$78K in focus.
$BTC #Bitcoin #Crypto #GateTopsStockPerpetualCoverage
post-image
BTC+1.05%
Everyone is missing the hidden trap forming inside SYMBOL right now.

$ADA /USDT - SHORT

Trade Plan:
Entry: 0.2278 – 0.2294
SL: 0.2383
TP1: 0.2213
TP2: 0.2165
TP3: 0.2092

Why this setup?
Why now? The daily trend is range, which means momentum is coiled and ready to snap in one direction. The 1h price sits at 0.2286, exactly at the entry_ref, giving us a clean trigger. The 1h ATR of 0.003102 tells us volatility is compressed enough to fuel a sharp move. The 15m RSI at 65.93 shows strength but not yet overbought, so short sellers can still push price from the entry zone toward TP1 at 0.2213
ADA+3.56%
The real winner this week is the one nobody is talking about
During the two days after the rate hike took effect, everyone was watching the banks and the Nasdaq
Banks were supposed to benefit from wider net interest margins, but XLF didn’t move
The Nasdaq was supposed to be pressured, but semiconductors rallied 2.2% instead
A full bullish candle on Friday
I was still stubbornly insisting intraday Friday that money wouldn’t return to U.S. stocks
By the close, SMH had slapped half my face off
The money came back, but only to growth stocks
The banks didn’t get any of it
It’s not complicated: the
post-image
NAS100+0.81%
XLF-0.03%
SMH+2.04%
🐋 WHALE WATCH : USA-aligned coins closed Q3 strong. Nine of eleven finished green over the past 60 days.
$ZEC led at +112.8%, with $UNI close behind at +89.6%. $LINK and $SOL both delivered 35-40%. $XRP $ADA $LTC and $DOGE posted gains in the 15 30% range. $XLM edged up 5%.
$RENDER and $BCH were the exceptions slipping slightly negative while the rest of the basket rallied.
One token carrying an average looks different from this. Strength spread across majors mid caps and legacy names points to sector momentum not a single outlier lifting the numbers.
post-image
ZEC+3.25%
UNI+1.87%
SOL+0.87%
XRP+3.79%
ADA+3.56%
#btc Amiya’s final reminder: one last time, have you not seen what happened with Myanmar A?
post-image
BTC+1.05%
A 5% Treasury yield is pricing Bitcoin and gold.
Mike McGlone, senior macro strategist at Bloomberg Intelligence, believes that continued rises in U.S. Treasury yields will give investors stronger incentives to reduce their Bitcoin and gold positions, as tightening monetary conditions reshape global asset pricing.
When risk-free yields offer 5%, the cost of holding volatile assets becomes explicit. This is the same question for gold and Bitcoin: they do not need to outperform each other—they need to outperform Treasuries.
Click my Gate group link below to join the group and receive the latest
post-image
BTC+1.05%
GLDX+0.06%
PAXG+0.38%
BTC/USDT Technical Analysis — 19 Sep 2026
BTC is trading around $81.3K, up roughly 4% over 24h, after breaking above the $80K area.
📊 Market Structure
Short-term trend: Bullish
Current price: ~$81,300
Immediate resistance: $82,300–$82,850
Support 1: $80,000–$80,500
Support 2: $78,000–$78,400
Major support: ~$75,000
Daily moving averages remain bullish, while RSI is elevated, meaning a short-term pullback is possible.
🟢 Trade Idea — Long
Entry: $80,200–$80,800
TP1: $82,300
TP2: $83,500
TP3: $85,000
SL: $78,900
The idea is to buy a controlled retest of the $80K breakout zone rather than chas
post-image
BTC+1.12%
#BOJHikesTo1.25%31YearHigh
On Friday, 18 September 2026, the Bank of Japan raised its short-term policy rate by 25 basis points, from 1.00 percent to 1.25 percent, the highest level in 31 years and a rate not seen since 1995. It was the sixth increase since the BOJ ended negative rates in March 2024, when the policy rate sat at minus 0.1 percent, and the vote was split 7-2, with the two dissenters seen as reflationists appointed earlier this year. Around 90 percent of economists surveyed had expected the move, so it was not a surprise. What it was, is another step away from the decades of ult
  • 8
If it could just fake a breakout and then have a deep pullback, that would be great. Just to wait for a deep pullback, you know what I’ve been going through. #Gate广场中秋团圆局 #Gate股票永续合约覆盖数量行业第一
Load More

Join 40 M users in our growing community

⚡️ Join 40 M users in the crypto craze discussion

💬 Engage with your favorite top creators

👍 See what interests you

Trending Topics

JapanRealEstatePowerChipStocksRise

59.55k Views4.4k Discussing

Japan's Nikkei extended gains on Sept 18, with real estate, power, and semiconductor sectors leading. Gate covers over 12,800 global stocks and ETFs, offering one-stop USDT trading across US, HK, Korean, and Japanese markets. [👉 Read more](https://www.odaily.news/en/newsflash/518749)

USAIConceptStocksRally

34.19k Views955 Discussing

GateTopsStockPerpetualCoverage

38.5k Views2.56k Discussing

View More