Square
Following
Hot
News
Profile
Share your thoughts
placeholder
Article
Name the #ticker $________
post-image
$BTW Long plan: 4-hour chart support at 1.908–1.925
Buyers must hold this area to maintain dominance. I will watch whether they can defend it here and avoid chasing the price. Why focus on this level: - The 4-hour price is 1.92, above the EMA50 at 1.81, favoring buyers - The stop-loss risk is 6.4%, while the potential TP3 gain is 10.3%, giving a favorable risk-reward ratio - BTC's short-term trend is bullish, providing support🟢 Long · Entry 1.908–1.925 · Take profit 1.990 / 2.039 / 2.113 · Stop loss 1.794
Not investment advice · Do your own research
post-image
BTW-21.91%
BTC+0.98%
“Black Monday” for the storage sector—Micron falls below $1,000: What exactly happened?
On October 13, the U.S. storage sector experienced a textbook-style mass sell-off. Micron Technology closed down 3.88%, falling below the $1,000 per-share mark to close at $989.04, nearly 20% below its June record closing high and nearing technical bear market territory. SanDisk fell 5.97%, Western Digital dropped more than 6%, Seagate Technology fell 6.97%, and SK Hynix’s U.S. shares declined more than 5%. The Philadelphia Semiconductor Index closed down 2.67% at 12,236.79 points.‌
Seagate and Western Dig
SNDK-0.56%
Bitcoin Mining Stocks Plunge: 4 Major Firms Lose Over 12% in One Day
Bitcoin miners took a severe hit on Wednesday as higher-than-expected US inflation data triggered a broad selloff across tech and AI stocks.
TeraWulf fell 12.64%, Core Scientific dropped 12.44%, Cipher Mining declined 12.35%, and IREN lost roughly 12.2% in a single session.
⚠️ Personal market analysis only. NFA — manage risk and DYOR.
Educational content, not investment advice or a recommendation to buy, sell, deposit, or withdraw any asset. No paid promotion or referral/affiliate links.
post-image
CORZ+7.03%
IREN-0.55%
Insiders are quietly stacking shorts on BTW while the 1h ATR screams volatility.

$BTW /USDT - SHORT

Trade Plan:
Entry: 1.875069 – 1.928019
SL: 2.155704
TP1: 1.710924
TP2: 1.583844
TP3: 1.393224

Why this setup?
Why now? The daily trend is range-bound, which favors mean reversion and gives the short bias a structural edge. The 15m RSI sits at 49.09, hovering just below neutral and signaling that momentum is not yet oversold enough to invalidate a pullback. The 1h ATR of 0.1059 confirms that the asset is in a high-volatility phase, making the entry zone between 1.875069 and 1.928019 a preci
BTW-21.83%
The Overlooked “Third Culprit” Behind the Crash—The Technological Progress of Chinese Memory Manufacturers

Most analyses have focused on the higher-than-expected CPI and concerns over AI financing, but I believe one factor has been seriously overlooked—the technological progress of China’s ChangXin Memory Technologies.

When analyzing the reasons behind the plunge in Japanese and South Korean stocks on October 13, Ying Xiwen, head of the research department at Minyin International, cited three factors: the sharp overnight decline in the U.S. memory chip sector, warnings from the CEOs of Int
CXMT+2.42%
CPI Comes in Hotter Than Expected
live-cover
LIVE27
I checked @CoinMarketCap 's market movements, and $NEAR is among the tokens showing positive momentum.
What makes this project interesting to me is that it goes beyond token price. NEAR is building blockchain infrastructure focused on scalability, user-friendly applications, cross-chain transactions, and AI-powered systems.
The ecosystem is positioning itself at the intersection of Web3 and AI, two areas worth watching as blockchain adoption evolves.
But here is my take: a green candle alone is not enough to make me bullish on a token. I want to see sustained momentum, healthy trading volume,
post-image
$ZEREBRO Long Update:
Another sniper setup shared for the Whales Channel hour ago & then forwarded for the Public Channel.
We keep nailing 🐋🔥
TG channel:
#Zerebro $ZEC #ZEC $ETH $DOGE $XRP $HBAR $XLM $PUFFER $SIREN $STRK $AKE $BTW
post-image
ZEREBRO+6.95%
ZEC+8.07%
ETH+1.65%
DOGE-0.53%
XRP+0.38%
$FIL the big move by gateio has begun, where everyone who believed in and invested in these ETF tokens literally gets screwed 🤡🤯
post-image
FIL+7.94%
An unpopular take: $INJ ’s current +10.99% gain is not as conclusive as it looks.
$INJ is currently at 8.423, up +10.99% over 24 hours. The 1-hour support is 7.061, resistance is 8.562, and current volume is 0.77 times the average volume of the past 20 periods. What is truly useful in these numbers is where 7.061 and 8.562 are containing the range.
This is where I currently stand: I acknowledge that the trend is strong, but what matters next is not how much higher it can surge, but whether buyers step in during the first pullback. The 1-hour trend is strong, with an RSI of 86; the 4-hour trend
post-image
INJ+11.45%
BTC UPDATE
live-cover
LIVE15
$AVAX 🔺
B1 filled for the subs at $9.60 🎯
$10.07 already
we keep winning 🔔🚀
post-image
AVAX+0.16%
we crushed the PPI news 📊
🚨 JUST IN: MSCI is reportedly set to REMOVE Michael Saylor’s Strategy $MSTR from its indexes. 👀
The move could impact institutional funds that track MSCI benchmarks.
MSCI+2.49%
MSTR+5.58%
$OP
This move is pushing from 0.1397 toward 0.1418, up more than 13% over the past 7 days, while open interest is piling up as longs keep adding and driving it higher🚀 The wildest part is that shorts are effectively paying to stay in, having to hold on while funding remains negative. The pressure isn’t a bad thing—it’s an early-entry position. Break through 0.1418 and jump aboard.
post-image
OP-0.29%
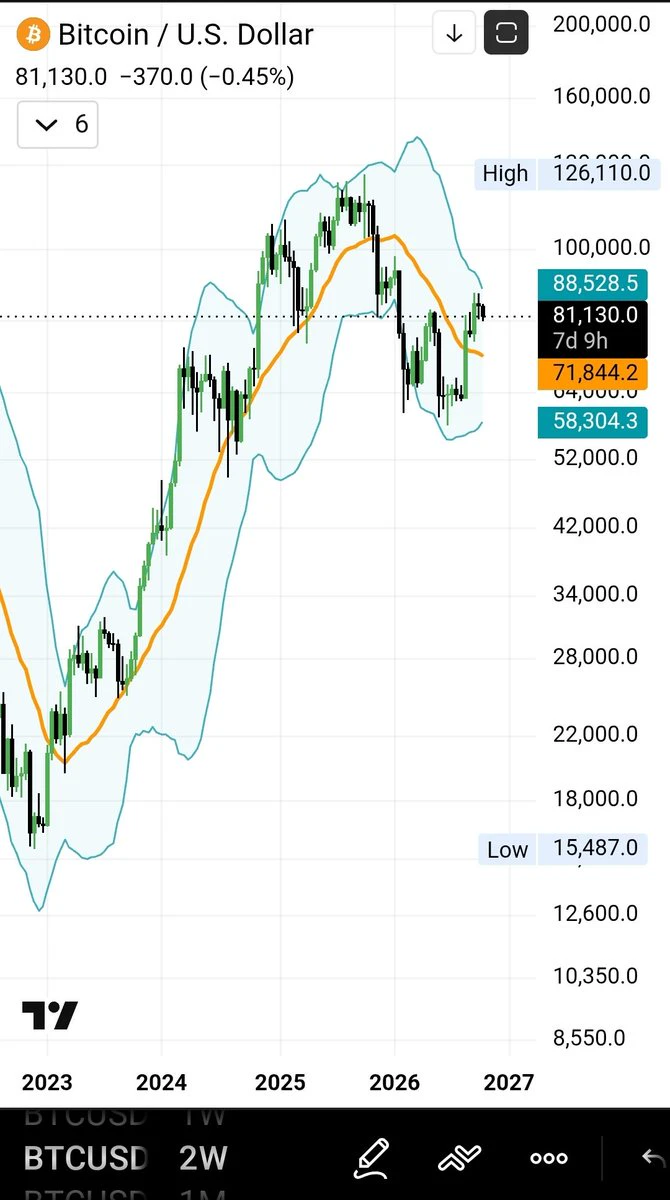
Bitcoin’s Long Term Cycle Chart Points to a Bigger Question: Are We in Another Accumulation Zone? 🙄
Bitcoin’s historical price cycles show a recurring pattern: major rallies, deep corrections, and long recovery periods.
The chart highlights previous peaks near $19,700 in 2017, $69,000 in 2021, and $126,000 in 2025, alongside earlier areas that some traders viewed as accumulation zones.
Now, the key question is whether the current price structure represents another opportunity to accumulate or whether the cycle is changing.
I think that the Historical patterns can offer useful context, but the
post-image
BTC+0.98%
In this $ZRO move, which step is easiest to be fooled by?
When I looked at $ZRO again, I first covered up the 24-hour +9.37%. It’s not that this number is unimportant, but it is too good at grabbing attention. What really needs explaining right now is that after $ZRO’s sharp 24-hour rise, momentum and continuation are not the same thing. I won’t extrapolate the large move that has already happened into the next leg; I’ll first see whether the price can hold in the new range.
The most convenient—and easiest to get wrong—reading is that the gainers and losers list records the past, while the mo
post-image
ZRO+9.49%
I’ve been watching $81K on Bitcoin. This week it tested that level, and then some.
On Tuesday, Korean stocks fell 5.5%. Bitcoin dipped to about 81,040 on Gate, then climbed back above $83K within hours. On Wednesday evening it slid again, and that drop has the heaviest volume on my chart. It fell to around 81.6K.
The 24h low on Gate now shows 79,795. So at some point in the last day it went under my line. Right now it’s back around 82.3K.
I can’t see that dip on the candles I’m looking at, so I don’t know how long it stayed down or how fast it came back.
My read: the line didn’t hold cleanly,
post-image
BTC+0.98%
  • 1
October 16 $BTC Strategy: Based on the current market, BTC's upward movement is being blocked by the 84200 resistance level. We continue to expect a pullback in the near term, but the decline has not been deep.
Do not rush to buy the dip. Open short positions in the 83500-84000 range, with a stop loss at 84500 (the starting point of the decline on October 7). If a solid bearish candle continues to break below 81800, keep the stop loss at breakeven.
Wait for a new low to appear. Reduce short positions in the 79200-78000 range and look for an opportunity to enter long positions.
post-image
BTC+0.99%
Load More

Join 40 M users in our growing community

⚡️ Join 40 M users in the crypto craze discussion

💬 Engage with your favorite top creators

👍 See what interests you

Trending Topics

USSeptemberPPIBeatsExpectations

91.35k Views1.88k Discussing

US September PPI came in at 6.3% YoY, well above the 5.3% market expectation, pointing to renewed producer-side inflation pressure. Weekly jobless claims were 199K, broadly in line with forecasts. Could hotter inflation further reduce room for rate cuts, and what does it mean for $BTC, US stocks, and gold?

DrLinHanSpeaksAtOxfordUnion

135.63k Views1.86k Discussing

JapanAndKoreaStocksPlunge

47.27k Views1.76k Discussing

View More