Share your thoughts
placeholder
Article
Everyone’s chasing silver’s rally—but the 4H tape just flipped on $XAG /USDT, and the exit door is narrower than you think.

$XAG /USDT - SHORT

Trade Plan:
Entry: 66.26 – 66.32
SL: 66.55
TP1: 66.09
TP2: 65.96
TP3: 65.77

Why this setup?
Why now? The 1D trend is *range*, not breakout—so this 66.29 reference is a pivot, not a launchpad.
- RSI on the 15m (57) is cooling, not accelerating—momentum is stalling into resistance.
- ATR (0.108) shows volatility is compressing; that’s a spring, but the bias says it snaps *down* first.
- Targets sit at 66.09 (TP1) and 65.96 (TP2)—a clean 0.3% d
XAG0.00%
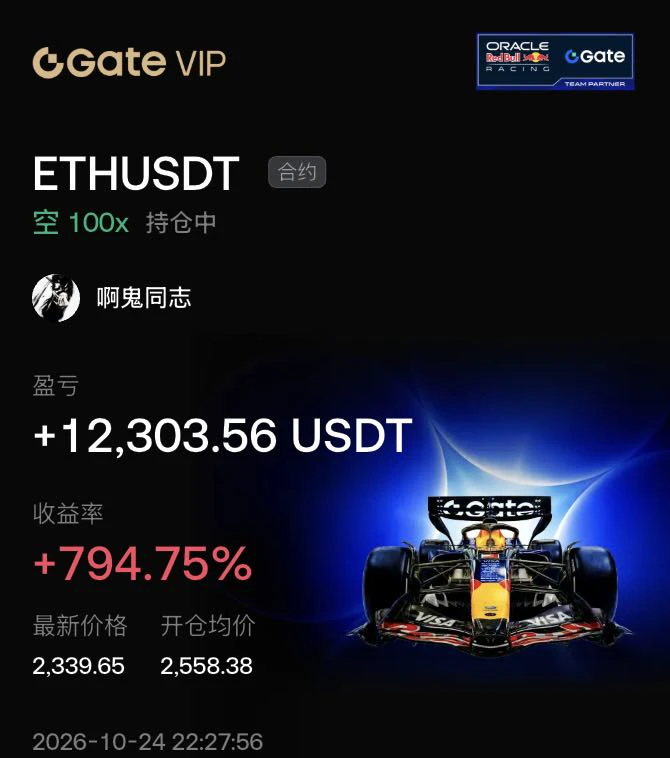
The hand that set the stop-loss a few days ago was trembling slightly; this morning I realized that was unnecessary filial piety. When the market was just getting dumped at the open, my short position was already in. Looking at it now, the market has handed me another medal.

A quick recap: The rebound a few afternoons ago looked quite strong, but volume failed to keep up completely. Every push upward fell just short, with heavy pressure overhead. $JTO repeatedly hovered around 0.5290, and I judged it to be a bull trap, so I went straight in short. Looking at it now, the current price has al
post-image
JTO+4.36%
XRP+1.48%
BTC+0.40%
SEC Takes Action Against ISS
The U.S. SEC has filed a subpoena enforcement action against Institutional Shareholder Services (ISS), seeking a court order to compel the firm to provide documents requested in an ongoing investigation.
According to the SEC, ISS has not fully complied with an administrative subpoena issued on July 21, 2026.
The requested information relates to ISS’s proxy recommendations and voting activities and is being examined as part of the SEC’s broader oversight.
⚠️ Important: The SEC has not concluded that ISS violated federal securities laws. The investigation remains ong
post-image
  • 4
  • 2
You are not worthy of your ambitions, and you have let the suffering you endured go to waste.
I wasn't expecting this move to hold either, but the market directly handed my short position a huge gift. This service is just too good.

When I checked the charts right after lunch, $SAHARA was still stubbornly holding on, but every rebound looked starved, with volume shrinking each time while the selling pressure showed no mercy. With fewer and fewer buyers stepping in, I knew it was time to act. I opened a short around 0.03226 and left the rest to time.

The current price has now slid to 0.00938, bringing the return to +3415.54%. This profit feels great; even the long wait beforehand wa
post-image
SAHARA+0.75%
BTC+0.40%
DOGE+7.60%
$1000 to $100,000 Crypto Trade Challenge Today
live-cover
LIVE1,418
I did nothing—just went to the restroom, and when I came back, the candlestick chart had already done the work for me.

A few days ago, before bed, I was watching $SKYAI ’s final hourly candle. It kept hovering around 0.21986, and both attempts to push higher were immediately forced back down. The resistance above was obvious, and volume wasn’t keeping up. I noted in my plan at the time: this isn’t a good level to chase longs; those looking to short can try with a small position. While others were still waiting for a breakout, I had already placed my short order.

When I opened the chart in
post-image
SKYAI+6.08%
XRP+1.48%
LAB+2.17%
MARKET ALERT - LINK
The LINKUSDT chart is in a strong bullish uptrend on both timeframes, with a confirmed upward EMA alignment (20 > 50 > 200).
Technical Analysis
15-Minute Timeframe: The price briefly reached a peak at 12,471 before undergoing a normal pullback. The latest red candlestick indicates short-term profit-taking. The nearest support lies between EMA 20 (12,157) and EMA 50 (12,046).
4-Hour Timeframe: The macro market structure is highly bullish after successfully rebounding from lower levels. The price is approaching the previous strong resistance area around 12,613. EMA 20 at 11,7
LINK+4.89%
  • 4
  • 2
BNB Surpasses 770 USDT with a 7.24 Increase in 24 Hours
live-cover
LIVE1,606
This $CHIP long has gone more smoothly than expected, with unrealized profit reaching a key level of +575.4%. I didn’t get greedy and took profit on 70% of the position around 0.06019, while moving the protection level for the remaining 30% above the entry price.

That small remaining position is just to give it a chance to keep performing, but I won’t give it room to swallow all the profits back. Chasing longs at this point is no longer offering a favorable risk-reward ratio, because the sharper the move up from 0.05377, the more likely a wick-driven shakeout becomes afterward.

My attitude
post-image
CHIP+6.84%
SOL+2.48%
BTC+0.40%
Raining man 2026
post-image
ASTER long-term spot analysis and the actions I will take:
From the weekly timeframe, after undergoing initial expansion and retracement, ASTER is consolidating within a macro bottoming structure.
📊 Buy zone (primarily limit orders): 0.5346
📊 Secondary support: 0.2265 (if 0.5346 fails to hold)
🎯 Macro long-term target: 5.4441
The main accumulation zone around 0.5346 remains valid for a long-term spot position.
The current price is trading above the accumulation zone. If the price retests 0.5346, it will provide a high-risk-reward entry opportunity to build a long-term position, with the tar
post-image
ASTER+7.32%
Everyone’s staring at the 0.40 level on WLD — I’m watching the 15m RSI scream at 66.45 and asking why you’re not.

$WLD /USDT - SHORT

Trade Plan:
Entry: 0.4012 – 0.4034
SL: 0.4128
TP1: 0.3944
TP2: 0.3892
TP3: 0.3813

Why this setup?
- The 4h chart says SHORT with 55% conviction, but the daily trend is *range*, not trend — so this is a scalp, not a saga.
- Price is pinned at 0.4023 with ATR (1h) at 0.0043 — that’s a tight coil, and the 15m RSI is overheated *before* a breakdown, not after.
- Why now? TP1 at 0.3944 is only 2% away, but the real meat is TP2 at 0.3892 — that’s where the ra
WLD+3.55%
BREAKING: MARSCOIN’s market cap tops $265M on BNB Chain after a ~38% 24h surge as contract trading launched Sep 1 and spot trading rolled out Sep 4. $MARS
Note: Keep within 180-260 chars. This line is about 180-190 chars. Ensure emoji limit: we used none; allowed up to 2. Sho...
post-image
MARSCOIN+26.74%
BNB+6.03%
#美国8月非农超预期 As expectations for Fed rate cuts fluctuate, how is the crypto market’s pricing logic changing?
The macro market has been quite interesting lately. At the beginning of the year, everyone was waiting for rate cuts, but inflation rebounded, the Fed changed leadership, rate-cut expectations were repeatedly pushed back, and talk of rate hikes even resurfaced. Gold reached a new all-time high, while Bitcoin has been fluctuating at high levels without being able to break through, leaving many people confused.
In fact, there is only one core point: the crypto market’s pricing logic is shif
BTC+0.42%
  • 3
2026‑09‑06 ETH-USDT Perpetual Contract Technical Analysis
Key Levels
Resistance
First resistance: 2500‑2530
Strong resistance: 2570‑2600 (previous high's concentrated selling zone)
Support
First support: 2390‑2420 (short-term bull-bear dividing line)
Strong support: 2320‑2350
Market Conditions
The broader daily bullish structure remains intact for now. After rallying, the price has entered high-level consolidation, with upward momentum gradually weakening, and the trend remains highly correlated with BTC. The MACD red bars continue to contract, with bullish and bearish forces approaching equil
post-image
ETH+2.05%
  • 2
  • 1
Everyone’s chasing SOL’s green dildo—but the 4h tape is screaming something else entirely.

$SOL /USDT - SHORT

Trade Plan:
Entry: 104.18 – 104.52
SL: 105.99
TP1: 103.12
TP2: 102.30
TP3: 101.06

Why this setup?
Why now? The 1D range is the cage, and $SOL /USDT is pressing the lid at 104.35.
- RSI 15m is overheated at 67.7—buyers are exhausted, not empowered.
- ATR 1h (0.68) shows volatility is compressing—breakouts fake out, mean reversion wins.
- Entry zone 104.18–104.52 is the exact rejection shelf from prior swings; TP1 103.12 is a magnet if we lose 104.00.
- Confidence is weak (
SOL+2.48%
JUST IN: Bonk Guy’s PONS position drives portfolio to a new all-time high around $27M, with major unrealized gains from PONS, USELESS, and MARSCOIN. 🧭 Traders watching wallet-driven moves on Fomo platform. $PONS $USELESS $MARSCOIN
post-image
PONS+26.65%
USELESS+4.80%
MARSCOIN+26.74%
Everyone’s staring at XLM’s 0.18517—but the 4h chart is screaming something they refuse to hear.

$XLM /USDT - SHORT

Trade Plan:
Entry: 0.18481 – 0.18553
SL: 0.18865
TP1: 0.18256
TP2: 0.18082
TP3: 0.17821

Why this setup?
Why now? The 1D trend is range-bound, yet momentum is fading.
- RSI (15m) at 61.37 shows a weak bounce—not a breakout.
- ATR (1h) at 0.001449 confirms tight, indecisive moves.
- With a SHORT bias (55% confidence), the path of least resistance is down toward TP1 (0.18256) and TP2 (0.18082).
- Entry window 0.18481–0.18553 is your trap zone—don’t chase green here.

XLM+3.27%
$MARSCOIN Signal】Long + order book imbalance/1H momentum reversion
$MARSCOIN Order book imbalance 19.33%, bids providing support, 1H MACD histogram narrowing.
🎯 Direction: Long
⚡ Entry/limit order: 0.2436269 - 0.2443600
🛑 Stop-loss: 0.2419164
🚀 Target 1: 0.2480254
🚀 Target 2: 0.2498581
🛡️Trade management: - Execution strategy: Take 50% off at Target 1 and move the stop-loss to breakeven. Exit if price falls back to the entry level.
Funding rate 0.0311%, OI stable. 4H volume expanded, followed by a low-volume pullback; 1H RSI at 61, not overbought. Risk-reward ratio 1.5; with proper pos
post-image
MARSCOIN+27.94%
BTC+0.42%
ETH+2.07%
SOL+2.48%
Load More

Join 40 M users in our growing community

⚡️ Join 40 M users in the crypto craze discussion

💬 Engage with your favorite top creators

👍 See what interests you

View More