




Eve of the Fed Decision: Four Asset Classes Get Repriced
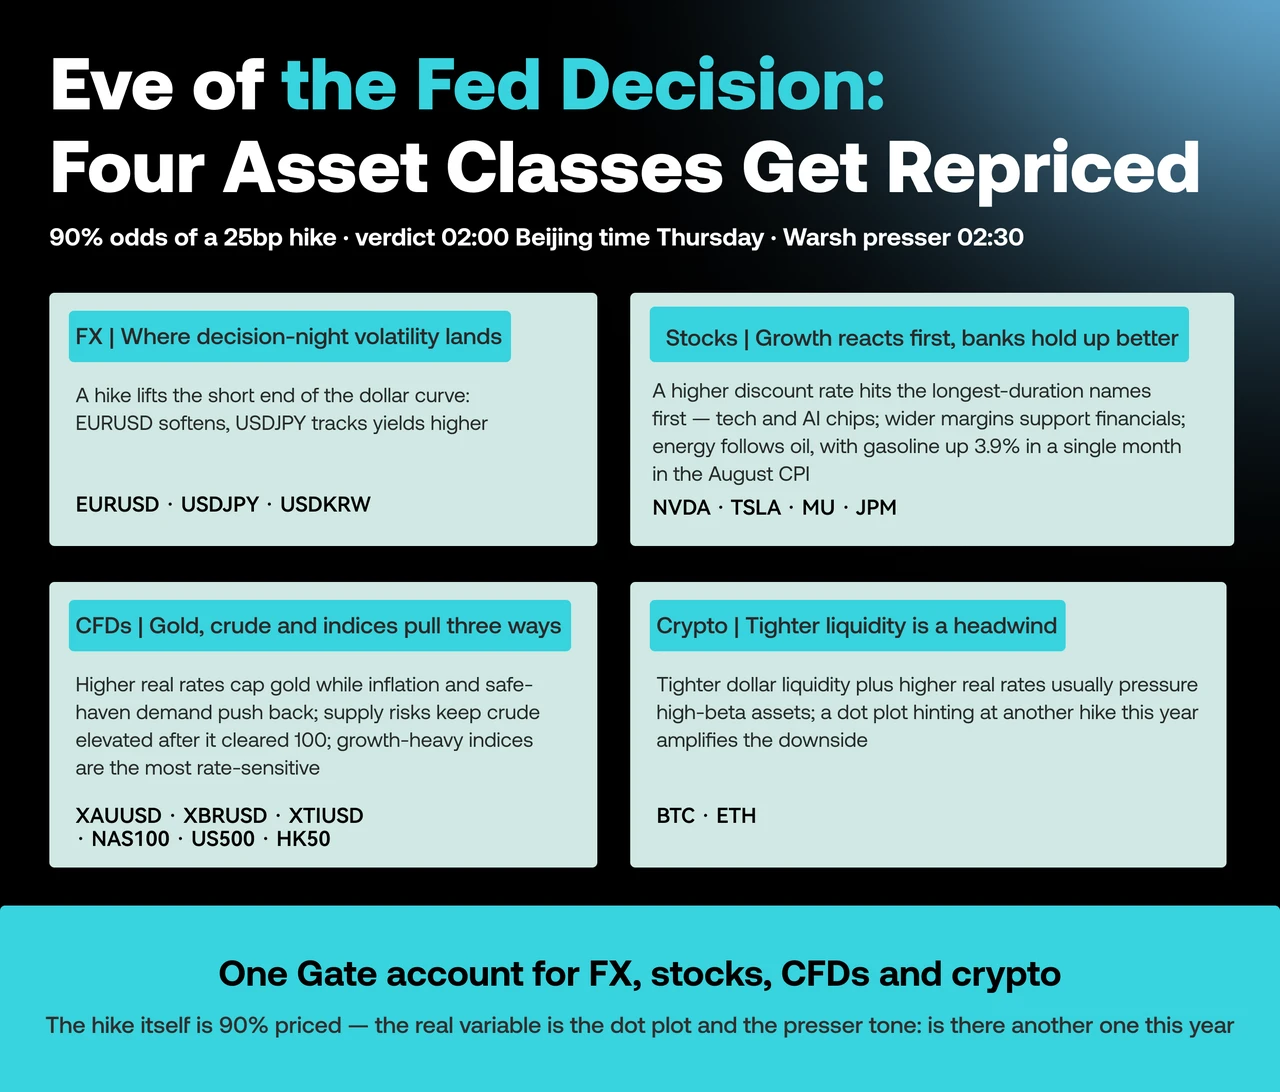
90% odds of a 25bp hike · verdict 02:00 Beijing time Thursday · Warsh presser 02:30
💱 FX: where decision-night volatility concentrates
A hike lifts the short end of the dollar curve — EURUSD usually softens and USDJPY tracks yields higher. The moment the print lands is the busiest window in FX
Pairs to watch: EURUSD · USDJPY · USDKRW
👉 https://www.gate.com/cfd/EURUSD | https://www.gate.com/cfd/USDJPY
📉 Stocks: growth is the most rate-sensitive
A higher discount rate hits the longest-duration names first — tech and AI chips. Wider net interest margins support banks. Energy follows oil, with gasoline up 3.9% in a single month in the August CPI — inflation is still an energy story
Names to watch: Nvidia (NVDA) · Tesla (TSLA) · Micron (MU) · JPMorgan (JPM)
👉 https://www.gate.com/stocks/NVDA | https://www.gate.com/stocks/JPM
🛢 CFDs: gold, crude and indices pull three ways
XAUUSD — higher real rates cap gold while inflation and safe-haven demand push back. XBRUSD / XTIUSD — a hike weighs on demand expectations while supply risks persist, with crude already above 100. NAS100 / US500 — heavy growth weight makes them the most rate-sensitive. HK50 tracks offshore liquidity
Instruments: XAUUSD · XBRUSD · XTIUSD · NAS100 · US500 · HK50
👉 https://www.gate.com/cfd/XAUUSD | https://www.gate.com/cfd/NAS100
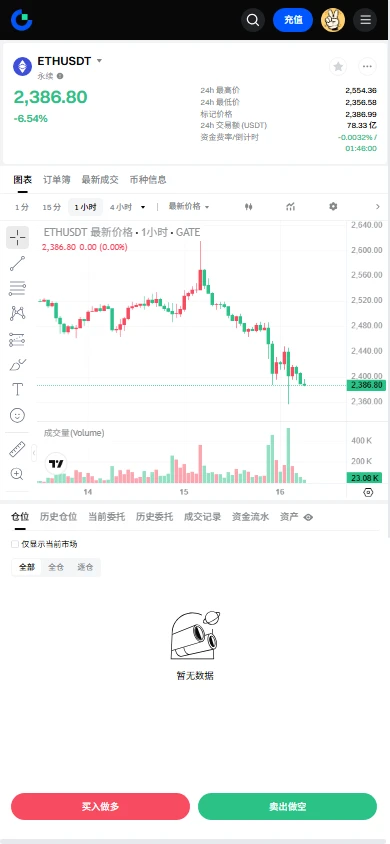
₿ Crypto: tighter liquidity is a headwind
Tighter dollar liquidity plus higher real rates usually pressure high-beta risk assets. If the dot plot hints at a second hike this year, downside pressure builds
Assets: BTC · ETH · GT
👉 https://www.gate.com/trade/BTC_USDT | https://www.gate.com/trade/ETH_USDT
💡 The hike itself is 90% priced — the real volatility is the dot plot and the presser tone. Hint at another move this year and everything re-ranks for "higher for longer"; a surprise hold flips it all in reverse.
👉 One Gate account for FX, stocks, CFDs and crypto: gate.com/stocks
90% odds of a 25bp hike · verdict 02:00 Beijing time Thursday · Warsh presser 02:30
💱 FX: where decision-night volatility concentrates
A hike lifts the short end of the dollar curve — EURUSD usually softens and USDJPY tracks yields higher. The moment the print lands is the busiest window in FX
Pairs to watch: EURUSD · USDJPY · USDKRW
👉 https://www.gate.com/cfd/EURUSD | https://www.gate.com/cfd/USDJPY
📉 Stocks: growth is the most rate-sensitive
A higher discount rate hits the longest-duration names first — tech and AI chips. Wider net interest margins support banks. Energy follows oil, with gasoline up 3.9% in a single month in the August CPI — inflation is still an energy story
Names to watch: Nvidia (NVDA) · Tesla (TSLA) · Micron (MU) · JPMorgan (JPM)
👉 https://www.gate.com/stocks/NVDA | https://www.gate.com/stocks/JPM
🛢 CFDs: gold, crude and indices pull three ways
XAUUSD — higher real rates cap gold while inflation and safe-haven demand push back. XBRUSD / XTIUSD — a hike weighs on demand expectations while supply risks persist, with crude already above 100. NAS100 / US500 — heavy growth weight makes them the most rate-sensitive. HK50 tracks offshore liquidity
Instruments: XAUUSD · XBRUSD · XTIUSD · NAS100 · US500 · HK50
👉 https://www.gate.com/cfd/XAUUSD | https://www.gate.com/cfd/NAS100
₿ Crypto: tighter liquidity is a headwind
Tighter dollar liquidity plus higher real rates usually pressure high-beta risk assets. If the dot plot hints at a second hike this year, downside pressure builds
Assets: BTC · ETH · GT
👉 https://www.gate.com/trade/BTC_USDT | https://www.gate.com/trade/ETH_USDT
💡 The hike itself is 90% priced — the real volatility is the dot plot and the presser tone. Hint at another move this year and everything re-ranks for "higher for longer"; a surprise hold flips it all in reverse.
👉 One Gate account for FX, stocks, CFDs and crypto: gate.com/stocks