Square
Following
Hot
News
Notifications
Profile
Share your thoughts
placeholder
Article
$TRB Possible reversal! The bulls are fighting back

Long trade plan

Entry: $12.25–$12.40
First target: $12.60
Second target: $12.90
Third target: $13.20
Stop loss: 11.85

TRB is making a strong recovery after rebounding from the 11.30–11.50 support zone. Buying momentum is returning, and a sustained break above $12.40 could push the price higher toward $13.20. Wait for confirmation before entering.

Buy and trade $TRB
post-image
TRB-2.27%
I changed my mind. I used to believe the saying, “After a drop this deep, the bottom can’t be far away.” $MMT Today’s low was 0.2113, down from 0.2783, a 16.65% drop, with turnover still at 162.4M. That’s not a small figure. It shows buyers are stepping in, but getting buried one batch at a time.
A deep drop doesn’t mean it’s the bottom; it only means sellers are still on the move. What really matters isn’t how much it’s fallen, but whether volume contracts after the drop and the price holds steady in a certain range. This move looks more like the car is still going downhill, with no brake lig
MMT-2.35%
Trenches
PIEVERSE
P
bade
b
PIEVERSE
0x0e...25a9
Market Cap
$.
Change
.
24h Vol
$.
Holders
.
FIONA
F
bade
b
FIONA
B34n...pump
Market Cap
$.
Change
.
24h Vol
$.
Holders
.
IDOL
I
bade
b
IDOL
0x3b...ab07
Market Cap
$.
Change
.
24h Vol
$.
Holders
.
Singularity
S
bade
b
Singularity
7R4M...pump
Market Cap
$.
Change
.
24h Vol
$.
Holders
.
CLAUDIA
C
bade
b
CLAUDIA
2j5S...W2ZM
Market Cap
$.
Change
.
24h Vol
$.
Holders
.
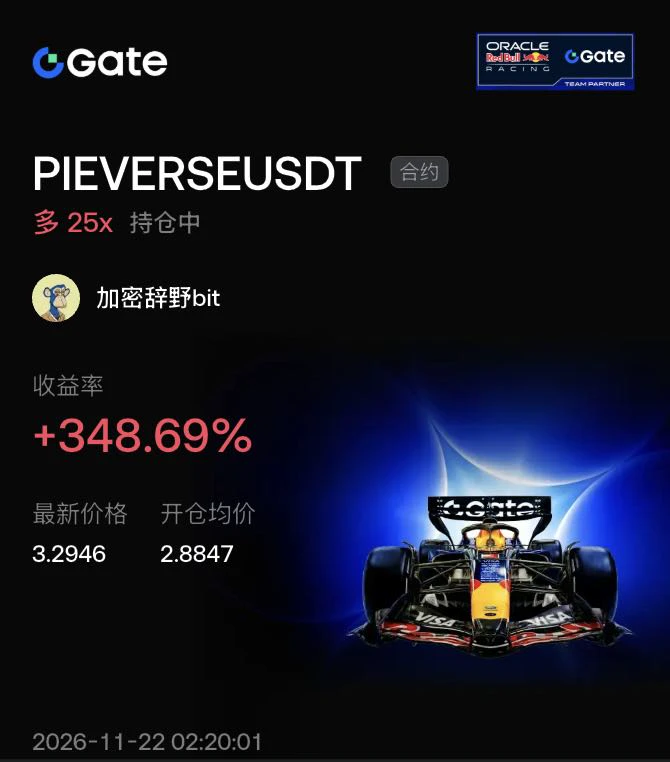
$PIEVERSE When trading, you have to learn to read resistance levels. Just below the previous high is where human nature is put to the test.

PIEVERSE has now reached around 3.29, with a solid ceiling at 3.63 above. Looking at the chart, the bulls are still pushing, but you can clearly feel their upward momentum fading. At a level like this, a double top or a false breakout can easily form.

I opened a long position around 2.88 earlier and rode it up to here. Facing this key resistance level, my strategy is simple: take profits in batches. I’ve already locked in 348% profit, and even if it brea
post-image
PIEVERSE+0.58%
BTC-0.65%
  • 2
$EVAA The logic behind this rebound is very clear. I entered a 10x long position precisely at 4.1957, and the price climbed all the way to 6.2191, with unrealized gains exceeding 478%. A review of the chart: after stabilizing at the lows, trading volume expanded and the moving averages turned upward into a bullish alignment—a classic signal that a trend is taking off.

The chart shows strong bullish momentum, with the price continuing to rise without encountering significant selling pressure. 10x leverage amplified the gains, but the price has already risen substantially, and a pullback driven
post-image
EVAA-0.42%
BTC-0.65%
ETH-1.23%
$BTC The starting point of this trade wasn’t a call on direction, but positioning. The moment 56,000 was swept through, what was stacked below were other people’s stop losses, not my thesis. I placed my order at the lower edge of the cluster and waited for the market to burn through the fuel itself.

Only after reclaiming the round-number level and retesting without breaking lower was the structure confirmed. Until then, it was just a resting order; after that, it became a trade. The difference matters more than direction.

I barely did anything in the middle. With a high-leverage position, th
BTC-0.65%
ETH-1.23%
SNDK-0.18%
  • 2
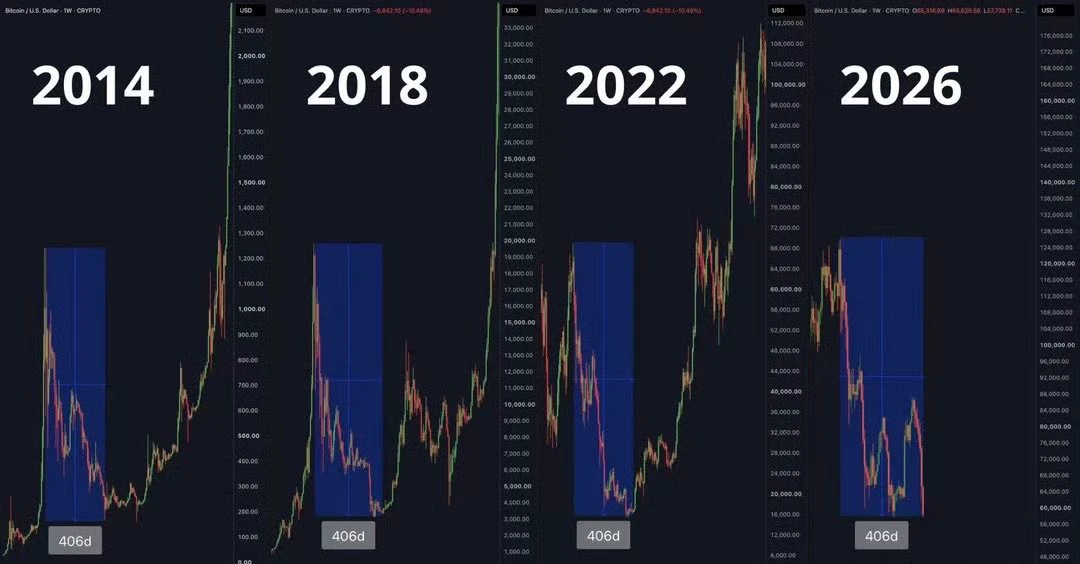
Saw a take that this might be the last week of Bitcoin’s bear market:
2014 bear market: 58 weeks, 406 days
2018 bear market: 58 weeks, 406 days
2022 bear market: 58 weeks, 406 days
2026 bear market: 58 weeks, 406 days
Those trying to apply past cycles to this one have carved a hole right through the boat.
With price action this fucking bad, people are still saying it’s the last week of the bear market? Even the Rainbow Chart has stopped working.
post-image
BTC-0.67%
CRYPTO MARKET UPDATES
live-cover
LIVE785
BTC-0.67%
ETH-1.26%
XRP-1.15%
SOL-0.77%
$BCH finally stopped acting like a dead battery and surged straight back to its intraday high. I think prices holding above those moving averages finally makes it feel like it's time to make a move. Glad to see some real action here for once, instead of the usual circus. Take profit: 207.59 Stop loss: 191.59 Notable: $SKYAI : Current price 0.03601 - 24-hour change: +29.35%$ETH : Current price 1,683.54 - 24-hour change: +2.73%
post-image
BCH+1.05%
SKYAI-7.58%
Crypto Market Academician: 11.22 Ethereum (ETH): Can a lower wick save the trend? Bearish alignment remains unbroken, and oversold momentum is fading!
For several days in a row, I’ve mentioned 1650 as the first step for spot positioning; the second step at 1550 has also been entered. The first medium- to long-term target is above 3000. It doesn’t matter how long I hold—in any case, it’s money I’ve set aside for my own funeral. I tried going long with futures five or six times and got stopped out. Fortunately, I always leave myself room to be wrong: if my call is wrong, I exit with a small loss
ETH-1.23%
After tightening the last screw, Lao Zhao at the repair shop wiped his hands with a rag and said the car had been sitting for a week without being driven, but the battery had still gone weak. $DODOX It’s up 20.34% today, with 117.6M in trading volume—a substantial amount under normal circumstances. The strange thing is that the price surged to 0.0437 and then fell back to 0.0390, while volume didn’t follow the price and hold at the highs. Money came in, but it didn’t all stay up there. There are three possibilities: first, someone used the rally to rotate positions, selling old holdings into t
  • 2
  • 3
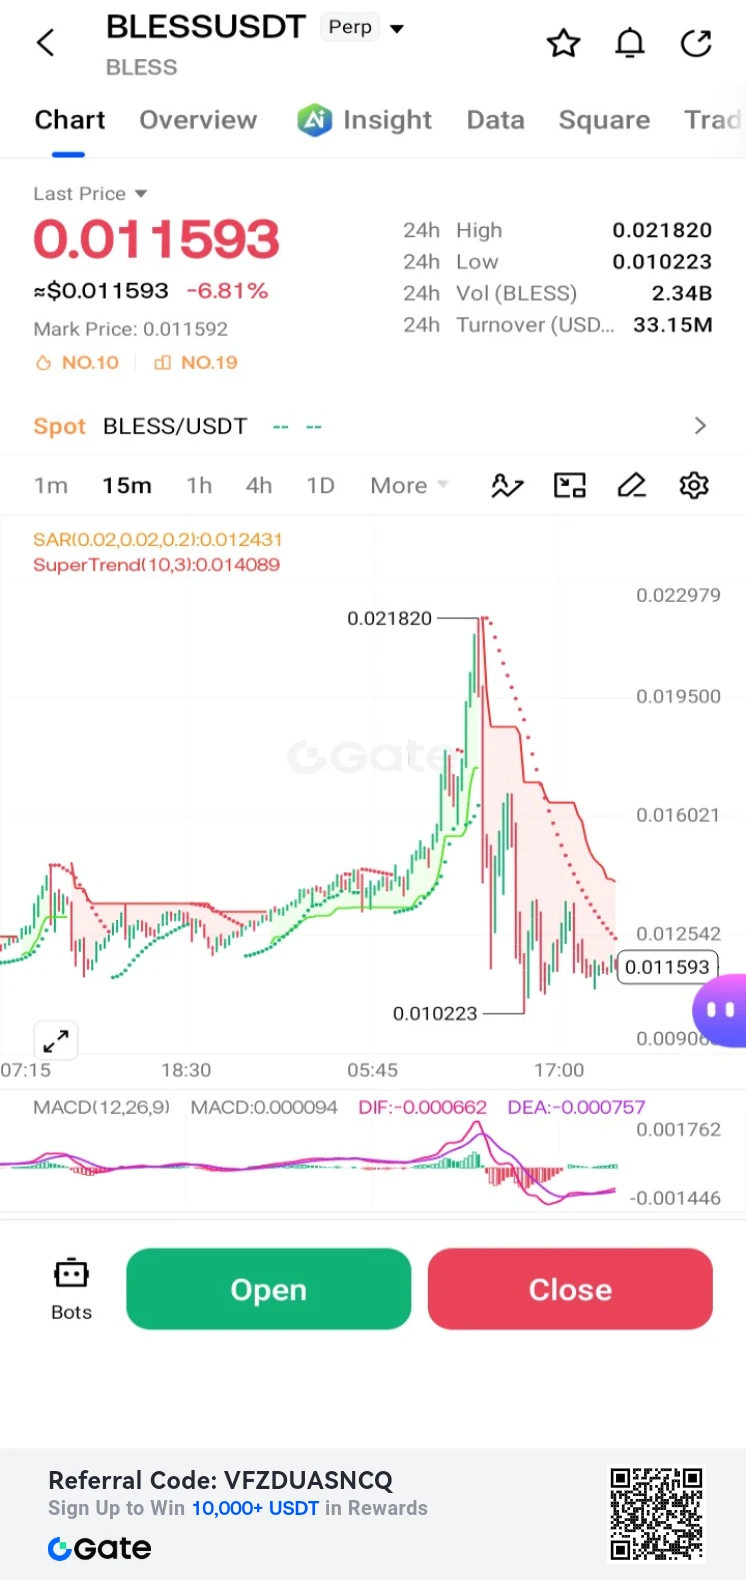
$BLESS /USDT Perp – "Post-Spike Retracement – Short"**
Trading Plan Short $BLESS
Entry: 0.011593
SL: 0.014089
TP1: 0.010223
TP2: 0.009000
BLESS is down -6.81% after rejecting the 0.021820 high. MACD is bearish; targeting a continuation down to the 0.010223 support.
post-image
BLESS-2.03%
$ETH If you can't get filled at an average price of 1,550.45, you can't chase it. Being able to place an order in the lowest zone at the tail end of a decline means the bet at the time was that "it couldn't fall any further," not that "it was starting to rise."

There was only one basis: after a sharp drop, the price failed to make a new low for the first time, and the rebound recovered half of the previous candle's body. At that moment, the bulls hadn't grown stronger; the bears had simply run out of steam.

The $135 move from 1,550.45 to 1,685.65 was fueled entirely by short covering, not by
ETH-1.23%
BTC-0.65%
SNDK-0.18%
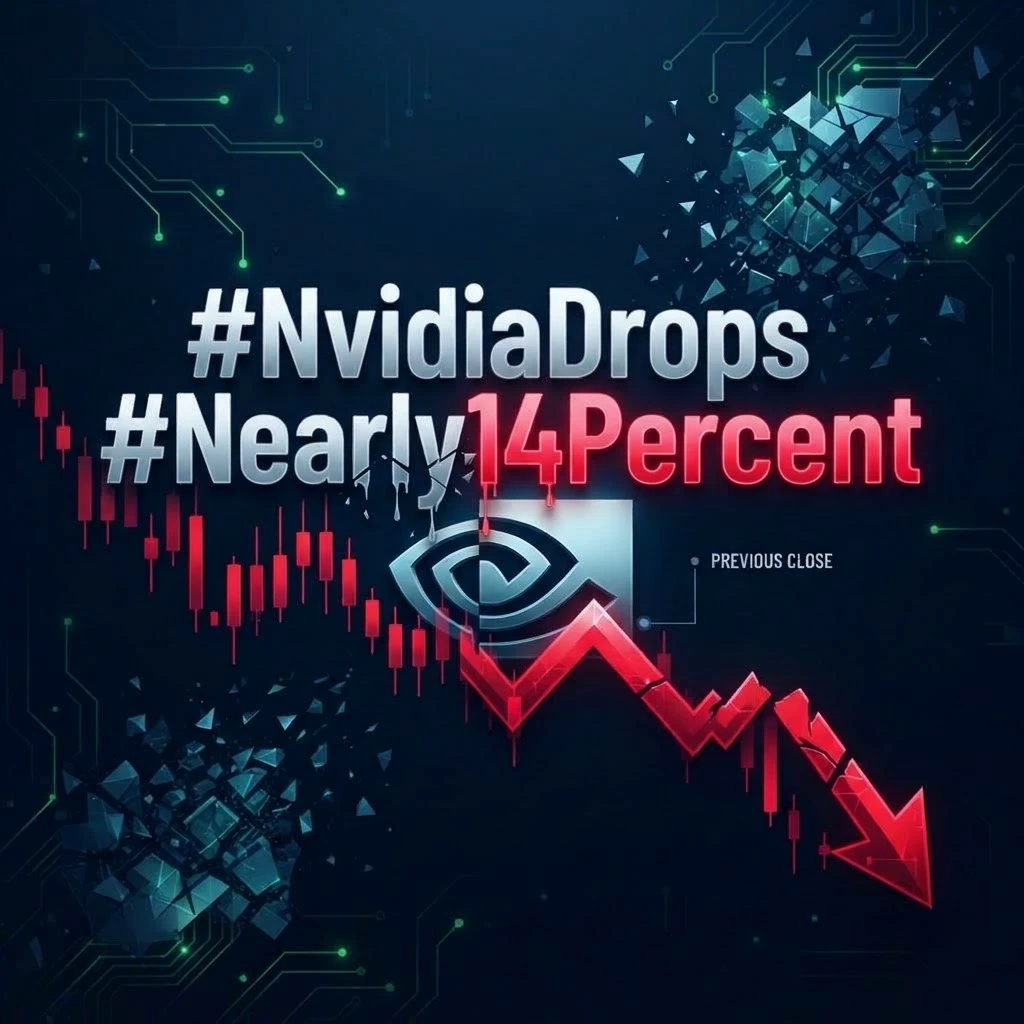
#NvidiaDropsNearly14Percent #ShareWeekly

NVIDIA at $128.45: Is This a Recovery Attempt or Just a Temporary Bounce After a Historic Sell-Off?

NVIDIA is entering a critical phase. After one of its most painful trading sessions in years, NVDA has moved back to approximately $128.45, showing some recovery from Friday's closing price of $125.53. However, the bigger question is whether buyers are finally returning or whether the market is simply taking a short break before another potential decline.

In my view, this is no longer just a technical correction. It is a combination of changing invest
post-image
NVDA-13.84%
BTC-0.67%
The old carpenter planes a board, stopping after every three strokes to feel the grain. You can’t rush it; the grain has a say of its own.
$ZS These past seventy-two hours have followed a similar grain. The afternoon before yesterday, it was still grinding around 193, with turnover just under 2 million. Even a little volume could push it along, and nobody paid much attention then. By night, the price began edging up. The pace wasn’t fast, but every pullback bottomed higher than the last—this kind of move doesn’t look like retail traders scrambling to buy; it looks more like someone had paved t
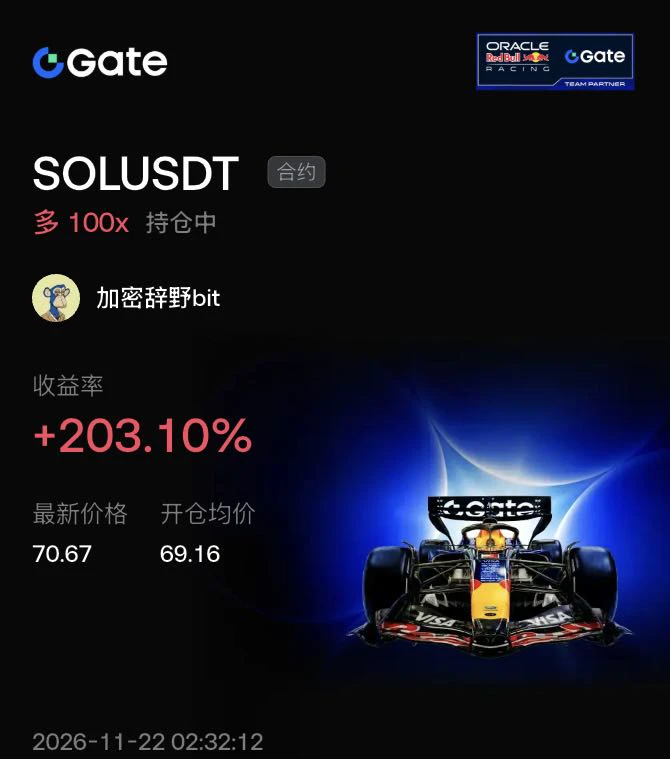
$SOL When trading, you must clearly understand the difference between higher and lower timeframes. The current rally in major coins after this sharp crash is basically just a brief recovery, so don’t mistake it for a reversal.

Look at this 1-hour chart: SOL plunged from 75 to 64.8—a brutal drop. After stabilizing at the bottom, it made a V-shaped rebound. I entered at 69, the right-side confirmation point, and went long with 100x leverage. I caught the profits from this sentiment-driven recovery, which pushed straight up to 70.67, netting 203%!

Why emphasize “brief recovery”? Because there’s
post-image
SOL-0.77%
BTC-0.65%
ETH-1.23%
  • 1
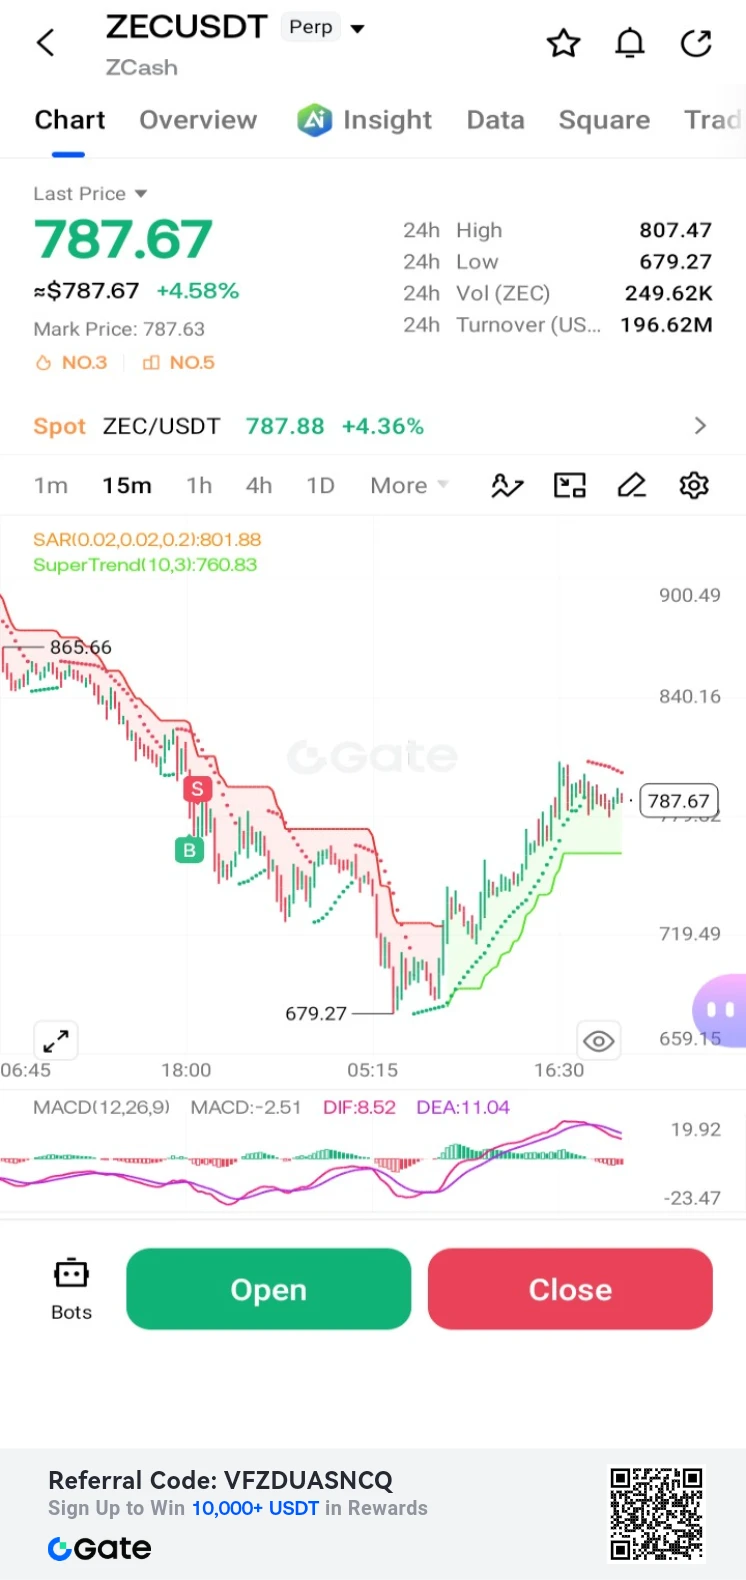
$ZEC /USDT Perp – "Sharp Recovery – Long"**
Trading Plan Long $ZEC
Entry: 787.67
SL: 760.83
TP1: 840.16
TP2: 865.66
ZEC is up +4.58% and recovering aggressively from the 679.27 low. MACD is strongly bullish; targeting the 840.16 resistance.
post-image
ZEC+1.29%
Drop already, I want to buy the dip. Damn, it actually rebounded 5,000 points in one day. Is this still the Bitcoin I know? I really misjudged you. Sorry, Bitcoin😭$BTC $ETH $ZEC ‌ ‌ ‌
post-image
BTC-0.65%
ETH-1.23%
ZEC+1.29%
BTC market updat
live-cover
LIVE1,494
BTC-0.67%
Load More

Join 40 M users in our growing community

⚡️ Join 40 M users in the crypto craze discussion

💬 Engage with your favorite top creators

👍 See what interests you

Trending Topics

BTCBreaksBelow60K

2.1M Views29.9K Discussing

BTC fell below $60,000 on November 20 for the first time since July, alongside a tech stock selloff and broader pressure on risk assets. Will $60K become resistance, or can BTC quickly reclaim it? What price or volume signals would convince you that selling pressure is easing?

GateDirectIPOPhase3ANTAllocates92100Shares

782.8K Views4.9K Discussing

NvidiaDropsNearly14Percent

328K Views7.6K Discussing

View More