

Share your thoughts
placeholder
Article
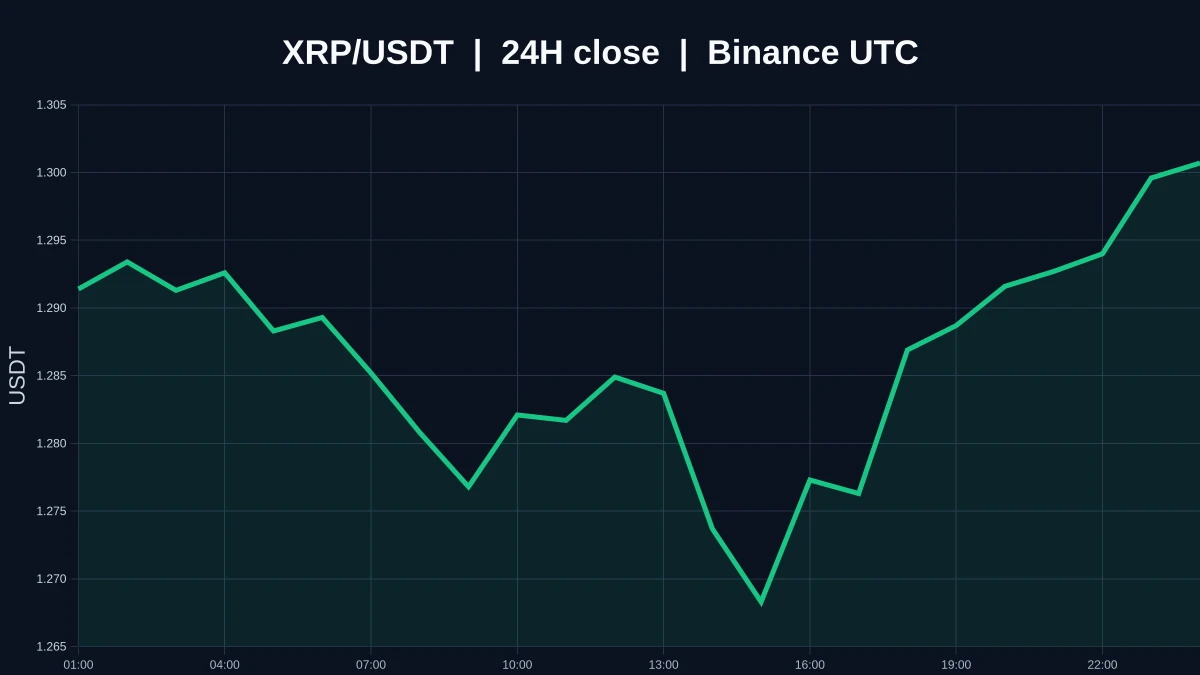
XRP just faked a breakout—the 4h chart is screaming SHORT at 1.417.

$XRP /USDT - SHORT

Trade Plan:
Entry: 1.415 – 1.419
SL: 1.438
TP1: 1.401
TP2: 1.390
TP3: 1.374

Why this setup?
The range-bound 1D trend is your tell. Price sits at the upper lip (1.419) with RSI 15m at a limp 50—no momentum to push higher. ATR 0.0088 shows volatility is compressed, meaning a snap back to TP1 (1.401) is the path of least resistance. Why now? The entry zone is tight, and the "Waiting" status means the trap is set before the next candle.

Debate:
Are you fading this push to 1.419, or waiting for a close ab
XRP-0.25%
September 7 Jinman Gold Morning Review:
Spot gold on the 4-hour chart has formed a bottoming and rebound pattern. After falling from the previous high to a stage low of 4282.53, the price stabilized and rebounded. It is currently quoted at 4428.61, overall remaining in a consolidation and recovery phase following oversold conditions.
Going forward, focus on statements from Federal Reserve officials and developments in geopolitical tensions. Hawkish signals will pressure gold prices, while rising safe-haven sentiment could support the bottom. News will have a clear impact on short-term price mo
post-image
ETH+0.49%
BTC-0.15%
I was just about to go to the forum and rant, but then I saw my balance and decided against it—the market is always right.

During the intraday plunge, $ZKC fell from 0.04950 all the way down. Watching the entire screen turn green actually calmed me down. Before that, it had rebounded several times, but every time it approached 0.04950, it was pushed back down. Selling pressure remained heavy, making it clear that no one above was willing to take the other side. So I didn’t chase longs; instead, I waited for the rebound to lose momentum and tried a short. The price has now dropped to 0.04876
post-image
ZKC-2.82%
BNB-2.77%
BTC-0.15%
$$COLLECT 24-hour drop of 29%, with trading volume surging to 38.8 million—this script is almost a carbon copy of the big bearish candle on May 19, 2021. The historical pattern is clear: the 6th–8th month after the halving is always a brutal shakeout. October 2020 was like this, and August 2016 was too. Each time, the main uptrend only began 30–60 days after the crash.
The current 0.0405 level happens to be the 0.618 golden retracement level of the previous rally. Yesterday’s sell-off occurred on exceptionally low volume, but trading value continued to expand, indicating that funds were buying
Everyone is staring at ADA’s green 15-min RSI, but the 4h tape just whispered something darker.

$ADA /USDT - SHORT

Trade Plan:
Entry: 0.2212 – 0.2224
SL: 0.2274
TP1: 0.2176
TP2: 0.2148
TP3: 0.2105

Why this setup?
Why now? The daily trend is range-bound, which means mean reversion is the game. RSI(15m) at 63 is a local overheat, not a breakout signal. ATR(1h) is thin at 0.0023, so the short squeeze fuel is low. We’re sitting at 0.2218 with a clear invalidation at 0.2133. If we reject 0.2224, the path to TP1 (0.2176) and TP2 (0.2148) is a straight line down. The 55 confidence score says "p
post-image
ADA0.00%
My hand trembled when I set the stop-loss a few days ago, only to realize this morning that the filial piety was unnecessary. 😌

As the market repeatedly swung intraday, the price kept grinding around 91.82, with the volume shrinking more and more noticeably. Someone stepped in to buy every dip. I watched it for half a day; this kind of level is more of an opportunity than a panic signal, so I cautiously took a shot.

The price has now climbed to 104.92, giving a floating profit of +687.56%. We caught the rhythm of this move perfectly, and everyone is feeling great.

Don't lose your patien
post-image
ADA0.00%
ZEC+20.51%
Financial News, Crypto Updates, Real-World Strategies
live-cover
LIVE1,480
I didn’t chase when the price broke above the previous high, waiting instead for a pullback to stabilize around 0.08280 before going long. A genuine breakout rarely completes in one move; positions accumulated after a pullback confirmation are often more solid.
Then the price moved upward in small steps, with key levels rising successively. The fake bearish candle in the middle shook out quite a few short-term traders, but the bulls held the level and continued at their own pace.
After the unrealized profit reached +632.02%, I reduced the position by 70% and moved the protection level for the
post-image
SNDK+1.13%
ZEC+20.51%
MARKET prediction
live-cover
LIVE50
I originally wanted to cut my losses and sacrifice to the heavens, but the ritual failed—the meat roasted itself.

As the price repeatedly oscillated intraday, the more I watched $PUMP rebound, the more fake it looked. It repeatedly pushed to 0.004390, falling just short every time; after breaking upward, nobody followed through, looking exactly like a pump-and-dump. I judged that the high was already under pressure and placed a small short order, ready to patiently wait for the market to turn. But the market did not give me much time to hesitate. The price gradually slid to 0.003878, and th
post-image
PUMP-1.65%
SOL+1.76%
BTC-0.15%
Most traders missed NEAR's 84% short signal because the 1D trend screamed bullish.

$NEAR /USDT - SHORT

Trade Plan:
Entry: 2.4312 – 2.4610
SL: 2.6323
TP1: 2.3065
TP2: 2.2134
TP3: 2.0737

Why this setup?
- The 4h timeframe is flipping bearish against the daily uptrend—this is the classic “bull trap” setup.
- RSI 15m at 55 shows weak momentum, not enough fuel to break 2.4610 resistance.
- Entry zone 2.4461 with TP1 at 2.3065 gives a 5.7% move before the daily trend reasserts.
- ATR 1h (0.0597) means volatility is compressed—breakouts are violent. Why now? Price is stalling under supply
NEAR+11.21%
Everyone’s watching $SPCX /USDT pump—but the 4h chart just whispered a secret that most retail will ignore.

$SPCX /USDT - SHORT

Trade Plan:
Entry: 151.06 – 151.26
SL: 152.44
TP1: 150.20
TP2: 149.56
TP3: 148.60

Why this setup?
- Price is pinned at 151.16 with a **SHORT bias (77% confidence)** while the daily trend says “range”—that’s a compression zone.
- RSI on 15m is only 57.97—not overheated, not cold. It’s a **lull before a snap**, not a breakout signal.
- ATR on 1h (0.41) is tight—meaning the next 4h candle could stretch 3x that move.
- The “Waiting” status + invalidation at 14
SPCX+0.93%
#Gate用户突破6000万,来 用户突破6000万,来 Gate Reaches 60 Million Users Worldwide!
60 million users is not just a number — it represents millions of trading journeys, unforgettable moments, lessons, profits, losses, and memories created along the way.
Do you remember when you first joined Gate?
Do you still remember your first trade?
Maybe it was a perfect entry… or maybe the market taught you an unforgettable lesson!
For me, every trade tells a story. Some bring excitement, some bring valuable lessons, and some become memories that we can laugh about years later.
Now Gate is inviting its community to
post-image
GT-1.93%
post-image
GOOGL-0.29%
NVDA+0.26%
OPENAI-0.01%
  • 12
After $FARTCOIN rallied, I didn’t exit my entire position. I took 80% in profits first and moved the protective stop on the remaining position above breakeven. Just now, a quick pullback took out the remaining position, locking in the profits smoothly.

The entry reason was simple: on the hourly timeframe, price pulled back to the previous high without continuing lower, and instead reclaimed the area above the moving average on rising volume. This was a textbook pullback confirmation. After going long, I kept my stop loss below the lower boundary of the small range.

After the pullback took
post-image
FARTCOIN+2.63%
SNDK+1.13%
ZEC+20.51%
how’s your weekend going?
post-image
$METIS Signal】4H upper band breakout, go long with the trend
$METIS RSI 77, the 4H upper band at 3.3568 has been broken, and the current price of 3.457 is hugging the outer edge of the upper band. 1H MACD bullish volume continues to expand, while RSI at 69.78 has not reached extreme flattening. Sell pressure dominates the order book, funding rate is -0.0082%, and OI is stable. Buyers are still attempting to push higher, but depth imbalance is limiting smooth movement. Chasing a long at the current price offers a 1.5 risk-reward ratio, with moderate upside, but momentum is dominant, so executi
post-image
METIS+23.94%
BTC-0.15%
ETH+0.49%
SOL+1.75%
$ARB Signal】1H pullback to EMA20 + 4H bullish continuation
$ARB 1H pullback to EMA20, current price 0.18475; the 4H MACD histogram at 0.0032 is narrowing. Order book imbalance is -4.41%, 1H RSI 55.35 is neutral, funding rate is 0.0065%, OI is stable, and short-term leverage is not crowded. The 1H MACD negative histogram is contracting, with price consolidating between 0.1805-0.1850.
🎯Direction: Long
⚡Entry/Limit Order: 0.1841957 - 0.1847500
🛑Stop Loss: 0.1755125
🚀Target 1: 0.1986063
🚀Target 2: 0.2055344
🛡️Trade Management:
- Execution Strategy: After reaching Target 1, reduce the positio
ARB+5.64%
With this kind of move, I don't even need to think—the account is partying on its own 💃

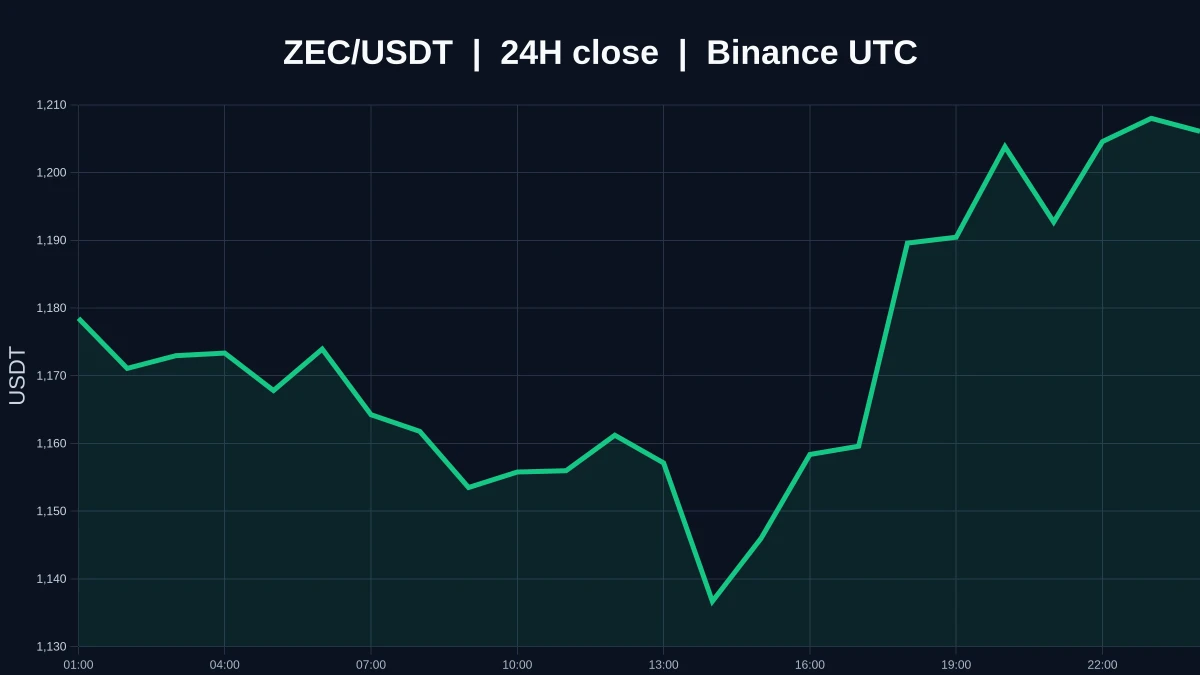
A few days ago, the last thing I saw before bed was $ZEC still building a base up front without ever breaking down. The candlesticks looked dull, but funds had actually been testing the market in the shadows, and the buying pressure was already impossible to hide. Before bed, I left just one sentence: If there is no volume at the bottom, just wait.

Then I opened my eyes and the market took off 🚀, surging from 833.19 to 1217.25, with the position's return shooting straight above +3277.45%. It was trul
post-image
ZEC+20.51%
SNDK+1.13%
ADA0.00%
Load More

Join 40 M users in our growing community

⚡️ Join 40 M users in the crypto craze discussion

💬 Engage with your favorite top creators

👍 See what interests you

View More