

Share your thoughts
placeholder
Article
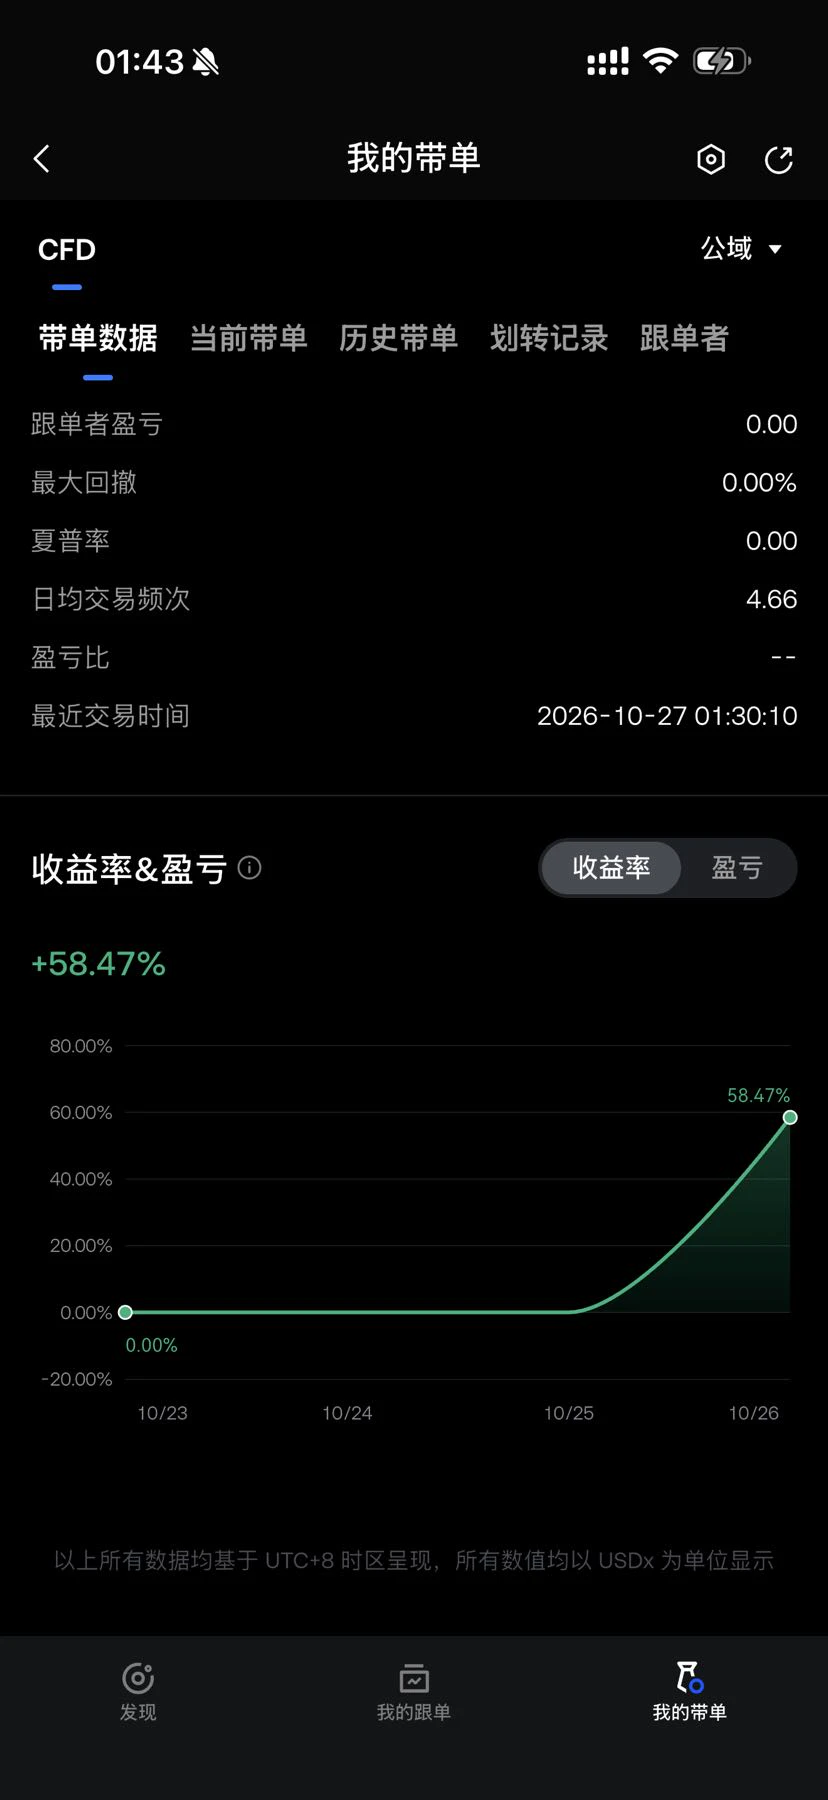
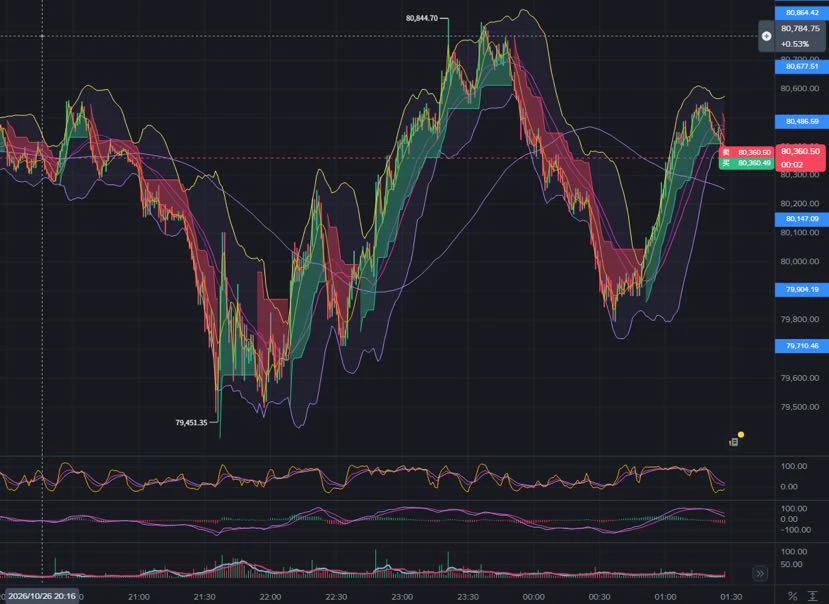
No big-picture thinking, can’t hold on—the profits on this move are paper-thin, but I absolutely love it. 💸
When the market plunged intraday, I chased a short at 0.7915. The selling pressure was too strong, so the rebound couldn’t hold at all; every move back into the green was just fuel for the shorts. In this kind of market, hesitation means losing—only those willing to follow the move get rewarded.
Now at 0.2368, +1380.15%, those aboard should be laughing themselves awake. 😏 Nothing matters more than getting the timing right. From entry to taking profit, everything went smoothly, with not
post-image
ZEC+7.22%
ETH-2.08%
The $DASH 10x long position is making a push.
DASH+26.29%
I originally wanted to cut my losses as an offering to the heavens, but the heavens weren’t appeased—the meat cooked itself. When the screen was flashing green, $MSTRX kept moving sideways at the bottom without breaking down, while funds were still quietly entering. I’ve seen this signal too many times. I said it outright at the time: this wasn’t a bearish trend—it was an opportunity to get in. Entered at 129.26, now at 143.37, +522.71%. Brothers, this run wasn’t endured for nothing. Without conviction, you can’t hold on; the profits this time are as thin as paper, but I love it. In terms of e
post-image
MSTRX-0.91%
ETH-2.08%
ADA-4.69%
#GateTops7DayNetInflowsGlobally
Gate has emerged as a leading global cryptocurrency exchange for 7-day net inflows, highlighting strong user activity and capital movement onto the platform. Net inflows measure the amount of crypto entering an exchange after accounting for withdrawals, making the metric a useful indicator of investor engagement and trading interest.
Gate’s strong performance suggests that traders are increasingly using the platform to position themselves across major cryptocurrencies and emerging altcoins. Higher inflows can reflect increased trading activity, new user deposit
post-image
[New Streamer] Market Prediction
live-cover
LIVE88
We all know how this ends..
Right?
$TROLL
post-image
TROLL+52.05%
TROLLFACE-0.87%
$AKE Everyone, don't give up. The price will only keep going higher, higher, higher, and higher. We might make it to the bull market and truly achieve financial freedom—real financial freedom.
AKE-13.41%
The New Addresses baseline is still basically unchanged from a couple of weeks ago, when bitcoin:native was around $60K.
That is exactly why I’m NOT interested in altcoins and likely won’t be for the foreseeable future.
Altcoins need one of two things:
High-timeframe distribution from bitcoin:native and $ETH
NEW capital entering the crypto market
Right now, neither condition is met.
Until that changes, I expect bitcoin:native and $ETH to remain the main liquidity magnets, while most altcoins continue to underperform.
post-image
BTC-2.13%
ETH-2.11%
Everyone’s long $CL /USDT at 91.15, but the 4h tape is quietly screaming for a fade.

$CL /USDT - SHORT

Trade Plan:
Entry: 90.98 – 91.32
SL: 92.82
TP1: 89.90
TP2: 89.06
TP3: 87.81

Why this setup?
Why now?
- 1D is a **range**, not a breakout—so 91.15 is resistance, not support.
- RSI on the 15m is only 56, meaning no momentum spike to chase longs.
- ATR (1h) at 0.69 shows volatility is compressing—ranges snap fast.
- Short setup targets 89.90 (TP1) then 89.06 (TP2), while invalidation sits at 88.47.
- Confidence is 55.4—not a home run, but a high-probability scalp if 91.32 holds.
CL-0.51%
NVDA Still Leading The AI Race — Can Bulls Push Higher?
$NVDA is trading around the $230 zone, and this area is becoming very interesting for the next move. After recovering from the recent pullback, Nvidia is showing strength again as buyers continue to defend important levels.
My view is that NVDA remains one of the strongest AI-related stocks because the market is still focused on AI infrastructure growth, data center demand, and Nvidia’s dominant position in advanced chips. Recent momentum has improved as investors regain confidence in the AI sector.
From a technical perspective, holding
post-image
NVDA+0.87%
Everyone’s still barking up the wrong tree on DOGE—the 4H chart just whispered a secret the crowd missed.

$DOGE /USDT - SHORT

Trade Plan:
Entry: 0.08449 – 0.08497
SL: 0.08707
TP1: 0.08297
TP2: 0.08181
TP3: 0.08005

Why this setup?
Why now? The 1D trend is *range*, not bull—so longs are playing hopscotch in a minefield. RSI on the 15m is at 44.19, losing upside steam. ATR (1h) at 0.000975 shows volatility is compressing, but the short setup is "Armed" with entry at 0.08473. TP1 (0.08297) is a clean 2% drop, and TP3 (0.08005) is a 5.5% slide. The invalidation at 0.08551 is tight—only 0.9% a
DOGE-4.27%
$1000 to $100,000 Crypto Trade Challenge Today
live-cover
LIVE521
📊 $龙虾 #Meme ⚡ Bullish
🦞 龙虾 EXPLODES to Fresh Highs Near $0.0847 Meme Momentum Still Building
This Chinese meme coin bottomed hard at $0.058 after an earlier violent spike-and-crash, then ground steadily higher through a long base before punching to a brand new local high on a powerful green candle. With MAs bullish-stacked and no rejection wick yet, this looks like fresh momentum reasserting itself.
Signal Block
- Pair: $龙虾 /USDT
- Type: LONG
- Leverage: 3x
- Entry Zone: $0.0795 – $0.0820
- Take Profit:
TP1 $0.0845 +27.4%
TP2 $0.0870 +40.6%
TP3 $0.0887 +49.4%
TP4 $0.0920 +67.0%
- Stop
post-image
龙虾+20.40%
  • 7
  • 2
A few days ago, my hand trembled as I set the stop-loss; this morning I realized that filial piety was unnecessary😂. When the price plunged intraday, $SCRT struggled to rebound, with every push upward falling just short. Volume failed to follow, while selling pressure remained genuinely heavy—the signs of a bull trap were unmistakable. I know this kind of market all too well.

Going long in this kind of market is just giving money away, so I went with the trend and opened a short at 0.01082. I just refreshed again, and the current price has already slipped to 0.00765, with unrealized gains a
post-image
SCRT-4.32%
XRP-4.49%
SNDK+11.97%
Everyone’s long XRP, but the 4h chart just whispered a secret no one’s ready to hear.

$XRP /USDT - SHORT

Trade Plan:
Entry: 1.3947 – 1.4025
SL: 1.4360
TP1: 1.3705
TP2: 1.3518
TP3: 1.3238

Why this setup?
- **Why now?** RSI on the 15m is cooling at 44.45—momentum is fading, not flipping.
- **The trap line:** 1.4057 is the invalidation; we’re sitting at 1.3986 with a ceiling of 1.4025.
- **Range-bound 1D** means breakouts are fake until proven. Short targets are stacked: 1.3705 → 1.3518 → 1.3238.
- **Risk is tight** (SL 1.4360) vs. reward—this is a scalp, not a saga.

Debate:
If 1.40
XRP-4.49%
A few days ago, my hand trembled as I set the stop-loss; this morning I realized that was an unnecessary act of filial piety. When the screen was all green, $PROM was still holding firm around 7.149, but every push upward fell just short. I know this rebound pattern all too well—it was merely a fake move put on for retail traders.

After seeing the bearish news, the rebound was even feebler. My judgment at the time was simple: resistance above was obvious, and there was no one to buy into a move higher, so I went with the trend. Then 5.131 taught me a lesson directly. With 80% locked in, get
post-image
PROM+3.53%
ETH-2.08%
LAB-0.27%
$VELVET is mainly shorting; always shorting, making a killing—feels great.
post-image
VELVET-19.82%
#非农就业报告即将揭晓
The U.S. August Nonfarm Payrolls (NFP) report is one of the most important macro events for global markets, and tonight’s release could create major volatility across Bitcoin, crypto, stocks, gold and the U.S. dollar.
Markets are expecting August payrolls to increase by around 56,000 jobs, compared with -23,000 previously, while the unemployment rate is forecast to remain at 4.1%. Average hourly earnings are expected to rise 0.3% month-over-month, with annual wage growth slowing to 3.0% from 3.2%.
Normally, weaker employment data is viewed as positive for risk assets because it re
NFP-10.66%
BTC-2.13%
  • 2
Most traders still think XLM is going long—here’s why the 4h chart is screaming otherwise.

$XLM /USDT - SHORT

Trade Plan:
Entry: 0.17888 – 0.17984
SL: 0.18398
TP1: 0.17589
TP2: 0.17358
TP3: 0.17011

Why this setup?
Why now?
- 1D trend is *range*, not bullish—so upside is capped.
- RSI (15m) at 45.7 shows weak momentum, but the 4h bias is SHORT with 55% confidence—a slow bleed, not a crash.
- Price sits at 0.17936, right at the entry ref. TP1 at 0.17589 (-1.9%) is the first magnet; TP2 at 0.17358 (-3.2%) if support cracks.
- The alt (long) setup is invalid above 0.18173—so any pump
XLM-3.89%
Load More

Join 40 M users in our growing community

⚡️ Join 40 M users in the crypto craze discussion

💬 Engage with your favorite top creators

👍 See what interests you

View More