Square
Following
Hot
News
Notifications
Profile
Share your thoughts
placeholder
Article
What’s easiest to misread when $ONE’s two time frames haven’t aligned yet?

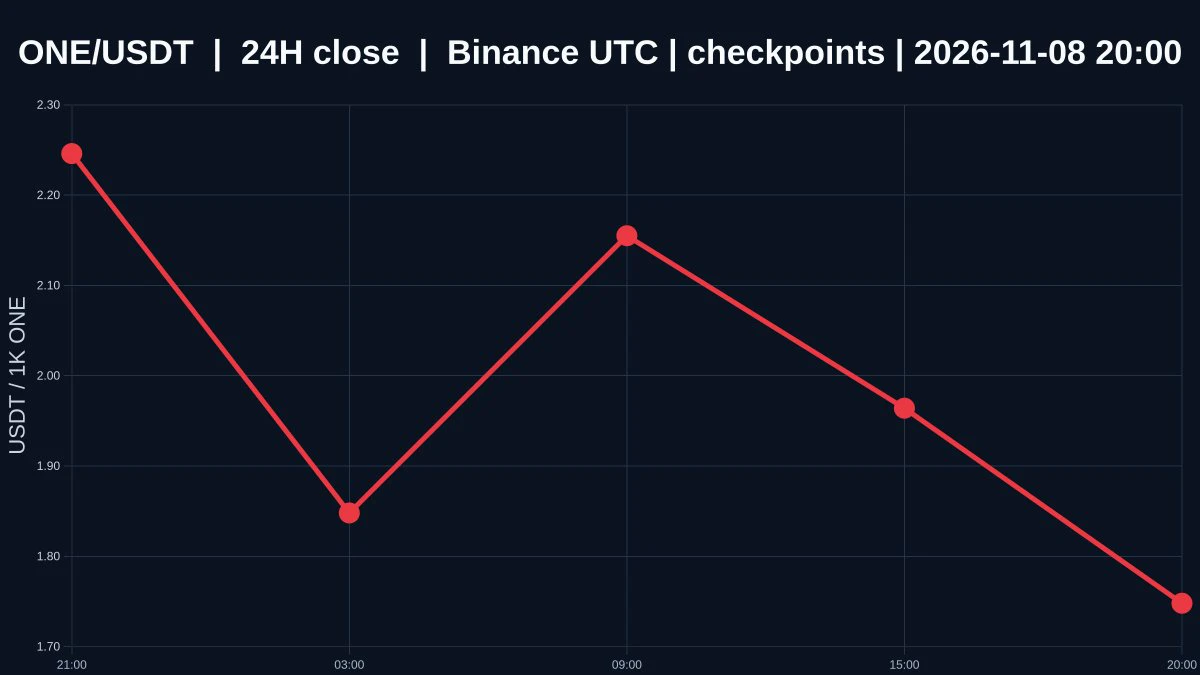
$ONE is currently priced at 0.001748, down 26.77% over 24 hours, with an intraday high of 0.00243 and a low of 0.001692. The 1-hour trend is weak, while the 4-hour trend is strong. The volume ratio is 0.10325723931514065. The two time frames point in opposite directions, so the trend has yet to be confirmed.

At 0.001748, the price is only 0.000056 above the 1-hour support at 0.001692, but 0.000682 below resistance at 0.00243. This puts it clearly closer to support. Whether support at 0.001692 holds depends on whether
post-image
$EVAA This -16.88% dump has left me down 3200U on my position, and I haven't moved my stop-loss. The current price is 1.0945; over the past 24 hours, it plunged straight from 1.41 to 1.0469. The 23.6M in trading volume shows this isn't a liquidity crunch—someone is actively selling.
Market sentiment is clear: every bounce near 1.15 gets capped. Funds are reducing positions into the rebound. This isn't panic selling; it's an orderly exit. I plan to open a small position in the 1.05-1.08 range, keeping it below 5% of my total capital, with a stop-loss below 1.02, a first take-profit target of 1.
EVAA-0.49%
Trenches
ZIG
Z
bade
b
ZIG
0x8c...1145
Market Cap
$.
Change
.
24h Vol
$.
Holders
.
BTC
B
bade
b
BTC
C5xp...pump
Market Cap
$.
Change
.
24h Vol
$.
Holders
.
STONK
S
bade
b
STONK
6GmA...UNgx
Market Cap
$.
Change
.
24h Vol
$.
Holders
.
MAGGIE
M
bade
b
MAGGIE
8rHo...PmZV
Market Cap
$.
Change
.
24h Vol
$.
Holders
.
ANSEM
A
bade
b
ANSEM
9cRC...pump
Market Cap
$.
Change
.
24h Vol
$.
Holders
.
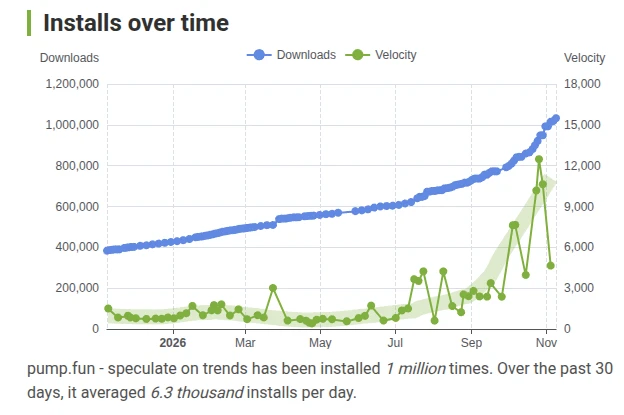
Robinhood Wallet app downloads spiked with the chain release, likely just crypto natives checking listings, then faded
The idea that "RH normies are buying our bags" was always a data-free myth. Compare with apps like Pumpfun which continue to grow
post-image
market prices updattes
live-cover
LIVE88
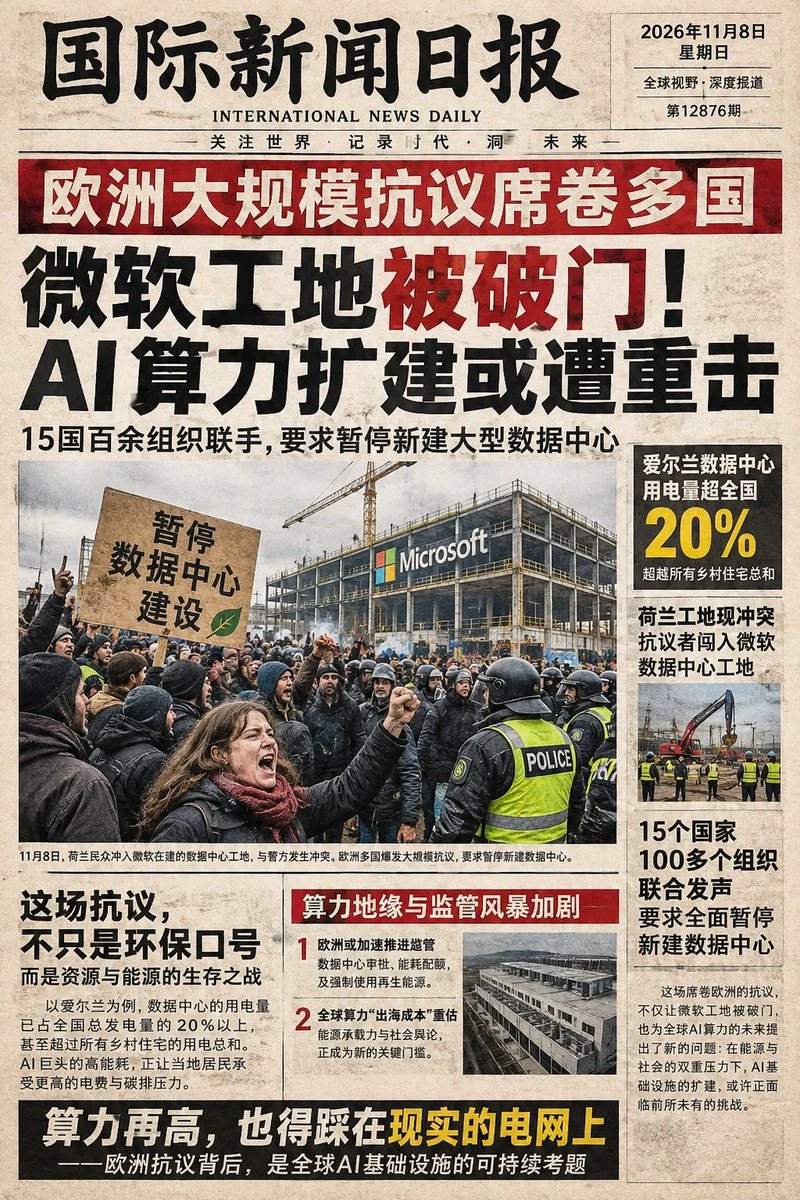
This is bad—even a Microsoft construction site has been broken into! These massive protests erupting across Europe could end up dealing a serious blow to the global expansion of AI computing capacity.

On November 8, 2026, more than 100 civil society organizations across 15 European countries suddenly joined forces to launch large-scale protests, demanding a complete halt to all new large data center construction. The streets of Ireland and Finland are already packed, and the Netherlands has gone even further: protesters stormed a Microsoft data center construction site that was still halfway
post-image
MSFT-0.95%
Bitcoin ETFs saw a net outflow of $412 million, with BlackRock’s IBIT posting a net outflow of $403
live-cover
LIVE11
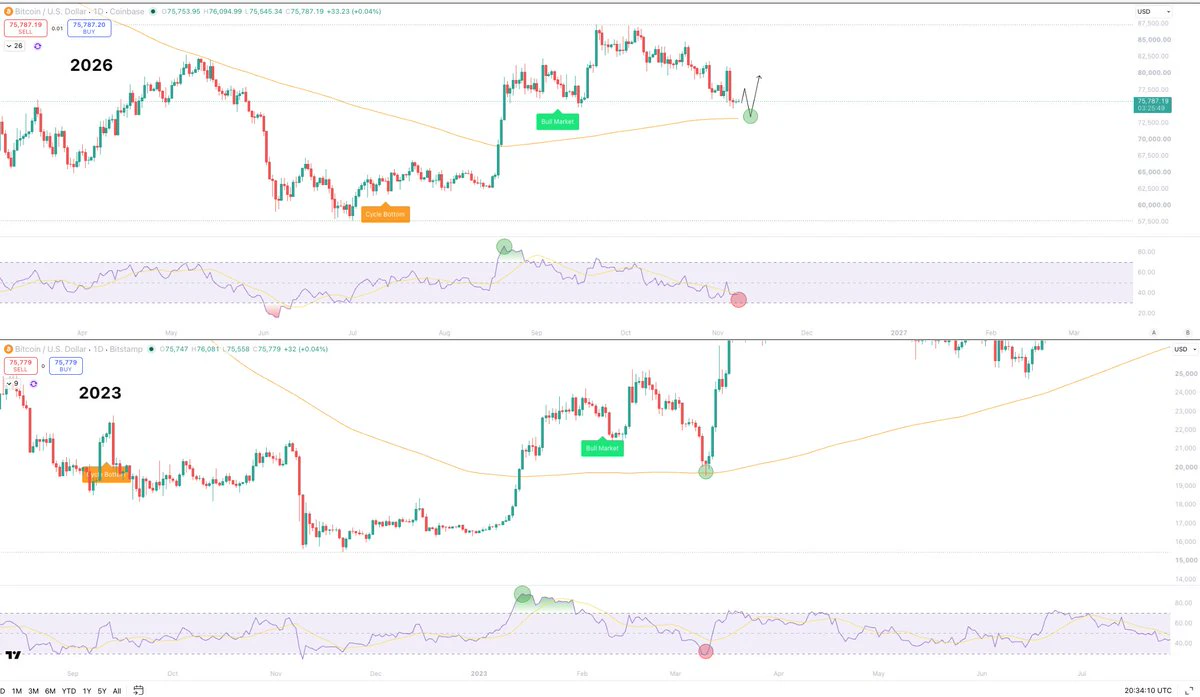
Big move for Bitcoin is loading.
The setup continues to mirror 2023 almost exactly.
In both scenarios we have:
- Cycle bottom signal
- Reclaim 200D SMA
- 85+ on the 1D RSI
- Bull market signal confirm
- Corrective PA leading down to the 200D SMA
- Near oversold levels on 1D RSI
A big move is brewing one war or the other.
Respect the 200D SMA, as well as the other levels its testing right now, and we get our next impulse higher.
Lose the 200D SMA and we will fall quickly.
200D SMA is the level I would not want to see us lose.
Until then though, this is a very high R/R setup, where Bitcoin is p
post-image
BTC-0.67%
I was hoping to watch the markets less this weekend
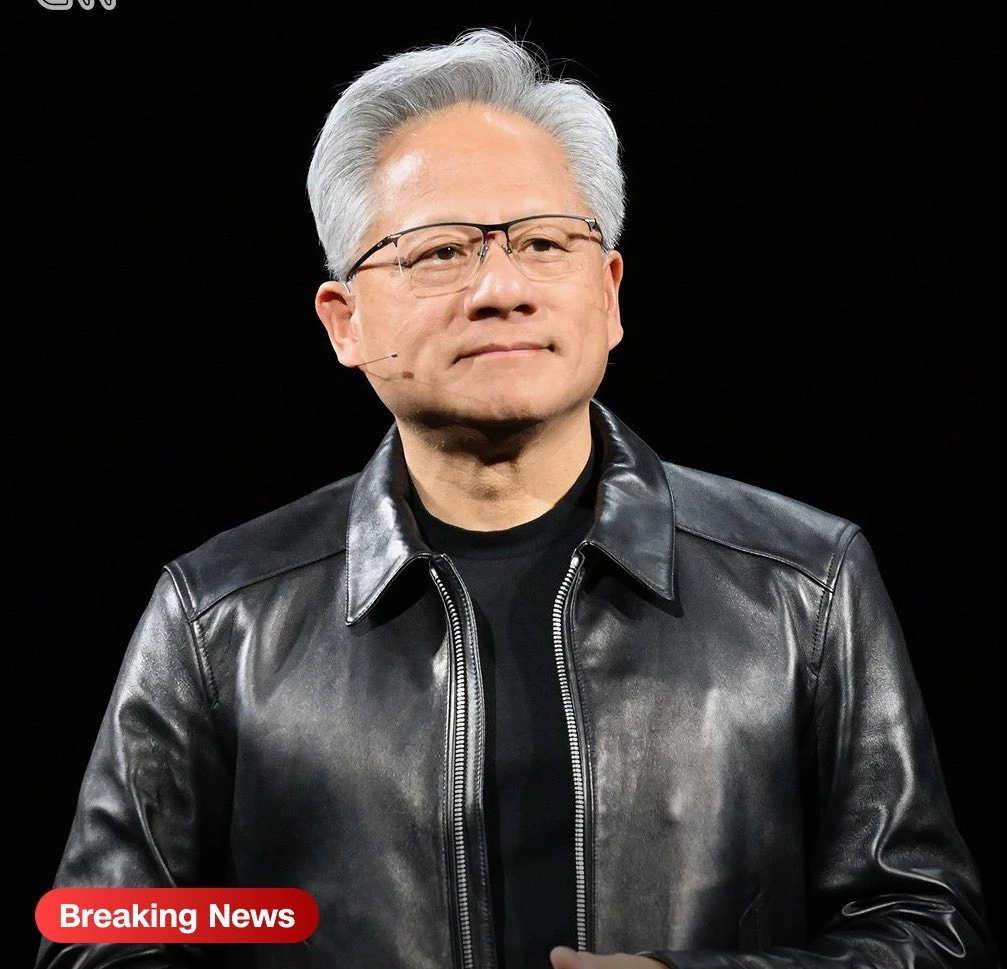
Then Nvidia’s board issued a statement
They’re launching an independent investigation
To determine whether Jensen Huang became the target of a foreign intelligence operation
Independent directors will form a committee
And bring in outside independent counsel to assist
The statement said
There is currently no reason to believe national security or company secrets have been compromised
But they will review all available information
Jensen Huang has already emailed employees
Acknowledging he was unfaithful to his wife and apologizing
He also sai
post-image
NVDA+2.80%
Would you buy or avoid buying this chart?
post-image
$ERA ‌ is quietly building momentum again.

Price has recovered from the $0.05627 low and is now trading around $0.0755, with the daily Supertrend bullish at $0.05389. The recent candles show buyers gradually regaining control.

Key levels to watch:

Support: $0.0718
Next support: $0.0639
Major support: $0.0539
Resistance: $0.0814
Next target zone: $0.0840 to $0.0940

A daily close above $0.0814 would strengthen the bullish case. Until then, holding above $0.0718 remains important.

The recovery looks promising, but confirmation above resistance is what matters now.

$AMD ‌#Ahr999EntersBott
ERA+24.21%
AMD+11.55%
ETH Technical Outlook: Ethereum Struggles Below $2,385 as Key Support Remains Under Pressure

Ethereum is showing a weak daily structure after facing rejection from the $2,700 area. Price is currently trading near $2,232, below all four major EMAs. Although buyers are attempting to stabilize the market around $2,230, momentum remains relatively weak.

The next move will depend on whether ETH can reclaim its EMA resistance zone or whether sellers push price toward lower support levels.

1. EMA Structure: Sellers Maintain Control

Current ETH price: $2,231–$2,233

- EMA 20: $2,318.22
- EMA 50: $
ETH-1.26%
  • 2
  • 1
#70%OfAltcoinsFallBelow200DMA
Market Observation: 70% of Altcoins Now Below 200DMA

Recent data from CryptoQuant analyst Darkfost indicates a notable shift in the altcoin market structure. According to the report, approximately 70% of altcoins are currently trading below their 200-day moving average (200DMA). This is a sharp increase from early October, when the figure was around 10%.

The 200DMA is a widely used technical indicator to gauge longer-term market trends. A broad breakdown below this level often indicates a shift in market momentum toward a bearish phase or a period of prolonged
  • 2
  • 1
The game isn't over, never give up!
post-image
Entering crypto with 100 yuan, what you really need to guard against isn't the market—it's yourself
Let's do the math first: 100 yuan comes to less than 15U.
What can 15U do? With 20x leverage on ETH futures, a 1% price move makes your account wobble; a 5% move, and you won't even get a chance to recover. In other words, you're not trading—you're buying a heartbeat with the price of a meal.
But many people start exactly this way—the smaller the capital, the more they want to take a shot; the more they want to take a shot, the bigger the position; the bigger the position, the more one pullback
post-image
BTC-0.65%
all of the internet called jensen a chad for this and now forced to resign from nvidia cause of this??
post-image
NVDA+2.80%
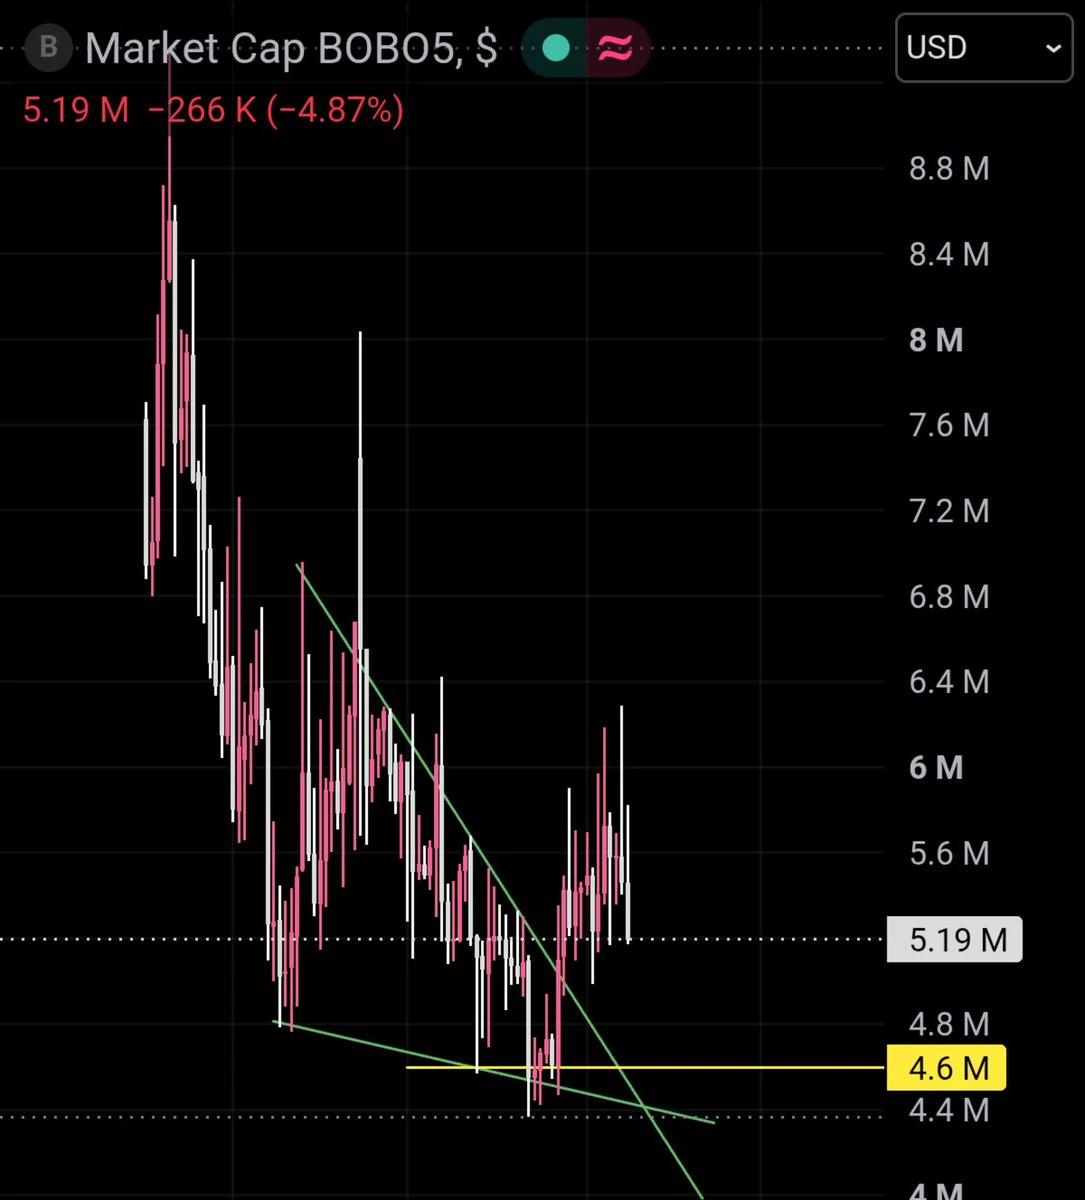
Full retrace?
$BOBO
post-image
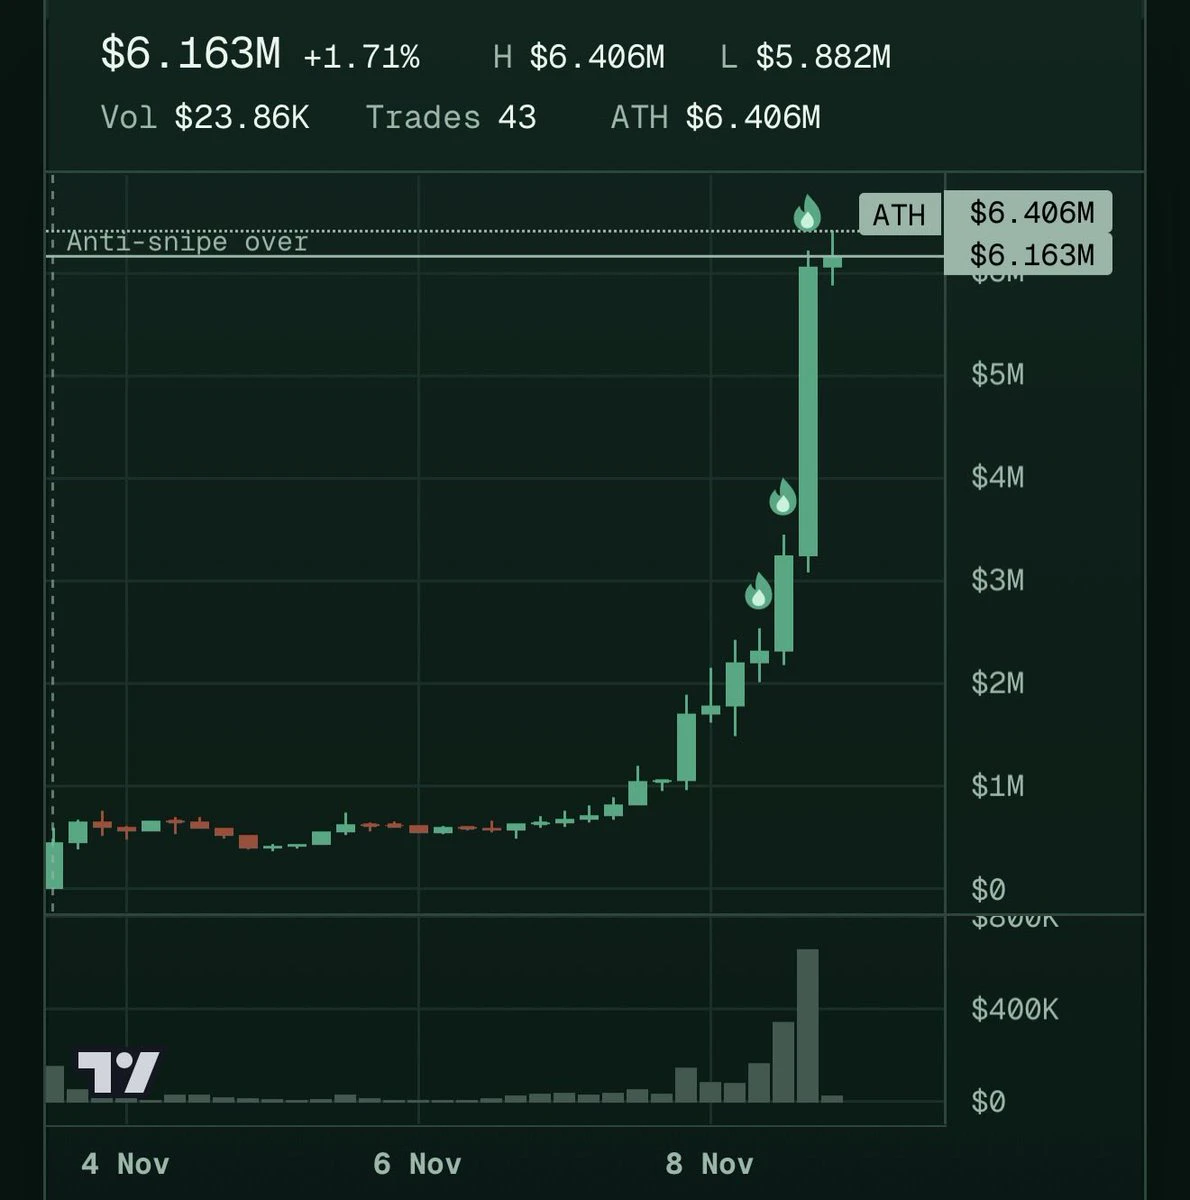
500% in 24h for $VOLTA gg
post-image
$700 days aren’t bad I guess
post-image
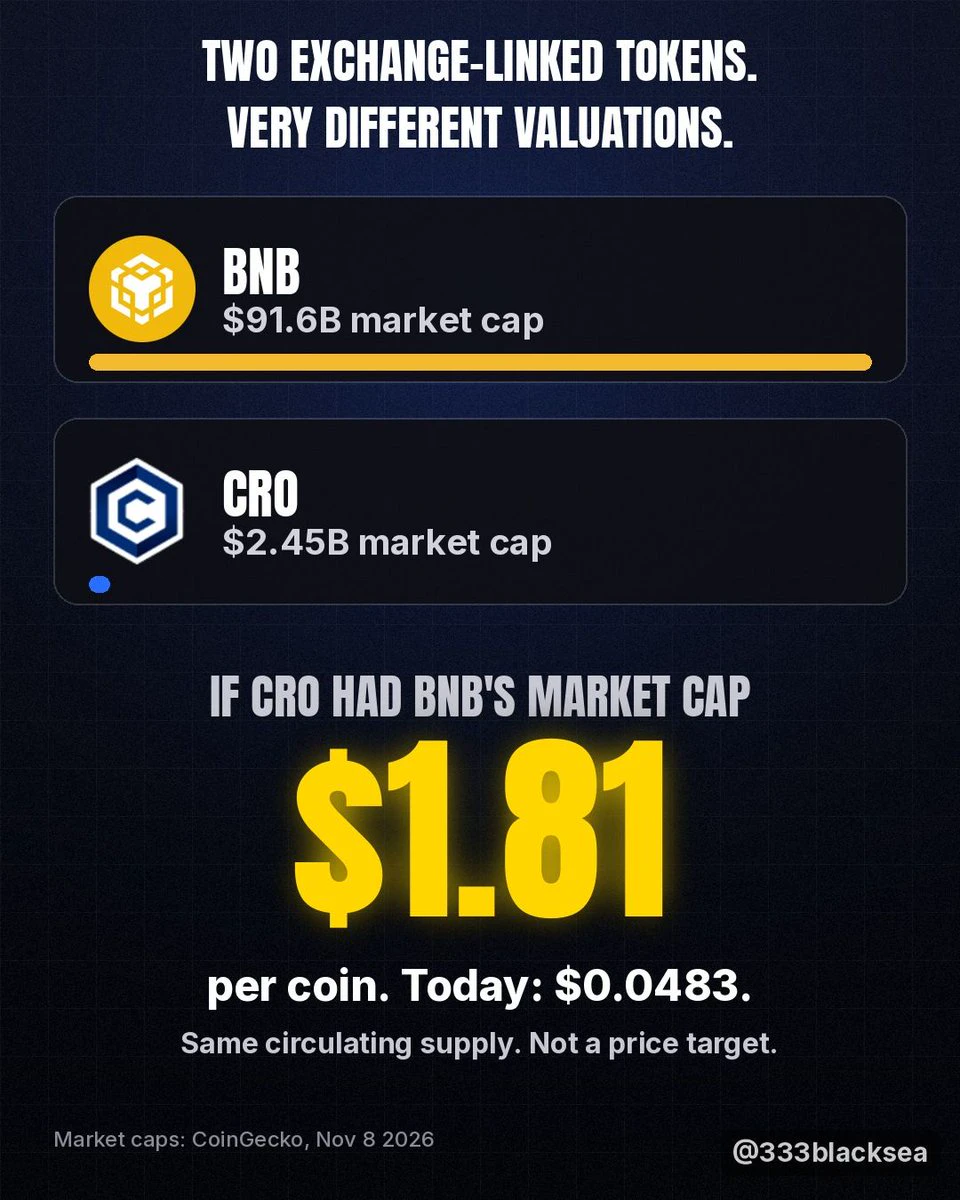
BNB is worth $91.6 billion.
CRO is worth $2.45 billion.
Two exchange-linked tokens. Very different valuations.
At BNB's market cap, CRO would be about $1.81 at today's circulating supply.
It's $0.048 today.
Which one is mispriced?
post-image
BNB-0.76%
CRO-2.47%
one thing must kill a man
post-image
Load More

Join 40 M users in our growing community

⚡️ Join 40 M users in the crypto craze discussion

💬 Engage with your favorite top creators

👍 See what interests you

Trending Topics

USCPIDataIncoming

15.83k Views1.66k Discussing

The U.S. October CPI report will be released on November 10 at 8:30 a.m. ET. September CPI came in at 3.7% year over year, and markets will be watching closely for signs that inflation is cooling, especially in core CPI. A softer-than-expected reading could strengthen rate-cut expectations, while hotter inflation may pressure risk assets through higher Treasury yields and a stronger dollar. How do you think this CPI print will move $BTC, U.S. stocks and gold?

USAIStocksHitHard

29.43k Views3.74k Discussing

USNonfarmPayrolls

57.15k Views4.5k Discussing

View More