



Share your thoughts
placeholder
Article
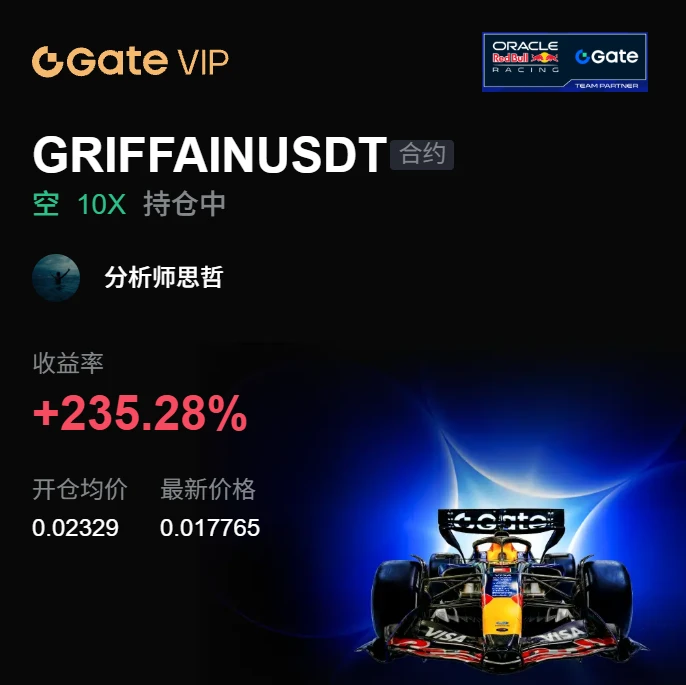
This trend is so obvious I don’t even need to think—the account is dancing on its own. While everyone was still watching from the sidelines, I already felt something was off. It had clearly moved sideways at the highs for so long, selling pressure kept building, yet trading volume kept shrinking. That wasn’t a good sign.

I saw it even more clearly as it formed a base intraday: insufficient support, with no one willing to buy on the way up. This kind of price-volume divergence couldn’t last long. So around 0.03576, I directly shared a short-selling idea, focusing on going with the trend.

No
post-image
SNDK+11.75%
ADA-4.93%

$BTC Signal】Go long—1H volume contraction, decline halted, buy at lows
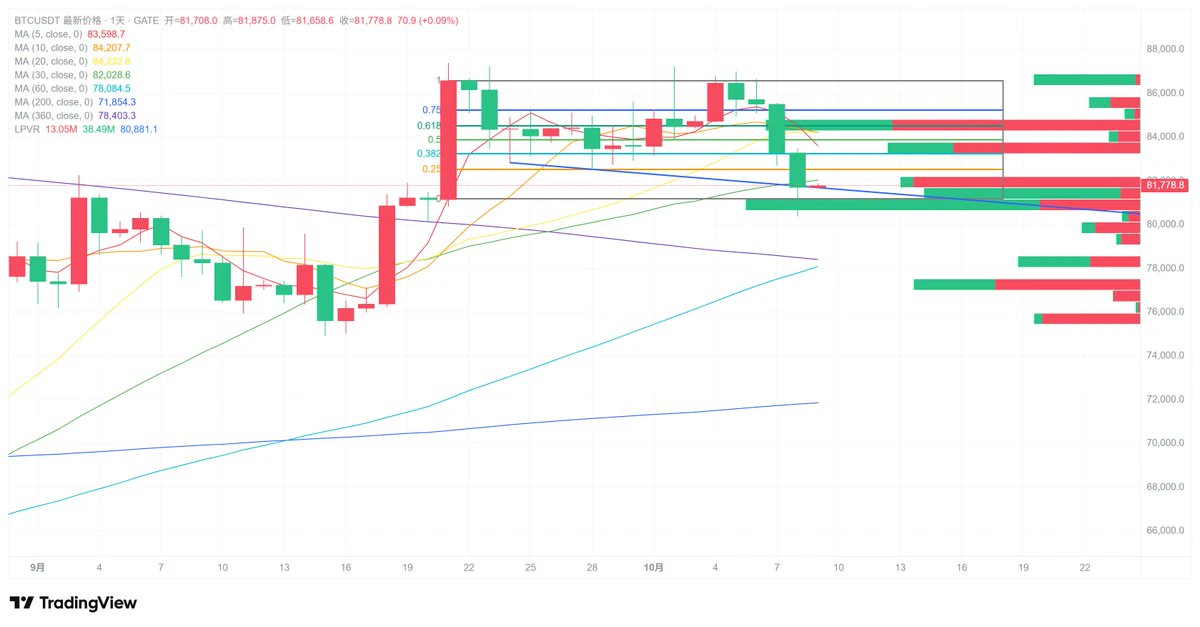
$BTC Order book buy/sell imbalance: -83.59%; the sell wall remains intact; volume at 13:00 contracted to 1131, and active selling pressure has dried up. Price at 79531 is hugging the outside of the lower Bollinger Band, while the 1H chart left a $178 lower wick, with low-level buying support beginning to emerge. RSI(1H) has slid to 41, while the 4H MACD histogram remains positive, creating conditions for an oversold recovery.
🎯 Direction: Long
⚡ Entry/limit order: 79292.41 - 79531.00
🛑 Stop-loss: 78735.69
🚀 Target 1:
post-image
BTC-1.89%
$PI Pi (π) is an irrational number, which means its decimal digits never end and never repeat in a specific pattern.
Mathematicians have calculated it to more than 100 trillion digits using supercomputers, but we are still far from "solving it," because it has no end.
For context, NASA uses only 15 digits of Pi for its most precise interplanetary calculations. Everything beyond that is purely mathematical curiosity, not a practical necessity.
Pi's infinite, patternless nature makes it a favorite symbol for concepts that resist simple boundaries, which is fitting given how often the crypto com
post-image
PI-1.94%
CRYPTO THINGS YOU MAY HAVE MISSED — LAST 24 HOURS | 4 SEPTEMBER 2026
Institutions bought nearly $1B through crypto ETFs—yet bitcoin:native fell after one macro release.
That divergence matters.
🧵👇
1/3 — US JOBS CRUSHED EXPECTATIONS
August payrolls rose 162,000 versus 56,000 expected. Unemployment held at 4.1%.
Markets lifted the probability of a September Fed hike to roughly 62%.
Higher-rate expectations strengthened the dollar, pushed yields higher and sent bitcoin:native down 2.3% to around $79,595.
Translation: liquidity remains more powerful than crypto-specific narratives. BLS | Reuters
post-image
BTC-2.35%
ETH-2.49%
HBAR-1.53%
XLM-2.51%
XDC-1.56%
$$Lobster's 29% gain: 87M in trading volume shows you what turnover-based distribution looks like
The price of 0.0938 is stuck between 0.1027 and 0.0711, with trapped holders above and profit-taking holders below. Going long here is just handing fees to the market maker. My system shows that the 0.0711–0.1027 range has already seen massive volume, but the price has failed to make a new high—a textbook distribution structure.
Here's the trading plan: Entry zone: enter only after a pullback to 0.084–0.086 holds; abandon the trade if it breaks 0.083. Stop-loss: 0.0805 (hard stop; a break below me
龙虾+29.85%
I originally wanted to sell at a loss as an offering to the heavens, but the ritual never happened—the meat cooked itself. When I checked the chart after lunch, $OPENAI was grinding around 1206.57. Seeing that long lower wick, I knew right away: this was a textbook pullback holding firm, with bottom-buying pressure insanely strong.
The thinking at the time was very simple: hold as long as the key level doesn't break, and leave only if it does. Who could have expected an afternoon surge straight to 1379.11, sending paper profits to +282.19%? The brothers on board should have woken up laughing.
post-image
OPENAI-0.39%
LAB-0.12%
DOGE-3.36%
📊 $龙虾 #Meme ⚡ Bullish
🦞 龙虾 EXPLODES to Fresh Highs Near $0.0847 Meme Momentum Still Building
This Chinese meme coin bottomed hard at $0.058 after an earlier violent spike-and-crash, then ground steadily higher through a long base before punching to a brand new local high on a powerful green candle. With MAs bullish-stacked and no rejection wick yet, this looks like fresh momentum reasserting itself.
Signal Block
- Pair: $龙虾 /USDT
- Type: LONG
- Leverage: 3x
- Entry Zone: $0.0795 – $0.0820
- Take Profit:
TP1 $0.0845 +27.4%
TP2 $0.0870 +40.6%
TP3 $0.0887 +49.4%
TP4 $0.0920 +67.0%
- Stop
post-image
龙虾+29.57%
  • 8
  • 3
The market makers are doing magic 🫵😹
$BTC
post-image
BTC-1.86%
  • 1
$ETH Signal】Bearish pressure + 1H breakdown
$ETH 1H Bollinger Bands are opening downward, the MACD histogram is weakening continuously, and 4H bullish momentum is contracting. Bids are weak around 2442, with sell orders pushing price down to 2451.
🎯Direction: short
⚡Entry/limit order: 2444.27 - 2451.62
🛑Stop-loss: 2476.14
🚀Target 1: 2414.85
🚀Target 2: 2396.46
🛡️Trade management:
- Reduce the position by 50% at Target 1 and move the stop-loss up to breakeven. If the price falls back to the entry level, exit automatically to protect the principal.
In-depth logic: The funding rate of 0.0025
post-image
ETH-1.97%
BTC-1.86%
SOL-2.34%
BULLS ARE COMING
BULLS ALWAYS WIN
🚀🚀🚀🚀
post-image
$PUMP I’m bullish. Whales’ long-to-short ratio is 2.59 times that of retail traders, and the gap is right there—the price is 0.00421, down 23% from the 90-day high, yet retail traders are still desperately piling into short positions while whales are taking the opposite side and going long. The $93.0M in futures open interest also shows that the positions haven’t dispersed; this isn’t an abandoned market. Over the next 24 hours, I expect a bullish, consolidating range with limited downside, looking more like a gradual grind designed to wear down retail shorts. The 2.59x gap is right there, and
post-image
PUMP-1.47%
Bitlayer (BTR), the native asset of the Bitlayer ecosystem, continues to seek consolidation at its bottom levels after a sharp 70.2% pullback over the past 7 days. The BTR/USDT spot pair, recovering from its intraday low of 0.04547 USDT with buying interest, rose by 10.58% to 0.05278 USDT. Perpetual futures (Perp) contracts are trading at 0.05298 USDT, up 10.74%.
Volume Indicators and Capital Flows
Despite the immediate price rebound, derivative market and capital flow data indicate a cautious outlook:
Trading Volume: In the last 24 hours, the Gate spot market recorded a trading volume of 59.6
BTR+13.45%
  • 12
  • 2
With this trend, I don’t even need to think—the account is dancing on its own.
While everyone else was still watching from the sidelines, I kept my eye on those few rebounds. The volume didn’t follow, and the price stayed under pressure—clearly, there was no one willing to take it higher. I quietly entered a short at 0.3043, and it felt great. At the time, I even wondered if I was acting too soon, but the market immediately proved me right.
Now the price has slid to 0.2368, with returns at +435.46%. That was a satisfying bite of profit. The timing was right, and the wait was worth it. I’ve tak
post-image
BNB-0.70%
SNDK+11.75%
Nobody’s watching $HOME /USDT while it quietly sets up a 95% confidence trap.

$HOME /USDT - SHORT

Trade Plan:
Entry: 0.006 – 0.006
SL: 0.006
TP1: 0.006
TP2: 0.006
TP3: 0.006

Why this setup?
- 4H bias is SHORT with a 95.0 score—that’s not a whisper, that’s a shout.
- Daily trend is bearish, and RSI on 15m sits at 46.11: room to drop before touching oversold.
- ATR on 1H is tight (0.000058), meaning the breakout, when it comes, will be violent.
- Why now? Price is glued to 0.006, but the “Armed” status says the trigger is loaded—not fired.

Debate:
Are you fading this 0.006 level to
HOME-1.15%
$4 Signal】1H volume breakout, bullish continuation
$4 broke above the upper Bollinger Band on heavy 1H volume, while the 4H MACD shows bullish expansion and the current price is hugging the outer channel. RSI 79.9 is flattening in overbought territory, with a 4.34% order book depth imbalance and buyers slightly dominant. OI is stable, with no signs of a squeeze, and the 0.025% funding rate shows no overheating.
🎯Direction: Long
⚡Entry/Limit Order: 0.02358304 - 0.02365400
🛑Stop-loss: 0.02341746
🚀Target 1: 0.02400881
🚀Target 2: 0.02418622
🛡️Trade Management:
- Reduce the position by 50% up
post-image
4+44.57%
BTC-1.86%
ETH-1.93%
SOL-2.34%
A deeper correction sub 58k would be a movie 🍿📺
$BTC
post-image
BTC-1.86%
  • 2
$DOGE broke out — but $1 isn’t the signal to watch yet.
The immediate target is $0.12, while the 2-week LMACD is approaching a potential bullish cross. Historical similarities can add context, but they don’t guarantee the same outcome.
With ~155.8B DOGE circulating, $1 would imply a $155B+ market cap — requiring major demand and liquidity.
$0.12 → near-term target
Hold breakout → confirmation
Lose breakout → setup weakens
$1 is a scenario, not a prediction.
What level are you watching?
#DOGE #Dogecoin #Gateio
post-image
DOGE-3.36%
  • 4
Everyone’s watching XRP’s rebound—but this 4h chart is screaming something else entirely.

$XRP /USDT - SHORT

Trade Plan:
Entry: 1.3900 – 1.3976
SL: 1.4300
TP1: 1.3667
TP2: 1.3486
TP3: 1.3215

Why this setup?
- Price is pinned at 1.3938 with a hard ceiling at 1.4057—that’s your invalidation line.
- RSI (15m) at 38.82 shows momentum is fading, not flipping.
- ATR (1h) of 0.015 suggests low volatility = compressed spring, but direction remains SHORT with 55% confidence.
- The range-bound 1D trend means we’re not breaking out; we’re rejecting.
- Why now? Because 1.3900–1.3976 is the l
XRP-4.11%
Load More

Join 40 M users in our growing community

⚡️ Join 40 M users in the crypto craze discussion

💬 Engage with your favorite top creators

👍 See what interests you

View More