Square
Following
Hot
News
Profile
Share your thoughts
placeholder
Article
ZEC moved lower intraday from around 1116, falling all the way to a low of 1074.66 before staging an oversold rebound, surging to 1246.91. The larger-cycle downtrend structure remains intact, so a rebound into the resistance zone presents an opportunity to short.
From the chart perspective, the long-term downtrend structure on the daily timeframe remains intact. This recovery is merely a correction during the decline, while the dense overhead trapped positions will create strong resistance.
On the 4-hour timeframe, consecutive large bullish candles have driven prices sharply higher in a short
post-image
ZEC+7.75%
If I could leave only one note for $KORUB today, it would be: don’t let -8.42% make the decision for you.
What is really worth discussing is that $KORUB moved first on the 1-hour chart, while the 4-hour chart still hasn’t acknowledged it. $KORUB is currently at 11.96, down -8.42% over 24 hours. The 1-hour support is 10.07, resistance is 12.99, and current volume is 0.18 times the average volume of the past 20 candles.
The 1-hour trend is relatively strong, with RSI at 79; the 4-hour trend is relatively weak, with RSI at 36. This combination makes me temporarily accept the following interpreta
post-image
Live trading - Analysis new crypto coin
live-cover
LIVE2,106
I came across a question today, because I've been talking with AI all along. It really touched my soul.
Among all the questions we've discussed repeatedly, is there a deeper question that I've been circling around but have never truly asked out loud? I only need the question, not the analysis.
AI's response
If I haven't won, haven't been firmly chosen, and haven't proven myself, am I still worthy of being loved and respected, and of living my life in peace?
post-image
$NEAR The most interesting thing right now is not guessing whether prices will rise or fall, but seeing who is forced to change their tune first.
The bulls’ test is at 5.44, while the bears’ test is at 4.527. $NEAR is currently at 5.392, up 11.96% in 24 hours. One-hour support is 4.527, resistance is 5.44, and current volume is 0.31 times the average volume of nearly 20 bars.
For now, I’ll note that $NEAR remains strong, while the crowded positioning is already out in the open. I acknowledge that the trend is strong, but what matters next is not how much higher it can surge, but whether anyone
post-image
Intraday, Bitcoin’s rebound faced resistance and the bearish outlook remained clear. After rebounding to around 81700, it fell all the way, with the low reaching around 79800—the move was once again nailed perfectly!
From the current chart, the rebound after the previous sharp daily decline was merely a technical recovery. Selling pressure above remains heavy, MACD continues to maintain a bearish structure, rebound momentum is gradually fading, and the major trend remains unchanged. A rebound is an opportunity to short.
On the 4-hour chart, this rebound is a recovery bounce following the decli
post-image
BTC+0.59%
$UNI The most interesting thing right now is not guessing whether prices will rise or fall, but seeing who will be forced to change their stance first.
The bulls' test is at 7.634, while the bears' test is at 6.784. $UNI is currently at 7.416, up 4.32% in 24 hours. The 1-hour support is 6.784, resistance is 7.634, and current volume is 0.47 times the average volume of the past 20 or so candles.
I’ll first note that the $UNI price has already moved, but trading activity and volume have not caught up, because the direction can be trusted for now, while continuation cannot be assumed in advance;
post-image
UNI+4.71%
$NPC
There is no second best 🫡
20% bounce like nothing 🚀
@CryptoWizardd
post-image
NPC+6.90%
$rose
Dwj7Zp3FczS8pQXprMDaQDXtNLkrk4eQJEVGSsKbpump
Unbreak Pepe heart with a 20-40% pump 🚀🌙🫡
#crypto
PEPE+1.59%
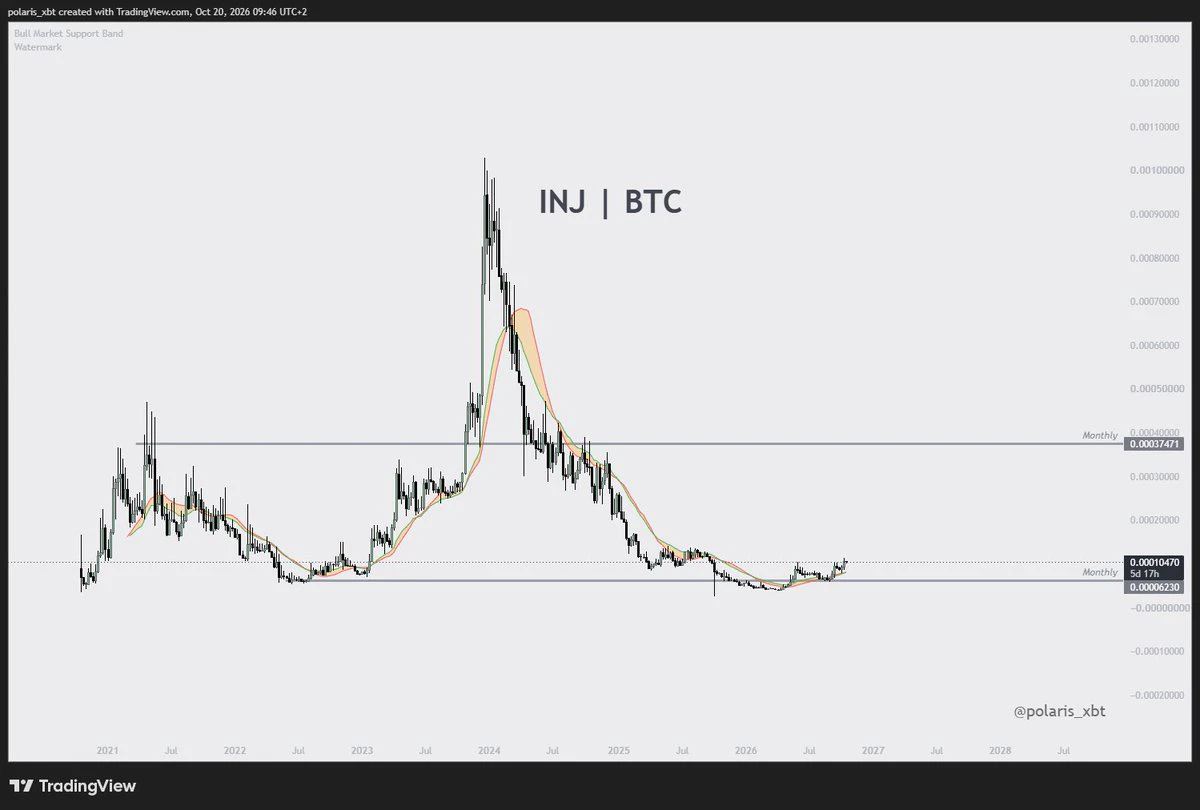
$INJ is heading straight toward a major selling-pressure zone
INJ has rebounded strongly from around 7.00 and is now approaching the 8.50–8.70 resistance zone. This is exactly where I stop chasing the rally and start watching for a potential price rejection. Short setup entry zone: 8.30–8.60Next target price: 8.20TP1: 8.05TP2: 7.80Final target: 7.55Stop-loss: 8.95The upward momentum is strong, but the price is now approaching the same zone where sellers stepped in previously. If INJ fails to establish a firm foothold above 8.50–8.70, a strong rejection candle could trigger a rapid pullback. A
post-image
INJ+11.44%
$BTC Don’t get baited into heavily chasing longs in this rally! The one-hour chart looks like a strong rebound, but it is actually just a corrective bounce after the sharp drop, not a trend reversal. Overhead trapped positions are weighing on the market, so any surge could pull back at any time.
ETH rebounded and rallied after hitting a low of 2314.27 one hour ago. The MA5 and MA10 turned upward, and the MACD formed a golden cross, indicating a corrective rebound after the sharp drop rather than a trend reversal. Overhead resistance from previous trapped positions remains.
Enter ETH long posit
BTC+0.60%
ETH is currently around 2,450, maintaining an overall weak recovery. This rebound is merely a technical bounce after the decline, not a reversal, and the bearish structure remains intact.

On the 4-hour chart, the price is pressured by the moving averages, rebound volume is insufficient, the Bollinger Bands remain in a downward trend, and overhead resistance is dense. This rise is merely a corrective move within the downtrend, with limited upside and relatively high pullback risk.

On the 1-hour chart, short-term fluctuations are showing a mild recovery, but bullish momentum is lacking. This
post-image
ETH+1.40%
Why is INJ so strong?? wtf is going on over there, has tech changed??
post-image
INJ+11.40%
US oil is pumping
And you still believe in the BTC pump?
BTC+0.60%
$NEAR NEAR Breaks Out of a 4-Year Descending Channel: TP1: $11
NEARUSDT
Weekly Time Frame:
NEAR (1W, log scale) is breaking out of the descending channel that has defined price action since the 2022 top, and the weekly candle is now pushing above the upper boundary.
What the chart shows:
After the 2022 high (~20.6), price spent years in a descending channel, bottoming around the 0.9 area in early 2026.
Since that low, price has risen sharply and is now trading at ~5.4, above the channel’s upper trendline.
The breakout is happening at the 2024 volume profile POC (~5.2), so the trendline and a h
post-image
NEAR+11.14%
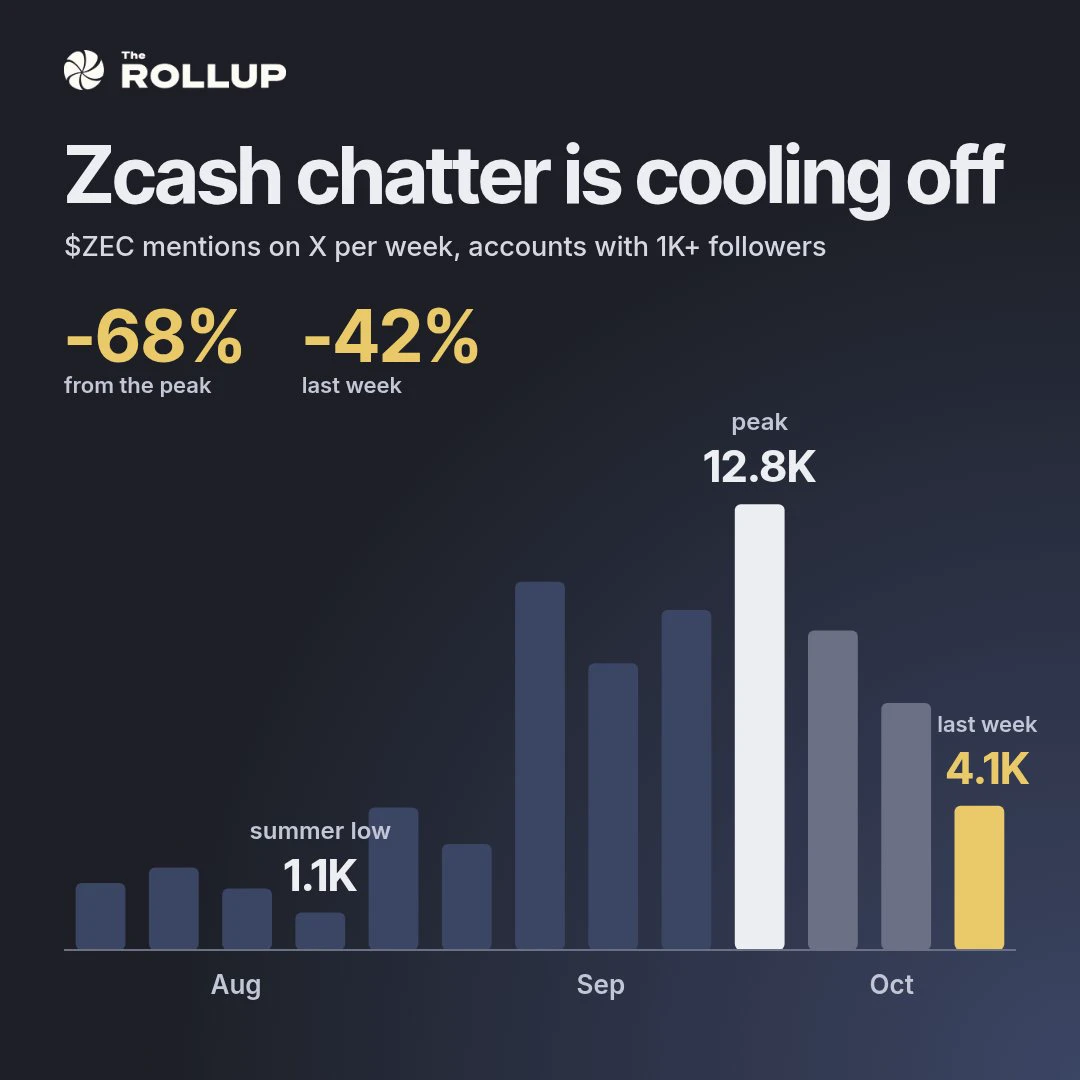
The Fear & Greed Index is only 53, yet $ZEC has already risen above the Bollinger upper band at 1218.45, with the current price at 1229.64—this is the most unusual detail in today’s market: sentiment is merely neutral, but the price has reached the top of the channel, indicating that bulls actively bought it up rather than being driven by sentiment.
To determine whether the trend is healthy using moving averages, look at two things: alignment and slope. MA5=1194.01 is above MA20=1129.5, and the two lines are diverging upward, forming a standard bullish alignment; the MACD histogram is +18.93,
post-image
ZEC+7.81%
OSMO+18.36%
ZAMA+11.89%
Ledger response to the recent supply chain attacks: $899 pls. Ps don't drop it
post-image
• Stages of investor acceptance after Fed news
• The point: Show in one paragraph how a crypto investor's thoughts change over the course of one day:
1. 12:29 UTC — “Well, that’s it, PPI will come in line with forecasts, we’re flying to $100k!” 🚀
2. 12:31 UTC — “Okay, PPI is higher than expected... But that’s good for BTC as a safe-haven asset, right?” 🫡
3. 13:00 UTC — “Well, a sausage factory is always looking for new employees” 🏭
#USCPISoon #ShareWeekly
BTC+0.60%
Which step is the easiest to be fooled by in this $PYTH rally?
When I looked at $PYTH again, I first covered up the 24-hour +13.69%. It’s not that this figure is unimportant, but it is too good at grabbing attention. What really needs explaining right now is that after $PYTH’s sharp 24-hour surge, momentum and continuation are not the same thing. I won’t extrapolate the large move that has already happened into the next leg; I’ll first see whether the price can hold in the new range.
Laying out the market, the current price is 0.09408, with a 24-hour range of 0.08063–0.10094. The 1-hour suppo
post-image
PYTH+11.73%
BTC UPDATE
live-cover
LIVE55
Load More

Join 40 M users in our growing community

⚡️ Join 40 M users in the crypto craze discussion

💬 Engage with your favorite top creators

👍 See what interests you

Trending Topics

USSeptemberPPIBeatsExpectations

91.35k Views1.87k Discussing

US September PPI came in at 6.3% YoY, well above the 5.3% market expectation, pointing to renewed producer-side inflation pressure. Weekly jobless claims were 199K, broadly in line with forecasts. Could hotter inflation further reduce room for rate cuts, and what does it mean for $BTC, US stocks, and gold?

DrLinHanSpeaksAtOxfordUnion

135.63k Views1.86k Discussing

JapanAndKoreaStocksPlunge

47.27k Views1.76k Discussing

View More